In the evolving landscape of regulated electric utilities, WEC Energy Group, Inc. and FirstEnergy Corp. stand out as key players delivering critical energy solutions across multiple states. Both companies share a focus on traditional and renewable energy sources, making them direct competitors within the same industry. This article will analyze their market positions, innovation strategies, and financial health to help you decide which stock might be the smarter addition to your portfolio.

Table of contents
Companies Overview
I will begin the comparison between WEC Energy Group and FirstEnergy Corp. by providing an overview of these two companies and their main differences.
WEC Energy Group Overview
WEC Energy Group, Inc. provides regulated natural gas, electricity, and renewable energy services in the US. Operating through six segments, it generates and distributes power from diverse sources including coal, natural gas, wind, and solar. The company manages extensive electric and natural gas infrastructure, serving customers primarily in Wisconsin and Illinois. Headquartered in Milwaukee, WEC Energy Group has a market cap of approximately 33.5B USD.
FirstEnergy Corp. Overview
FirstEnergy Corp. generates, transmits, and distributes electricity across several US states including Ohio and Pennsylvania. Its operations are divided into Regulated Distribution and Transmission segments, utilizing coal, nuclear, hydroelectric, natural gas, wind, and solar power. The company serves around 6M customers and maintains a broad transmission and distribution network. Headquartered in Akron, FirstEnergy has a market cap near 25.8B USD.
Key similarities and differences
Both WEC Energy Group and FirstEnergy operate in the regulated electric utilities sector with diversified generation assets including renewables. They provide electricity transmission and distribution services in the US. WEC operates more segments and a larger natural gas infrastructure, while FirstEnergy serves more customers and has a bigger workforce. Market capitalization and geographic focus also differ, with WEC concentrated in the Midwest and FirstEnergy covering multiple eastern states.
Income Statement Comparison
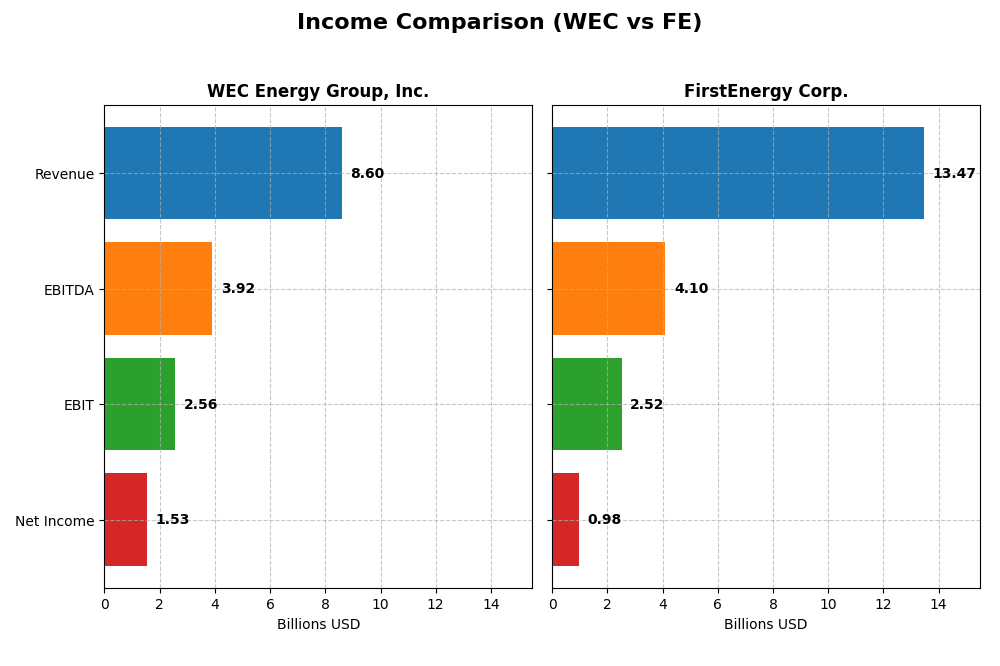
This table presents a side-by-side comparison of key income statement figures for WEC Energy Group, Inc. and FirstEnergy Corp. for the fiscal year 2024.
| Metric | WEC Energy Group, Inc. | FirstEnergy Corp. |
|---|---|---|
| Market Cap | 33.5B | 25.8B |
| Revenue | 8.6B | 13.5B |
| EBITDA | 3.9B | 4.1B |
| EBIT | 2.6B | 2.5B |
| Net Income | 1.53B | 978M |
| EPS | 4.81 | 1.7 |
| Fiscal Year | 2024 | 2024 |
Income Statement Interpretations
WEC Energy Group, Inc.
WEC Energy Group showed overall growth in revenue and net income from 2020 to 2024, with revenue rising 18.76% and net income increasing 27.25%. Margins improved notably, with a gross margin at 44.02% and net margin at 17.77%. In 2024, revenue slightly declined by 3.3%, but net income and margins grew, reflecting improved operational efficiency.
FirstEnergy Corp.
FirstEnergy’s revenue increased steadily by 24.86% over the period, reaching $13.47B in 2024. However, net income declined by 9.36%, with net margin dropping to 7.26%. The 2024 fiscal year saw a 4.68% revenue rise but a net income decrease of 11.46% and margin contraction, indicating pressure on profitability despite top-line growth.
Which one has the stronger fundamentals?
WEC Energy Group demonstrates stronger fundamentals with consistent margin improvements and net income growth, despite a slight revenue dip in 2024. FirstEnergy’s higher revenue growth contrasts with significant net income and margin declines, reflecting challenges in converting sales into profits. Overall, WEC’s income statement trends appear more favorable.
Financial Ratios Comparison
The table below presents the most recent financial ratios for WEC Energy Group, Inc. and FirstEnergy Corp. as of fiscal year 2024, allowing for a side-by-side analysis of key performance and financial health indicators.
| Ratios | WEC Energy Group, Inc. | FirstEnergy Corp. |
|---|---|---|
| ROE | 12.3% | 7.85% |
| ROIC | 4.14% | 3.66% |
| P/E | 19.46 | 23.39 |
| P/B | 2.39 | 1.84 |
| Current Ratio | 0.60 | 0.56 |
| Quick Ratio | 0.43 | 0.45 |
| D/E (Debt-to-Equity) | 1.64 | 1.95 |
| Debt-to-Assets | 42.9% | 46.6% |
| Interest Coverage | 2.64 | 2.35 |
| Asset Turnover | 0.18 | 0.26 |
| Fixed Asset Turnover | 0.25 | 0.33 |
| Payout Ratio | 69.1% | 99.2% |
| Dividend Yield | 3.55% | 4.24% |
Interpretation of the Ratios
WEC Energy Group, Inc.
WEC shows strong net margin at 17.77% and favorable WACC at 5.3%, but faces challenges with low current and quick ratios (0.6 and 0.43) and a high debt-to-equity ratio of 1.64, indicating liquidity and leverage concerns. Return on equity is neutral at 12.3%. The company pays a dividend with a favorable 3.55% yield, suggesting consistent shareholder returns.
FirstEnergy Corp.
FirstEnergy has a neutral net margin of 7.26% but unfavorable returns including ROE at 7.85% and ROIC at 3.66%, reflecting weaker profitability. Liquidity ratios are low, with a current ratio of 0.56 and debt-to-equity at 1.95, signaling financial risk. Dividend yield is 4.24%, favorable but with notable leverage and coverage risks. Overall, some ratios remain neutral.
Which one has the best ratios?
Both companies exhibit slightly unfavorable overall ratio profiles, with WEC showing stronger profitability and better dividend yield but weaker liquidity and leverage metrics. FirstEnergy faces more pronounced profitability and leverage challenges despite a higher dividend yield. Neither stands out decisively, as both have mixed strengths and weaknesses in key financial ratios.
Strategic Positioning
This section compares the strategic positioning of WEC Energy Group, Inc. and FirstEnergy Corp., focusing on market position, key segments, and exposure to technological disruption:
WEC
- Market leader in regulated electric utilities with moderate competitive pressure.
- Diverse segments: Wisconsin, Illinois, Other States, Non-Utility Energy Infrastructure.
- Exposure includes renewable energy services and traditional energy sources.
FE
- Operates in regulated electric sector with significant competition.
- Focused on Regulated Distribution and Regulated Transmission segments.
- Owns coal, nuclear, natural gas, hydro, wind, and solar assets.
WEC vs FE Positioning
WEC shows a diversified geographic and business segment approach, including non-utility infrastructure, while FE concentrates on regulated distribution and transmission. WEC’s broader segment mix contrasts with FE’s more focused structure, affecting risk and growth profiles differently.
Which has the best competitive advantage?
Both companies are shedding value with ROIC below WACC. WEC’s slightly unfavorable rating with growing profitability contrasts with FE’s very unfavorable rating and declining ROIC, indicating WEC currently maintains a comparatively stronger competitive position.
Stock Comparison
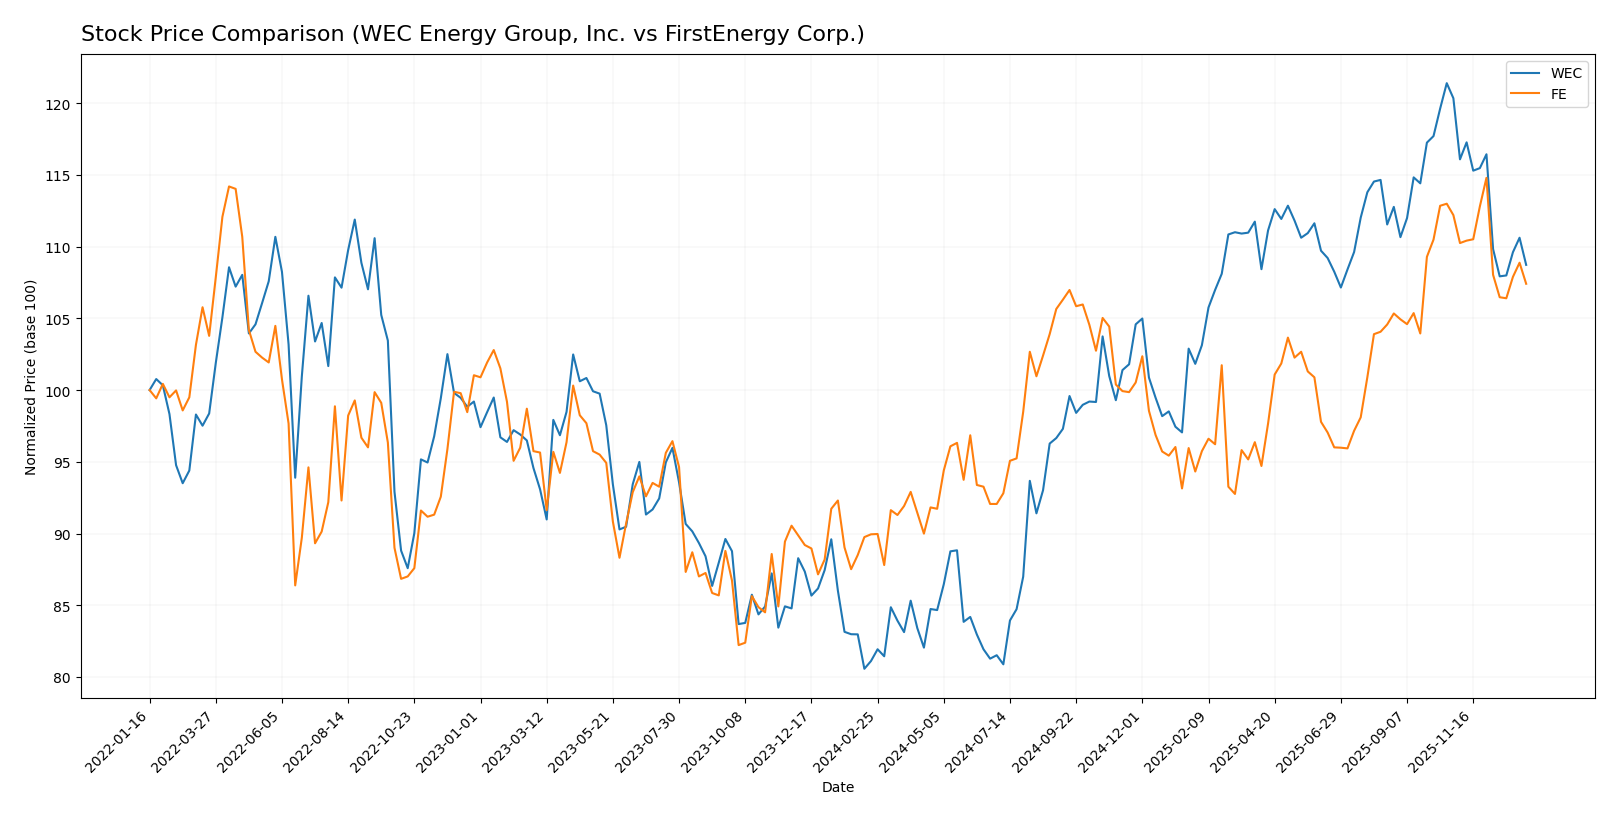
The past year has seen notable bullish trends for both WEC Energy Group, Inc. and FirstEnergy Corp., with WEC showing a stronger price increase but recent declines in both stocks indicating a shift in trading momentum.
Trend Analysis
WEC Energy Group’s stock gained 34.05% over the past 12 months, marking a bullish trend with decelerating momentum. High volatility is noted, with prices ranging from 77.85 to 116.84.
FirstEnergy Corp. experienced a 19.42% rise over the same period, also bullish with deceleration and lower volatility. Prices fluctuated between 36.5 and 47.72.
Comparatively, WEC outperformed FirstEnergy, delivering the highest market gain despite recent downward pressure on both stocks in the last quarter.
Target Prices
The consensus target prices for WEC Energy Group, Inc. and FirstEnergy Corp. indicate moderate upside potential for both utilities.
| Company | Target High | Target Low | Consensus |
|---|---|---|---|
| WEC Energy Group, Inc. | 136 | 105 | 122.67 |
| FirstEnergy Corp. | 54 | 46 | 49.29 |
Analysts expect WEC’s stock price to rise from its current 104.65 USD toward the consensus of 122.67 USD, while FirstEnergy’s current price of 44.65 USD also shows potential to approach the 49.29 USD consensus target.
Analyst Opinions Comparison
This section compares analysts’ ratings and grades for WEC and FE based on key financial scores:
Rating Comparison
WEC Rating
- Rating: B-, considered Very Favorable.
- Discounted Cash Flow Score: 1, rated Very Unfavorable, indicating weak DCF.
- ROE Score: 4, rated Favorable, showing efficient profit generation.
- ROA Score: 4, rated Favorable, indicating effective asset utilization.
- Debt To Equity Score: 2, rated Moderate, suggesting moderate financial risk.
- Overall Score: 3, rated Moderate.
FE Rating
- Rating: B, also considered Very Favorable.
- Discounted Cash Flow Score: 4, rated Favorable, indicating strong DCF.
- ROE Score: 4, rated Favorable, showing efficient profit generation.
- ROA Score: 3, rated Moderate, indicating decent asset utilization.
- Debt To Equity Score: 1, rated Very Unfavorable, indicating higher financial risk.
- Overall Score: 3, rated Moderate.
Which one is the best rated?
FE holds a better rating with a B compared to WEC’s B-. FE’s discounted cash flow score is significantly stronger, while both share favorable ROE scores. However, FE’s debt to equity score is less favorable, reflecting higher financial risk.
Scores Comparison
Here is a comparison of the Altman Z-Score and Piotroski Score for both companies:
WEC Scores
- Altman Z-Score: 1.14, in distress zone indicating high bankruptcy risk.
- Piotroski Score: 6, classified as average financial strength.
FE Scores
- Altman Z-Score: 0.78, in distress zone indicating high bankruptcy risk.
- Piotroski Score: 6, classified as average financial strength.
Which company has the best scores?
Both WEC and FE are in the distress zone per Altman Z-Score, indicating elevated bankruptcy risk. Each company has the same Piotroski Score of 6, reflecting average financial strength. Thus, their scores are comparable based on the data provided.
Grades Comparison
The following summarizes the recent grades assigned to WEC Energy Group, Inc. and FirstEnergy Corp.:
WEC Energy Group, Inc. Grades
This table displays the latest grades and actions from leading grading companies for WEC Energy Group, Inc.
| Grading Company | Action | New Grade | Date |
|---|---|---|---|
| B of A Securities | Maintain | Neutral | 2025-12-31 |
| UBS | Maintain | Neutral | 2025-12-17 |
| Barclays | Maintain | Underweight | 2025-12-16 |
| Keybanc | Maintain | Overweight | 2025-12-12 |
| JP Morgan | Maintain | Neutral | 2025-12-11 |
| Scotiabank | Maintain | Sector Outperform | 2025-10-31 |
| BMO Capital | Maintain | Market Perform | 2025-10-21 |
| Barclays | Maintain | Equal Weight | 2025-10-21 |
| Keybanc | Maintain | Overweight | 2025-10-15 |
| UBS | Maintain | Neutral | 2025-10-10 |
Overall, WEC Energy Group’s grades show a mixed but generally neutral to positive stance, with several firms maintaining neutral or overweight ratings.
FirstEnergy Corp. Grades
The table below lists recent grades and rating actions from recognized grading firms for FirstEnergy Corp.
| Grading Company | Action | New Grade | Date |
|---|---|---|---|
| UBS | Maintain | Neutral | 2025-12-17 |
| Mizuho | Maintain | Neutral | 2025-10-24 |
| Scotiabank | Maintain | Sector Outperform | 2025-10-24 |
| UBS | Maintain | Neutral | 2025-10-24 |
| Morgan Stanley | Maintain | Overweight | 2025-10-21 |
| Jefferies | Maintain | Hold | 2025-10-21 |
| Keybanc | Downgrade | Sector Weight | 2025-10-15 |
| Scotiabank | Maintain | Sector Outperform | 2025-10-06 |
| Morgan Stanley | Maintain | Overweight | 2025-09-25 |
| Barclays | Upgrade | Overweight | 2025-08-25 |
FirstEnergy Corp. exhibits a generally positive outlook with multiple overweight ratings and consistent sector outperform grades, despite a recent downgrade by Keybanc.
Which company has the best grades?
Both WEC and FirstEnergy carry predominantly neutral to positive grades, but FirstEnergy shows a slightly stronger bias toward overweight and sector outperform ratings. This difference may reflect varying analyst confidence levels, potentially impacting investor sentiment and portfolio positioning.
Strengths and Weaknesses
The table below summarizes the key strengths and weaknesses of WEC Energy Group, Inc. and FirstEnergy Corp. based on their diversification, profitability, innovation, global presence, and market share using the most recent data.
| Criterion | WEC Energy Group, Inc. | FirstEnergy Corp. |
|---|---|---|
| Diversification | Moderate: Revenue mainly from Wisconsin (6.33B) and Illinois (1.6B), plus Non-Utility Energy Infrastructure (691M) | Moderate: Focused on Regulated Distribution (6.86B) and Transmission (1.79B) segments |
| Profitability | Mixed: Net margin 17.77% (favorable), ROIC 4.14% (unfavorable), ROE 12.3% (neutral) | Weaker: Net margin 7.26% (neutral), ROIC 3.66% (unfavorable), ROE 7.85% (unfavorable) |
| Innovation | Limited: No strong indicators of innovation or new growth segments | Limited: Primarily regulated energy services with no major innovation drivers reported |
| Global presence | Regional US focus, mainly Midwest states | Regional US focus, primarily in regulated markets |
| Market Share | Strong in Wisconsin and Illinois markets | Strong in Regulated Distribution and Transmission within its service areas |
Key takeaways: WEC Energy Group shows slightly better profitability and a more balanced revenue base across states and infrastructure segments compared to FirstEnergy. Both companies lack significant innovation and have regional market focuses. FirstEnergy’s declining profitability and ROIC trend suggest higher investment risk.
Risk Analysis
Below is an overview of key risks for WEC Energy Group, Inc. (WEC) and FirstEnergy Corp. (FE) based on their latest financial and operational data from 2024.
| Metric | WEC Energy Group, Inc. (WEC) | FirstEnergy Corp. (FE) |
|---|---|---|
| Market Risk | Beta 0.57 (moderate volatility) | Beta 0.63 (moderate volatility) |
| Debt level | Debt/Equity 1.64 (unfavorable) | Debt/Equity 1.95 (unfavorable, higher leverage) |
| Regulatory Risk | High, due to regulated electric utility sector | High, similar regulatory exposure in electric utilities |
| Operational Risk | Asset turnover low (0.18, unfavorable) | Asset turnover low (0.26, unfavorable) |
| Environmental Risk | Coal, gas, renewables mix; transition risks exist | Coal, nuclear, gas, renewables mix; transition risks significant |
| Geopolitical Risk | Moderate; US-centric operations | Moderate; US-centric operations |
Both companies face significant regulatory risks inherent to the utility sector, alongside operational risks from low asset turnover indicating efficiency challenges. FirstEnergy’s higher debt level and distress-zone Altman Z-score signal increased financial vulnerability. Environmental transition risks also weigh on both due to coal reliance amid shifting policies.
Which Stock to Choose?
WEC Energy Group, Inc. shows a favorable income statement with strong net margin growth of 18.58% in 2024 and a 27.25% net income increase over five years. Its financial ratios reveal a slightly unfavorable profile due to weak liquidity and asset turnover, despite a favorable dividend yield. The company carries moderate debt and holds a very favorable overall rating of B-.
FirstEnergy Corp. exhibits mixed income trends, with a 4.68% revenue growth but unfavorable net margin and EPS declines over the past year and overall period. Its financial ratios are slightly unfavorable, marked by high debt-to-equity and moderate profitability. The company holds a very favorable rating of B but faces declining profitability and weaker income growth.
For investors prioritizing income statement strength and stable profitability, WEC might appear more favorable given its consistent earnings growth and dividend yield. Conversely, investors with tolerance for higher risk and focus on valuation metrics may find FirstEnergy’s moderate rating and recent revenue growth worth observing, though its declining profitability could signal caution.
Disclaimer: Investment carries a risk of loss of initial capital. The past performance is not a reliable indicator of future results. Be sure to understand risks before making an investment decision.
Go Further
I encourage you to read the complete analyses of WEC Energy Group, Inc. and FirstEnergy Corp. to enhance your investment decisions: