The Southern Company (SO) and FirstEnergy Corp. (FE) are two major players in the regulated electric utility sector, serving millions of customers across various U.S. states. Both companies focus on power generation, transmission, and distribution, with growing investments in renewable energy and infrastructure innovation. This comparison will help investors understand which company offers the most compelling opportunity in a transitioning energy market. Let’s explore which stock could best enhance your portfolio.

Table of contents
Companies Overview
I will begin the comparison between The Southern Company and FirstEnergy Corp. by providing an overview of these two companies and their main differences.
The Southern Company Overview
The Southern Company is a leading energy provider that engages in the generation, transmission, and distribution of electricity and natural gas. It operates a diverse portfolio including fossil fuel, nuclear, hydroelectric, solar, wind, and battery storage facilities. Serving approximately 8.7 million customers across several states, Southern Company also offers digital wireless communications and fiber optics services, positioning itself as a comprehensive utility provider.
FirstEnergy Corp. Overview
FirstEnergy Corp. operates primarily in electricity generation, transmission, and distribution across six states. It owns a mix of coal-fired, nuclear, hydroelectric, natural gas, wind, and solar power plants, supporting a customer base of around 6 million. The company manages extensive transmission and distribution networks, emphasizing regulated utility operations, with a focus on serving residential, commercial, and industrial customers in the eastern U.S.
Key similarities and differences
Both Southern Company and FirstEnergy operate in the regulated electric utility sector with diversified energy generation portfolios including nuclear, hydroelectric, and renewables. Southern Company serves a larger customer base and offers natural gas services and digital communications, while FirstEnergy focuses more on electricity transmission and distribution with a smaller geographic footprint. Both companies maintain significant transmission infrastructure but differ in size and service diversification.
Income Statement Comparison
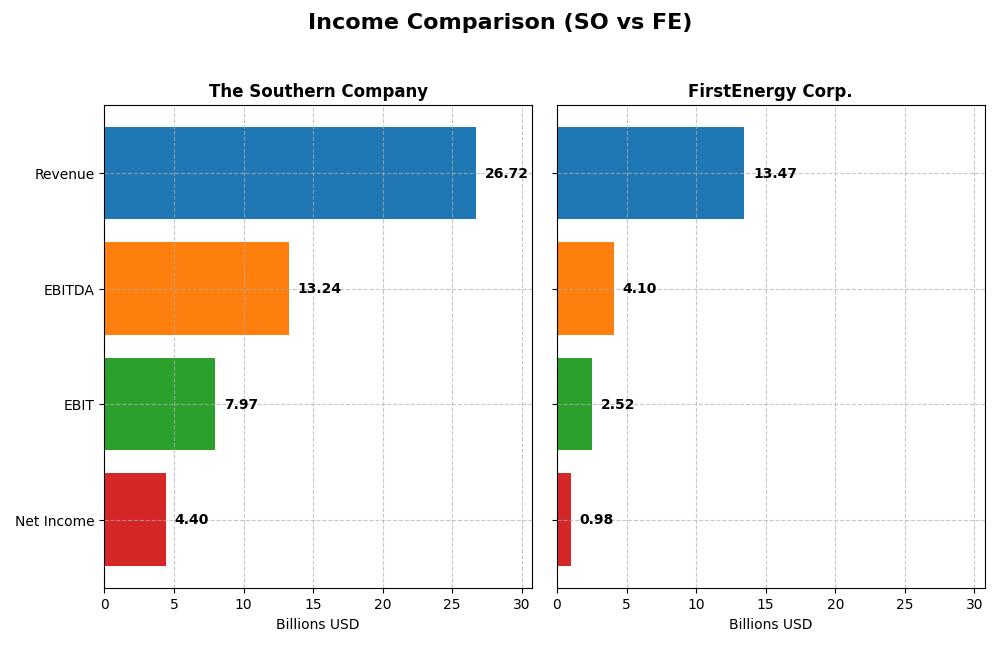
The table below presents a side-by-side comparison of key income statement metrics for The Southern Company and FirstEnergy Corp. for the fiscal year 2024.
| Metric | The Southern Company | FirstEnergy Corp. |
|---|---|---|
| Market Cap | 95.7B | 25.8B |
| Revenue | 26.7B | 13.5B |
| EBITDA | 13.2B | 4.1B |
| EBIT | 7.97B | 2.52B |
| Net Income | 4.40B | 978M |
| EPS | 4.02 | 1.70 |
| Fiscal Year | 2024 | 2024 |
Income Statement Interpretations
The Southern Company
The Southern Company showed a steady revenue increase from $20.4B in 2020 to $26.7B in 2024, with net income rising from $3.1B to $4.4B, reflecting a 40.4% growth over five years. Margins improved notably, gross margin reaching 49.9% and net margin 16.5%. In 2024, revenue growth slowed slightly to 5.8%, but EBIT and EPS margins improved, indicating enhanced profitability.
FirstEnergy Corp.
FirstEnergy Corp. experienced revenue growth from $10.8B in 2020 to $13.5B in 2024, up 24.9%, but net income declined from $1.1B to $978M, reflecting a negative 9.4% trend. Gross margin remained strong at 67.5%, but net margin fell to 7.3%. In 2024, revenue grew by 4.7%, yet net margin and EPS contracted, signaling challenges in sustaining profitability.
Which one has the stronger fundamentals?
The Southern Company demonstrates stronger fundamentals with favorable growth in revenues, net income, and margins over the period, supported by a robust EBIT margin near 30%. FirstEnergy, despite solid gross margins, shows declining net income and margins, with several unfavorable growth indicators. Overall, Southern’s income statement reflects more consistent profitability and margin expansion.
Financial Ratios Comparison
The table below presents a side-by-side comparison of key financial ratios for The Southern Company (SO) and FirstEnergy Corp. (FE) for the fiscal year 2024.
| Ratios | The Southern Company (SO) | FirstEnergy Corp. (FE) |
|---|---|---|
| ROE | 13.25% | 7.85% |
| ROIC | 4.25% | 3.66% |
| P/E | 20.5 | 23.39 |
| P/B | 2.72 | 1.84 |
| Current Ratio | 0.67 | 0.56 |
| Quick Ratio | 0.46 | 0.45 |
| D/E (Debt-to-Equity) | 2.00 | 1.95 |
| Debt-to-Assets | 45.7% | 46.6% |
| Interest Coverage | 2.58 | 2.35 |
| Asset Turnover | 0.18 | 0.26 |
| Fixed Asset Turnover | 0.25 | 0.33 |
| Payout Ratio | 67.1% | 99.2% |
| Dividend Yield | 3.27% | 4.24% |
Interpretation of the Ratios
The Southern Company
The Southern Company shows a mixed ratio profile with favorable net margin (16.47%) and dividend yield (3.27%), but several unfavorable liquidity and efficiency ratios, including a low current ratio (0.67) and weak asset turnover. The company maintains a neutral return on equity (13.25%) and debt levels, though debt-to-equity is unfavorable at 2.0. Dividend returns appear stable with no immediate risks noted.
FirstEnergy Corp.
FirstEnergy presents predominantly unfavorable ratios such as a low return on equity (7.85%) and weak liquidity ratios (current ratio 0.56). While its net margin is neutral at 7.26%, asset turnover remains low. The dividend yield is favorable at 4.24%, but other efficiency and leverage ratios suggest potential concerns. The company’s payout seems supported but overall financial health shows caution.
Which one has the best ratios?
Both companies have slightly unfavorable overall ratio evaluations, with Southern Company showing marginally stronger profitability and dividend yield. However, both face liquidity and efficiency challenges. Southern Company’s higher net margin and return on equity give it a relative edge, but both firms exhibit notable risks in leverage and operational performance metrics.
Strategic Positioning
This section compares the strategic positioning of The Southern Company and FirstEnergy Corp., including market position, key segments, and exposure to technological disruption:
The Southern Company
- Large market cap of 95.7B with moderate competition in regulated electric utilities.
- Diverse segments: gas distribution, pipeline investments, wholesale gas, electric utilities, and renewable energy projects.
- Exposure includes renewable energy facilities and digital wireless/fiber optics services, indicating adaptation to new technologies.
FirstEnergy Corp.
- Smaller market cap of 25.8B, also in regulated electric utilities facing similar competitive pressures.
- Focused on regulated distribution and transmission with coal, nuclear, hydro, gas, wind, and solar generation.
- Exposure to traditional and renewable generation but less emphasis on digital or innovative services.
The Southern Company vs FirstEnergy Corp. Positioning
Southern Company shows a diversified portfolio across gas and electric utilities including renewables and digital services, while FirstEnergy concentrates on regulated transmission and distribution with mixed generation assets. Southern’s breadth offers multiple business drivers, FirstEnergy is more focused regionally.
Which has the best competitive advantage?
Based on MOAT evaluation, Southern Company has a slightly unfavorable moat with growing profitability, whereas FirstEnergy’s moat is very unfavorable with declining profitability, indicating Southern may maintain a more stable competitive advantage.
Stock Comparison
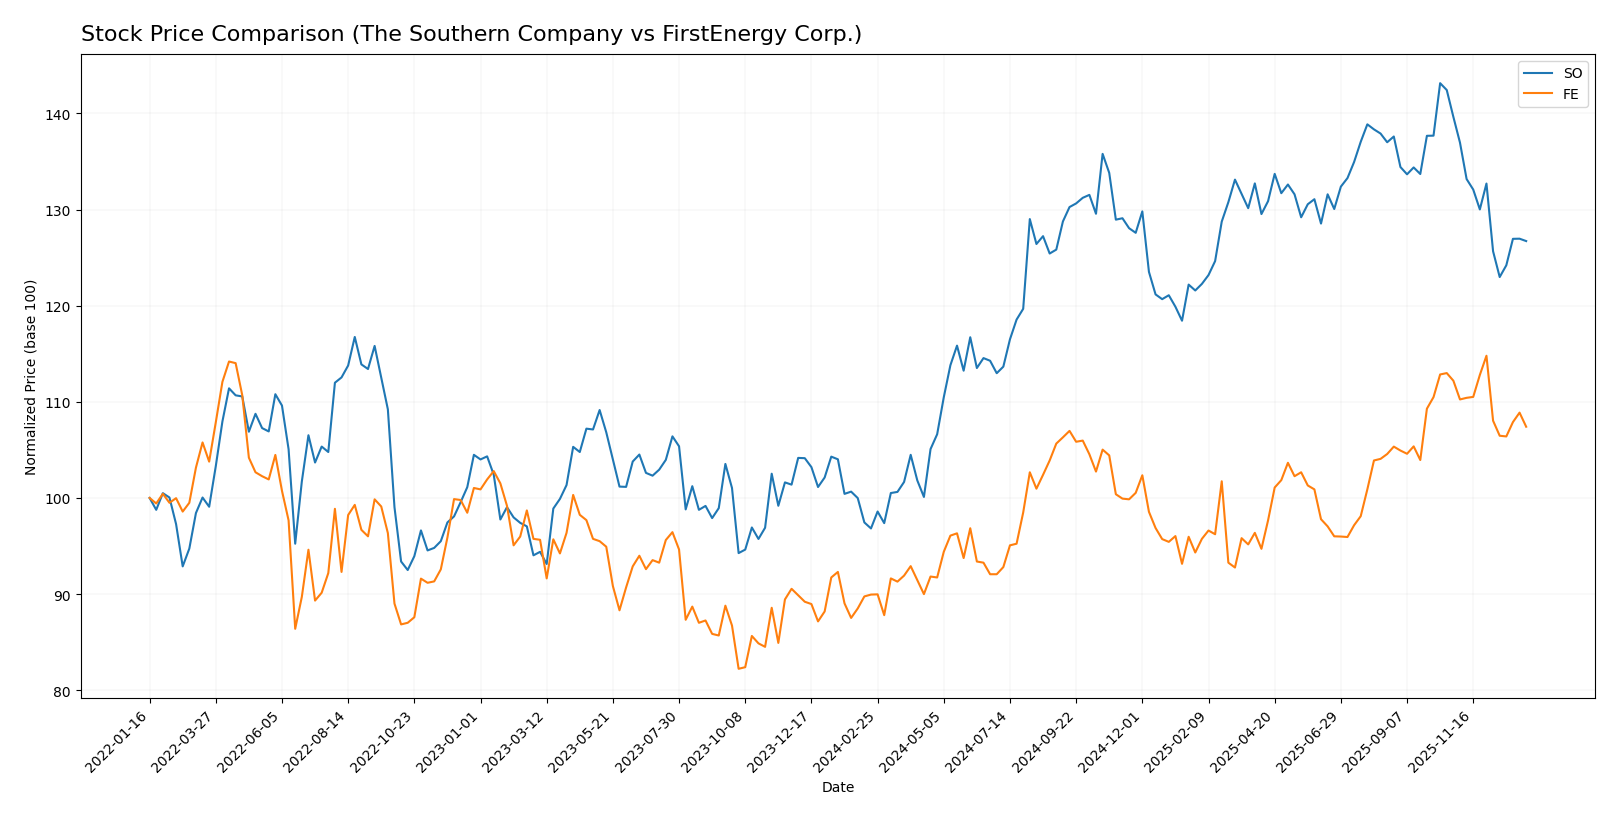
The stock price dynamics over the past 12 months reveal notable bullish trends for both The Southern Company and FirstEnergy Corp., with The Southern Company showing a stronger overall gain despite recent downward pressure.
Trend Analysis
The Southern Company’s stock exhibited a 30.88% increase over the past year, indicating a bullish trend with decelerating momentum. The price ranged between 66.48 and 98.29, and recent weeks showed a -9.25% decline.
FirstEnergy Corp.’s stock rose by 19.42% over the same period, also reflecting a bullish trend with deceleration. Its price fluctuated between 36.5 and 47.72, followed by a recent decrease of -4.27%.
Comparing the two, The Southern Company delivered the highest market performance over the past year, outperforming FirstEnergy Corp. by more than 11 percentage points.
Target Prices
Analysts provide clear target price consensus for The Southern Company and FirstEnergy Corp.
| Company | Target High | Target Low | Consensus |
|---|---|---|---|
| The Southern Company | 103 | 76 | 93.1 |
| FirstEnergy Corp. | 54 | 46 | 49.29 |
The Southern Company’s consensus target of 93.1 is above its current price of 87.01, indicating moderate upside potential. FirstEnergy’s consensus target at 49.29 also exceeds its current price of 44.65, suggesting cautious optimism from analysts.
Analyst Opinions Comparison
This section compares analysts’ ratings and grades for The Southern Company and FirstEnergy Corp.:
Rating Comparison
SO Rating
- Rating: B-, considered very favorable overall.
- Discounted Cash Flow Score: Moderate at 3.
- ROE Score: Favorable at 4, indicating efficient profit generation.
- ROA Score: Moderate at 3, showing average asset utilization.
- Debt To Equity Score: Very unfavorable at 1, reflecting high financial risk.
- Overall Score: Moderate at 3, reflecting balanced financial standing.
FE Rating
- Rating: B, considered very favorable overall.
- Discounted Cash Flow Score: Favorable at 4.
- ROE Score: Favorable at 4, indicating efficient profit generation.
- ROA Score: Moderate at 3, showing average asset utilization.
- Debt To Equity Score: Very unfavorable at 1, reflecting high financial risk.
- Overall Score: Moderate at 3, reflecting balanced financial standing.
Which one is the best rated?
Based strictly on the provided data, FirstEnergy Corp. holds a slightly better rating with a B compared to The Southern Company’s B-. FE also scores higher in discounted cash flow, while both have equal scores in ROE, ROA, debt-to-equity, and overall score.
Scores Comparison
Here is a comparison of the financial risk and strength scores for The Southern Company and FirstEnergy Corp.:
SO Scores
- Altman Z-Score: 0.98, indicating financial distress and high bankruptcy risk.
- Piotroski Score: 6, reflecting average financial strength.
FE Scores
- Altman Z-Score: 0.78, indicating financial distress and high bankruptcy risk.
- Piotroski Score: 6, reflecting average financial strength.
Which company has the best scores?
Both The Southern Company and FirstEnergy Corp. are in the Altman Z-Score distress zone, showing high bankruptcy risk, and share an average Piotroski Score of 6. Neither company demonstrates stronger financial scores based on the provided data.
Grades Comparison
Here is a detailed comparison of the latest grades assigned to The Southern Company and FirstEnergy Corp.:
The Southern Company Grades
The following table summarizes recent grades from established financial institutions for The Southern Company:
| Grading Company | Action | New Grade | Date |
|---|---|---|---|
| UBS | Maintain | Neutral | 2025-12-17 |
| JP Morgan | Maintain | Neutral | 2025-12-15 |
| Jefferies | Maintain | Neutral | 2025-12-15 |
| RBC Capital | Maintain | Sector Perform | 2025-12-12 |
| Keybanc | Maintain | Underweight | 2025-12-12 |
| Mizuho | Maintain | Neutral | 2025-12-11 |
| Barclays | Maintain | Equal Weight | 2025-11-20 |
| Jefferies | Downgrade | Neutral | 2025-11-05 |
| Ladenburg Thalmann | Downgrade | Neutral | 2025-10-17 |
| Keybanc | Maintain | Underweight | 2025-10-15 |
The Southern Company’s grades mostly show a neutral or hold stance, with several maintain actions and a few downgrades from buy to neutral.
FirstEnergy Corp. Grades
Below is a summary of recent grades from recognized grading firms for FirstEnergy Corp.:
| Grading Company | Action | New Grade | Date |
|---|---|---|---|
| UBS | Maintain | Neutral | 2025-12-17 |
| Scotiabank | Maintain | Sector Outperform | 2025-10-24 |
| UBS | Maintain | Neutral | 2025-10-24 |
| Mizuho | Maintain | Neutral | 2025-10-24 |
| Morgan Stanley | Maintain | Overweight | 2025-10-21 |
| Jefferies | Maintain | Hold | 2025-10-21 |
| Keybanc | Downgrade | Sector Weight | 2025-10-15 |
| Scotiabank | Maintain | Sector Outperform | 2025-10-06 |
| Morgan Stanley | Maintain | Overweight | 2025-09-25 |
| Barclays | Upgrade | Overweight | 2025-08-25 |
FirstEnergy Corp. shows a generally positive trend with several overweight and sector outperform ratings, alongside few downgrades.
Which company has the best grades?
FirstEnergy Corp. has received comparatively stronger grades, including multiple overweight and sector outperform ratings, while The Southern Company maintains mostly neutral and underweight grades. This difference may influence investors’ perception of relative growth potential and risk.
Strengths and Weaknesses
Below is a comparison of key strengths and weaknesses for The Southern Company (SO) and FirstEnergy Corp. (FE) based on their recent financial and operational data.
| Criterion | The Southern Company (SO) | FirstEnergy Corp. (FE) |
|---|---|---|
| Diversification | Moderate: Revenue mainly from gas distribution and electric utilities; some exposure to gas marketing and pipeline investments | Moderate: Focused on regulated distribution and transmission with limited diversification |
| Profitability | Higher net margin (16.5%), but ROIC below WACC, indicating value destruction with improving trends | Lower net margin (7.3%) and ROIC below WACC with declining trend, indicating deteriorating profitability |
| Innovation | Growing ROIC trend suggests improving efficiency; limited evidence of strong innovation initiatives | Declining ROIC and profitability indicate challenges in operational innovation and efficiency |
| Global presence | Primarily US-focused with no significant international operations | Primarily US-focused, no notable global presence |
| Market Share | Strong position in gas and electric utilities in the US Southeast | Strong regional presence in regulated transmission and distribution markets |
In summary, Southern Company demonstrates improving profitability trends despite current value destruction, supported by a diversified gas and electric portfolio. FirstEnergy faces significant profitability challenges, with declining returns and weaker operational efficiency. Investors should weigh Southern’s growth potential against FirstEnergy’s riskier profile.
Risk Analysis
The table below summarizes key risks for The Southern Company (SO) and FirstEnergy Corp. (FE) based on the latest available data for 2024.
| Metric | The Southern Company (SO) | FirstEnergy Corp. (FE) |
|---|---|---|
| Market Risk | Low beta (0.447), stable utility sector exposure | Moderate beta (0.626), some sensitivity to market fluctuations |
| Debt level | High debt-to-equity (2.0), moderate debt-to-assets (45.65%) | High debt-to-equity (1.95), moderate debt-to-assets (46.63%) |
| Regulatory Risk | High, due to regulated electric industry | High, regulated electric industry with regional regulatory challenges |
| Operational Risk | Moderate, diversified generation assets but low asset turnover | Moderate, diverse generation but operational inefficiencies persist |
| Environmental Risk | Moderate, exposure to fossil fuel and nuclear plants, renewable investments ongoing | Moderate to high, coal and nuclear reliance with transition risks |
| Geopolitical Risk | Low, primarily U.S. operations | Low, primarily U.S. operations |
Both companies face significant leverage risks with high debt-to-equity ratios and unfavorable liquidity ratios. Regulatory risk is prominent given their regulated utility status. Environmental risk is material due to fossil fuel exposure amid energy transition pressures. Their Altman Z-Scores indicate financial distress risk, warranting caution despite stable market risk profiles.
Which Stock to Choose?
The Southern Company (SO) shows favorable income growth with a 31.16% revenue increase over 2020-2024 and solid profitability metrics, including a 16.47% net margin. Financial ratios are mixed, with several unfavorable liquidity and efficiency ratios and moderate leverage; its rating is very favorable (B-). Despite a negative ROIC-WACC spread indicating value destruction, the company’s growing ROIC suggests improving profitability.
FirstEnergy Corp. (FE) displays an unfavorable income statement trend, with a 9.36% net income decline over five years and a net margin of 7.26%. Its financial ratios reveal mostly unfavorable metrics, including low liquidity and high debt, though it holds a very favorable rating (B). The company has a very unfavorable MOAT status due to declining ROIC below WACC, signaling deteriorating profitability.
Investors focused on growth might find The Southern Company more appealing, considering its favorable income trends and improving profitability despite some financial weaknesses. Conversely, those prioritizing stability might view FirstEnergy’s consistent but lower profitability and rating differently, though its declining ROIC could signal caution. Ultimately, the choice could depend on an investor’s tolerance for risk and preference for growth versus value characteristics.
Disclaimer: Investment carries a risk of loss of initial capital. The past performance is not a reliable indicator of future results. Be sure to understand risks before making an investment decision.
Go Further
I encourage you to read the complete analyses of The Southern Company and FirstEnergy Corp. to enhance your investment decisions: