Investing in the regulated electric utilities sector requires careful consideration of companies with strong market positions and forward-thinking strategies. Public Service Enterprise Group Incorporated (PEG) and FirstEnergy Corp. (FE) both operate extensive electricity transmission and distribution networks across the U.S., serving millions of customers. Their shared focus on innovation, including renewable energy integration, makes them compelling peers to compare. In this article, I will help you determine which company holds the most investment potential for your portfolio.
Table of contents
Companies Overview
I will begin the comparison between Public Service Enterprise Group Incorporated and FirstEnergy Corp. by providing an overview of these two companies and their main differences.
Public Service Enterprise Group Incorporated Overview
Public Service Enterprise Group Incorporated (PEG) operates mainly in the Northeastern and Mid-Atlantic United States. The company focuses on electricity transmission, distribution of electricity and gas, and invests in solar generation projects and energy efficiency programs. PEG manages a substantial infrastructure including 25,000 circuit miles of electric transmission and distribution, serving residential, commercial, and industrial customers.
FirstEnergy Corp. Overview
FirstEnergy Corp. (FE) generates, transmits, and distributes electricity across multiple states including Ohio, Pennsylvania, and New Jersey. It owns diverse power generating facilities such as coal, nuclear, hydroelectric, natural gas, wind, and solar. FE operates extensive transmission and distribution systems covering over 24,000 circuit miles and serves roughly 6 million customers primarily in the Midwest and Mid-Atlantic regions.
Key similarities and differences
Both PEG and FE operate in the regulated electric utilities sector with a focus on electricity transmission and distribution. They serve residential and commercial customers across multiple states and invest in renewable energy sources. However, PEG emphasizes solar generation projects and has a larger electric transmission system, while FE operates a more diverse generation portfolio including nuclear and coal facilities, and serves a larger customer base across a broader geographic area.
Income Statement Comparison
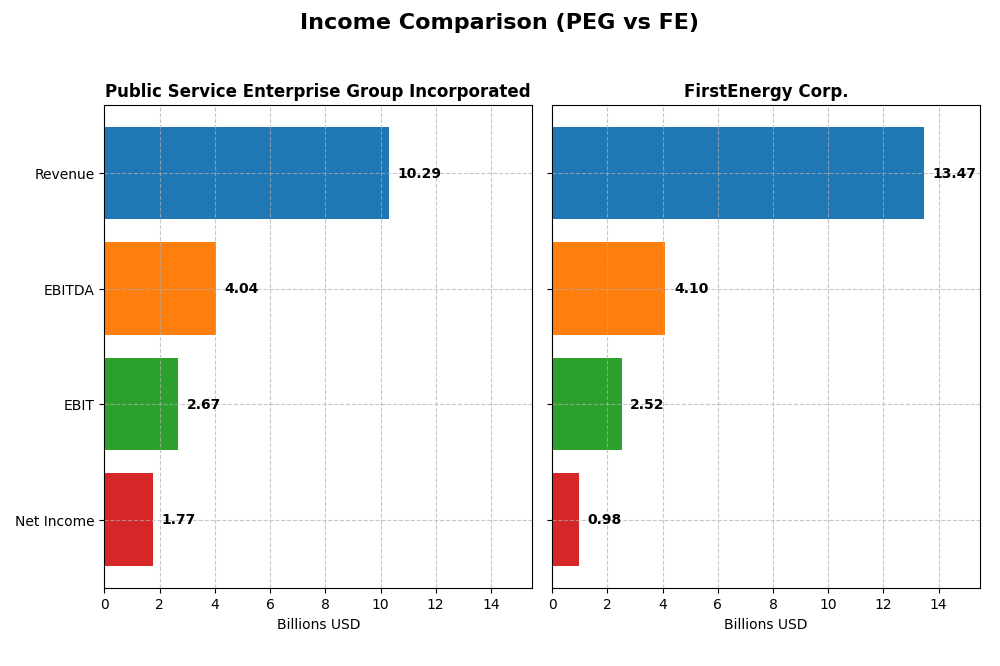
The table below summarizes key income statement metrics for Public Service Enterprise Group Incorporated and FirstEnergy Corp. for the fiscal year 2024, providing a clear snapshot of their financial performance.
| Metric | Public Service Enterprise Group Incorporated (PEG) | FirstEnergy Corp. (FE) |
|---|---|---|
| Market Cap | 39.3B | 25.8B |
| Revenue | 10.3B | 13.5B |
| EBITDA | 4.04B | 4.10B |
| EBIT | 2.67B | 2.52B |
| Net Income | 1.77B | 978M |
| EPS | 3.56 | 1.70 |
| Fiscal Year | 2024 | 2024 |
Income Statement Interpretations
Public Service Enterprise Group Incorporated
From 2020 to 2024, PEG’s revenue showed moderate growth of 7.15%, but net income declined by about 7%. Margins were generally favorable, with a gross margin near 34% and an EBIT margin of 26%. However, in 2024, revenue and profit fell sharply, with net income down 31%, reflecting weakened profitability and margin contraction.
FirstEnergy Corp.
FE experienced stronger revenue growth of nearly 25% over five years but saw net income decline by 9%. Its gross margin was robust at 67.5%, though the net margin was lower at 7.3%. The latest fiscal year showed a 4.7% revenue increase and a 10.6% gross profit rise, but net margin and EPS declined, signaling profit pressures despite top-line growth.
Which one has the stronger fundamentals?
PEG exhibits higher profitability margins but faces declining revenue and net income, with unfavorable one-year growth trends. FE has superior revenue growth and gross margin but lower net margins and also experiences net income declines. Both companies’ income statements show unfavorable overall growth, with PEG’s margins stronger but FE demonstrating steadier revenue expansion.
Financial Ratios Comparison
The table below compares key financial ratios for Public Service Enterprise Group Incorporated (PEG) and FirstEnergy Corp. (FE) based on their most recent fiscal year data (2024).
| Ratios | Public Service Enterprise Group Incorporated (PEG) | FirstEnergy Corp. (FE) |
|---|---|---|
| ROE | 11.0% | 7.9% |
| ROIC | 4.4% | 3.7% |
| P/E | 23.7 | 23.4 |
| P/B | 2.61 | 1.84 |
| Current Ratio | 0.65 | 0.56 |
| Quick Ratio | 0.48 | 0.45 |
| D/E (Debt-to-Equity) | 1.42 | 1.95 |
| Debt-to-Assets | 41.9% | 46.6% |
| Interest Coverage | 2.80 | 2.35 |
| Asset Turnover | 0.19 | 0.26 |
| Fixed Asset Turnover | 0.26 | 0.33 |
| Payout Ratio | 67.5% | 99.2% |
| Dividend Yield | 2.84% | 4.24% |
Interpretation of the Ratios
Public Service Enterprise Group Incorporated
Public Service Enterprise Group shows mixed ratio performance with a favorable net margin of 17.22% but an unfavorable return on invested capital of 4.4%. Its current and quick ratios are weak at 0.65 and 0.48, indicating liquidity concerns. The dividend yield is favorable at 2.84%, supported by steady payouts, though some leverage metrics suggest caution.
FirstEnergy Corp.
FirstEnergy has a neutral net margin of 7.26% and an unfavorable return on equity of 7.85%, with liquidity ratios below 0.6, reflecting potential short-term financial stress. The dividend yield is more attractive at 4.24%, but its debt-to-equity ratio of 1.95 raises leverage concerns. Overall, most ratios lean toward unfavorable or neutral assessments.
Which one has the best ratios?
Both companies carry a slightly unfavorable global ratio profile, but Public Service Enterprise Group presents a higher percentage of favorable ratios at 21.43% compared to FirstEnergy’s 14.29%. Despite liquidity and leverage weaknesses for both, PEG’s stronger profitability and moderate dividend yield offer relatively better ratio metrics than FE.
Strategic Positioning
This section compares the strategic positioning of PEG and FE, focusing on Market position, Key segments, and exposure to disruption:
PEG
- Strong regional presence in Northeastern and Mid-Atlantic US, regulated electric industry with moderate competitive pressure.
- Revenue driven by Public Service Electric and Gas, gas distribution, transmission, and natural gas segments.
- Moderate exposure to technological disruption, investing in solar projects and energy efficiency programs.
FE
- Operates in several US states with regulated electric industry focus, facing industry competition and regulatory challenges.
- Revenue mainly from regulated distribution and transmission, with diversified generation sources including renewables.
- Exposure to disruption through ownership of coal, nuclear, hydroelectric, natural gas, wind, and solar power facilities.
PEG vs FE Positioning
PEG’s strategy centers on diversified regulated services and renewable investments in a concentrated regional market, offering stable revenues but moderate disruption risk. FE shows a broader generation mix with emphasis on regulated distribution, but faces challenges from declining profitability.
Which has the best competitive advantage?
Both companies are shedding value with ROIC below WACC, but PEG’s growing ROIC indicates improving profitability, whereas FE’s declining ROIC signals worsening value destruction and weaker competitive advantage.
Stock Comparison
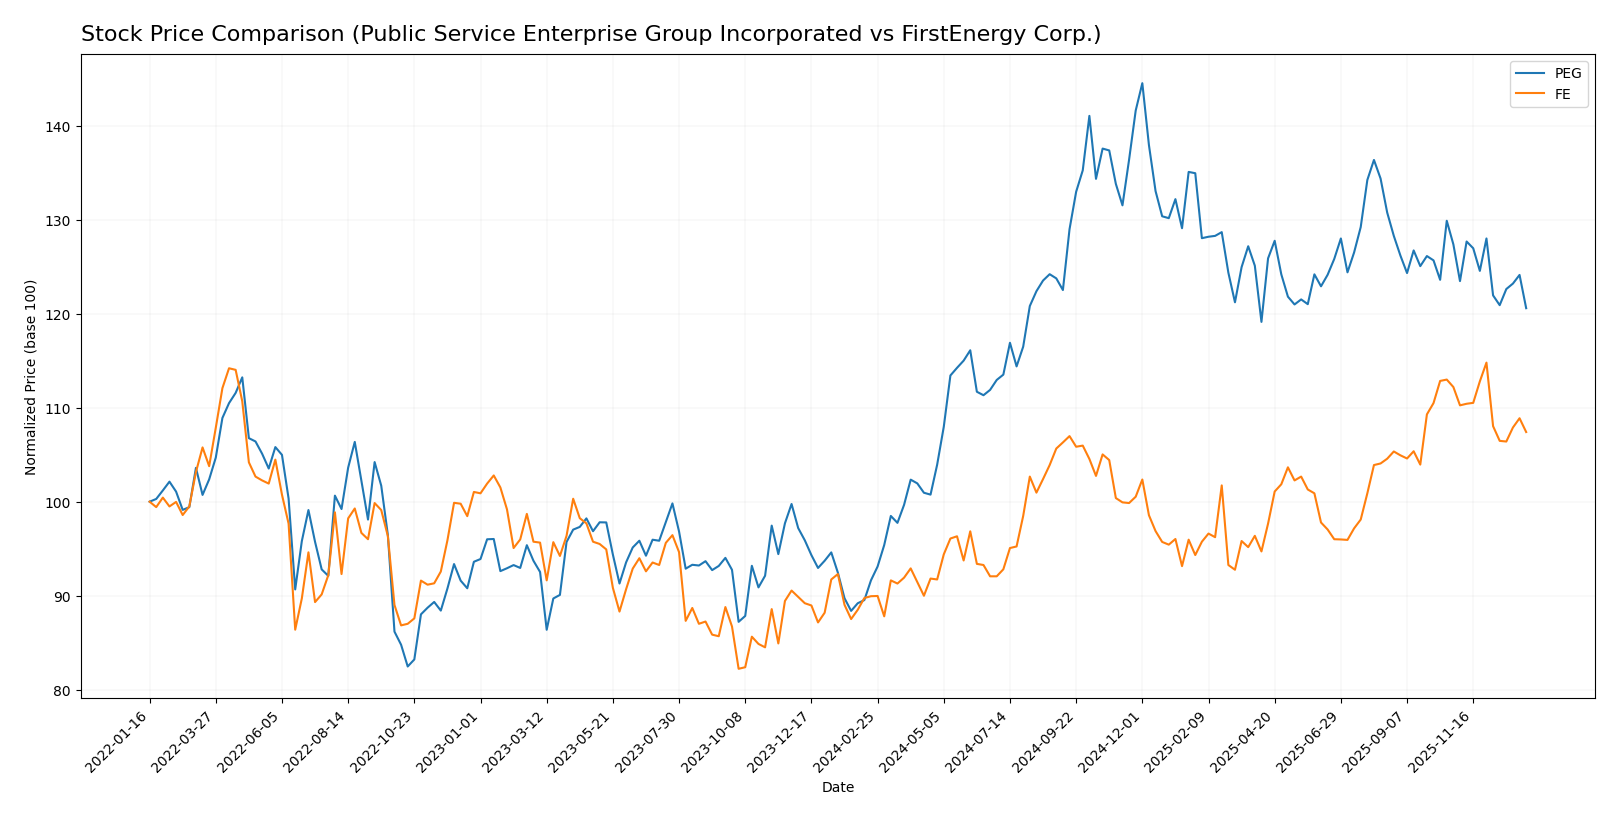
The stock price movements of Public Service Enterprise Group Incorporated (PEG) and FirstEnergy Corp. (FE) over the past 12 months reveal distinct bullish trends with varying acceleration patterns and recent downward corrections.
Trend Analysis
Public Service Enterprise Group Incorporated (PEG) experienced a bullish trend over the past year with a 31.59% price increase, marked by decelerating momentum and a high volatility level (std deviation 7.17). A recent 5.33% decline indicates short-term weakening.
FirstEnergy Corp. (FE) showed a 19.42% bullish trend over the same period with decelerating gains and lower volatility (std deviation 2.64). It also faced a recent 4.27% pullback, reflecting mild downward pressure.
Comparing the two, PEG delivered the highest market performance with a 31.59% gain versus FE’s 19.42%, although both stocks have recently experienced short-term corrections.
Target Prices
The consensus target prices from recognized analysts suggest moderate upside potential for these utilities.
| Company | Target High | Target Low | Consensus |
|---|---|---|---|
| Public Service Enterprise Group Incorporated | 98 | 83 | 89 |
| FirstEnergy Corp. | 54 | 46 | 49.29 |
Analysts expect Public Service Enterprise Group’s stock to rise from $78.68 to around $89, indicating potential growth. FirstEnergy’s consensus target of $49.29 also implies moderate appreciation from the current $44.65 price.
Analyst Opinions Comparison
This section compares analysts’ ratings and grades for Public Service Enterprise Group Incorporated (PEG) and FirstEnergy Corp. (FE):
Rating Comparison
PEG Rating
- Rating: B-, classified as Very Favorable by analysts.
- Discounted Cash Flow Score: 1, considered Very Unfavorable indicating possible overvaluation.
- ROE Score: 4, Favorable, showing efficient profit generation from equity.
- ROA Score: 4, Favorable, reflecting effective asset utilization.
- Debt To Equity Score: 2, Moderate, implying manageable financial risk.
- Overall Score: 3, Moderate, representing an average financial standing.
FE Rating
- Rating: B, also classified as Very Favorable.
- Discounted Cash Flow Score: 4, Favorable, suggesting undervaluation based on cash flow.
- ROE Score: 4, Favorable, indicating strong equity profit efficiency.
- ROA Score: 3, Moderate, showing average asset utilization efficiency.
- Debt To Equity Score: 1, Very Unfavorable, indicating higher financial risk due to debt.
- Overall Score: 3, Moderate, also indicating average overall financial health.
Which one is the best rated?
Based strictly on the data, FE holds a better rating (B vs B-) and a stronger discounted cash flow score. However, PEG shows a better debt-to-equity score and higher ROA. Both have the same overall moderate score, reflecting balanced strengths and weaknesses.
Scores Comparison
Here is a comparison of the Altman Z-Score and Piotroski Score for both companies:
PEG Scores
- Altman Z-Score: 1.32, indicating financial distress zone
- Piotroski Score: 7, classified as strong financial health
FE Scores
- Altman Z-Score: 0.78, indicating financial distress zone
- Piotroski Score: 6, classified as average financial health
Which company has the best scores?
Based on the provided data, PEG has a higher Piotroski Score (7 vs. 6) suggesting stronger financial health, while both are in the distress zone for Altman Z-Score. PEG’s scores indicate comparatively better financial strength.
Grades Comparison
Here is the comparison of the latest reliable grades for Public Service Enterprise Group Incorporated and FirstEnergy Corp.:
Public Service Enterprise Group Incorporated Grades
This table summarizes recent grades assigned by reputable financial institutions:
| Grading Company | Action | New Grade | Date |
|---|---|---|---|
| Ladenburg Thalmann | Buy | Buy | 2026-01-07 |
| UBS | Maintain | Buy | 2025-12-17 |
| JP Morgan | Maintain | Overweight | 2025-12-12 |
| Jefferies | Upgrade | Buy | 2025-11-06 |
| TD Cowen | Maintain | Buy | 2025-11-05 |
| BMO Capital | Maintain | Market Perform | 2025-11-04 |
| Barclays | Maintain | Equal Weight | 2025-10-21 |
| BMO Capital | Maintain | Market Perform | 2025-10-20 |
| Morgan Stanley | Maintain | Overweight | 2025-09-25 |
| BMO Capital | Maintain | Market Perform | 2025-08-06 |
The overall trend for Public Service Enterprise Group Incorporated is positive, with recent upgrades to Buy and consistent buy or overweight ratings from major firms.
FirstEnergy Corp. Grades
Recent grades from recognized financial institutions are detailed below:
| Grading Company | Action | New Grade | Date |
|---|---|---|---|
| UBS | Maintain | Neutral | 2025-12-17 |
| Mizuho | Maintain | Neutral | 2025-10-24 |
| Scotiabank | Maintain | Sector Outperform | 2025-10-24 |
| UBS | Maintain | Neutral | 2025-10-24 |
| Morgan Stanley | Maintain | Overweight | 2025-10-21 |
| Jefferies | Maintain | Hold | 2025-10-21 |
| Keybanc | Downgrade | Sector Weight | 2025-10-15 |
| Scotiabank | Maintain | Sector Outperform | 2025-10-06 |
| Morgan Stanley | Maintain | Overweight | 2025-09-25 |
| Barclays | Upgrade | Overweight | 2025-08-25 |
FirstEnergy Corp.’s grades show a mix of neutral and overweight ratings with some downgrades, indicating a more cautious outlook compared to its peer.
Which company has the best grades?
Public Service Enterprise Group Incorporated holds a stronger consensus with a “Buy” consensus supported by 19 buy ratings, while FirstEnergy Corp. has a “Hold” consensus with more hold ratings. Investors may interpret this as PEG having a more favorable outlook from analysts, potentially affecting portfolio decisions.
Strengths and Weaknesses
Below is a comparison of key strengths and weaknesses for Public Service Enterprise Group Incorporated (PEG) and FirstEnergy Corp. (FE) based on recent financial and operational data.
| Criterion | Public Service Enterprise Group (PEG) | FirstEnergy Corp. (FE) |
|---|---|---|
| Diversification | Moderate: Revenue split among electric utility and gas segments, with significant contract revenues | Limited: Primarily focused on regulated distribution and transmission |
| Profitability | Moderate profitability with 17.22% net margin; ROIC 4.4% slightly below WACC | Lower profitability; net margin 7.26%, ROIC 3.66% below WACC and declining |
| Innovation | Steady ROIC growth indicates improving efficiency and potential operational improvements | Declining ROIC suggests challenges in innovation and value creation |
| Global presence | Primarily US-focused utilities, limited global exposure | US-focused, no significant global operations |
| Market Share | Strong regional presence with diversified contract types, including natural gas and transmission | Predominantly regulated distribution and transmission, with declining transmission revenues |
Key takeaways: PEG shows growing profitability and operational improvements despite slightly unfavorable value creation, supported by diversified revenue streams. FE faces more severe challenges, with declining profitability and value destruction, focused mainly on regulated US utilities with less diversification. Investors should weigh PEG’s improving trend against FE’s ongoing risks.
Risk Analysis
Below is a comparison table of key risks for Public Service Enterprise Group Incorporated (PEG) and FirstEnergy Corp. (FE) based on the most recent 2024 data:
| Metric | Public Service Enterprise Group (PEG) | FirstEnergy Corp. (FE) |
|---|---|---|
| Market Risk | Beta 0.61 (moderate volatility) | Beta 0.63 (moderate volatility) |
| Debt level | Debt/Equity 1.42 (unfavorable) | Debt/Equity 1.95 (unfavorable) |
| Regulatory Risk | High, due to regulated electric sector | High, similar regulatory exposure |
| Operational Risk | Moderate, aging infrastructure | Moderate, diverse generation mix |
| Environmental Risk | Transition to solar projects underway | Mix of coal, nuclear, renewables |
| Geopolitical Risk | Low, primarily US operations | Low, primarily US operations |
Synthesis: Both companies face significant regulatory and debt-related risks, with FirstEnergy’s higher leverage and reliance on coal increasing environmental and financial risk. PEG’s moderate beta suggests less market volatility, but both show financial distress signs via Altman Z-Scores. Careful risk management and monitoring of regulatory changes are essential for investors.
Which Stock to Choose?
Public Service Enterprise Group Incorporated (PEG) shows a mixed financial profile with a slightly unfavorable global ratios evaluation due to some weak asset turnover and liquidity ratios. Its income statement is largely unfavorable with declining margins and earnings, though it maintains a very favorable B- rating overall. The company’s ROIC remains below WACC, indicating value destruction despite a growing profitability trend.
FirstEnergy Corp. (FE) also faces challenges, reflected in slightly unfavorable ratios and an unfavorable income statement with declining profitability over time. Its rating of B is very favorable, supported by a favorable discounted cash flow score but weakened by a very unfavorable debt-to-equity score. FE’s ROIC is below WACC and trending downwards, signaling deteriorating value creation.
Investors focused on improving profitability and moderate rating strength may find PEG’s growing ROIC and strong equity returns more appealing, while those prioritizing discounted cash flow valuation and dividend yield could see FE’s profile as more fitting. Risk-averse investors might note both companies’ value destruction signals and weigh the broader financial context carefully.
Disclaimer: Investment carries a risk of loss of initial capital. The past performance is not a reliable indicator of future results. Be sure to understand risks before making an investment decision.
Go Further
I encourage you to read the complete analyses of Public Service Enterprise Group Incorporated and FirstEnergy Corp. to enhance your investment decisions: