FirstEnergy Corp. and PPL Corporation are two prominent players in the regulated electric utility sector, each serving millions of customers across multiple U.S. states with diverse energy generation portfolios. Both companies focus on innovation through integrating renewable sources alongside traditional power generation, positioning themselves amidst evolving energy markets. This comparison aims to uncover which company offers the most compelling investment opportunity for those seeking stability and growth in the utilities space. Let’s dive in to identify the better choice for your portfolio.

Table of contents
Companies Overview
I will begin the comparison between FirstEnergy Corp. and PPL Corporation by providing an overview of these two companies and their main differences.
FirstEnergy Corp. Overview
FirstEnergy Corp. operates in the regulated electric industry, generating, transmitting, and distributing electricity across several U.S. states. With a diversified energy portfolio including coal, nuclear, hydroelectric, natural gas, wind, and solar, it serves about 6M customers. The company manages extensive transmission and distribution lines and is headquartered in Akron, Ohio, with a market capitalization of approximately 25.8B USD.
PPL Corporation Overview
PPL Corporation is a utility holding company delivering electricity and natural gas in the U.S. and U.K., focusing on regulated segments in Kentucky, Pennsylvania, and Virginia. It serves over 2.7M customers and generates electricity from coal, gas, hydro, and solar sources. Founded in 1920, PPL is headquartered in Allentown, Pennsylvania, with a market cap close to 25.6B USD, operating primarily in the regulated electric sector.
Key similarities and differences
Both companies operate in the regulated electric industry with significant customer bases and diversified energy generation portfolios including fossil fuels and renewables. FirstEnergy has a broader geographic footprint and larger customer base, while PPL also provides natural gas services and operates internationally in the U.K. Market caps and utility focus are similar, but their operational scopes and segment focuses differ, reflecting varied regional strategies and service offerings.
Income Statement Comparison
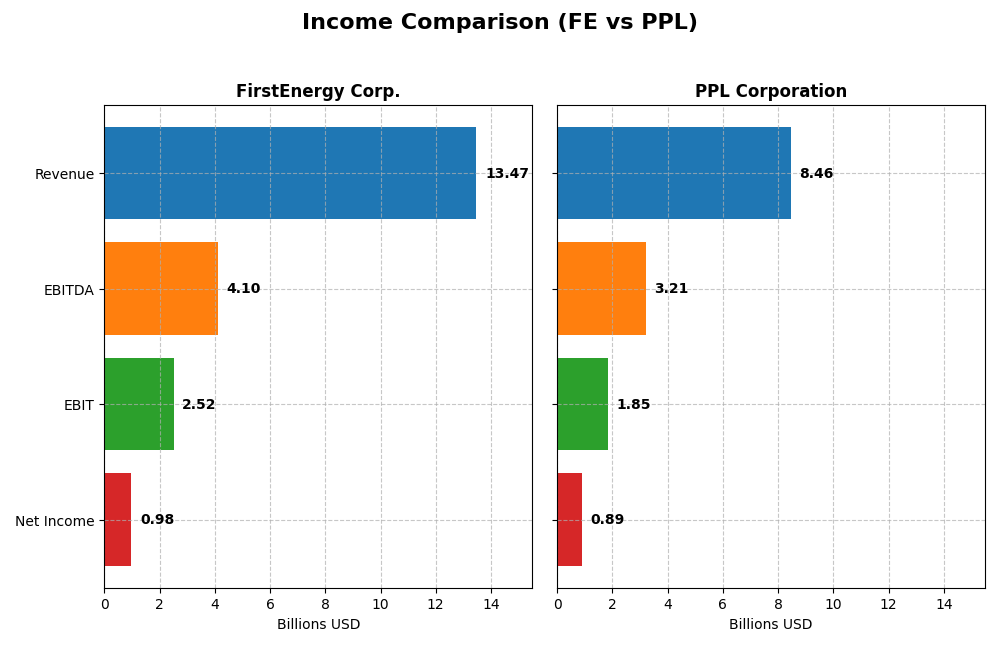
The table below presents a side-by-side comparison of key income statement metrics for FirstEnergy Corp. and PPL Corporation for the fiscal year 2024.
| Metric | FirstEnergy Corp. (FE) | PPL Corporation (PPL) |
|---|---|---|
| Market Cap | 25.8B | 25.6B |
| Revenue | 13.5B | 8.5B |
| EBITDA | 4.1B | 3.2B |
| EBIT | 2.5B | 1.9B |
| Net Income | 978M | 886M |
| EPS | 1.7 | 1.2 |
| Fiscal Year | 2024 | 2024 |
Income Statement Interpretations
FirstEnergy Corp.
FirstEnergy Corp. showed a revenue increase of nearly 25% over 2020-2024, with gross margin stable at 67.5%, reflecting strong cost control. However, net income declined by 9.4% overall, and net margin fell by 27.4%, indicating rising expenses. In 2024, revenue growth slowed to 4.7%, with a slight EBIT increase but a net margin decrease, signaling margin pressure.
PPL Corporation
PPL Corporation’s revenue grew 54.6% from 2020 to 2024, accompanied by a favorable gross margin around 40.1%. EBIT margin was healthy at 21.9%, and net margin improved to 10.5%. Despite a 39.6% net income drop over the five years, 2024 saw positive EBIT and net margin growth, with EPS up 20%, indicating operational improvements despite some challenges.
Which one has the stronger fundamentals?
PPL demonstrates stronger fundamentals with a higher percentage of favorable income statement metrics, including better EBIT and net margin growth in the latest year. FirstEnergy has robust gross margins but suffers from declining net income and margins over the period. PPL’s operational gains and margin improvements suggest comparatively better income statement resilience.
Financial Ratios Comparison
The table below presents a side-by-side comparison of key financial ratios for FirstEnergy Corp. (FE) and PPL Corporation (PPL) based on their most recent fiscal year, 2024.
| Ratios | FirstEnergy Corp. (FE) | PPL Corporation (PPL) |
|---|---|---|
| ROE | 7.85% | 6.31% |
| ROIC | 3.66% | 3.59% |
| P/E | 23.39 | 26.97 |
| P/B | 1.84 | 1.70 |
| Current Ratio | 0.56 | 0.86 |
| Quick Ratio | 0.45 | 0.71 |
| D/E (Debt to Equity) | 1.95 | 1.19 |
| Debt-to-Assets | 46.63% | 40.92% |
| Interest Coverage | 2.35 | 2.36 |
| Asset Turnover | 0.26 | 0.21 |
| Fixed Asset Turnover | 0.33 | 0.26 |
| Payout ratio | 99.18% | 84.12% |
| Dividend yield | 4.24% | 3.12% |
Interpretation of the Ratios
FirstEnergy Corp.
FirstEnergy shows a mixed ratio profile with several unfavorable metrics, including low returns on equity (7.85%) and invested capital (3.66%), alongside weak liquidity ratios such as a current ratio of 0.56. The company’s dividend yield is favorable at 4.24%, supported by consistent dividend payments, though coverage by free cash flow appears strained, raising sustainability concerns.
PPL Corporation
PPL presents a slightly better net margin (10.49%) but also suffers from weak returns on equity (6.31%) and invested capital (3.59%), with liquidity ratios below ideal levels, such as a current ratio of 0.86. Its dividend yield stands at a moderate 3.12%, with dividends paid regularly, though free cash flow coverage and capital structure remain areas to monitor carefully.
Which one has the best ratios?
Comparing both, FirstEnergy has a slightly unfavorable overall ratio profile, while PPL’s ratios are considered unfavorable, with a higher proportion of negative indicators. Despite FirstEnergy’s challenges, it has a marginally better global evaluation and higher dividend yield, suggesting it holds a modest edge in ratio strength over PPL.
Strategic Positioning
This section compares the strategic positioning of FirstEnergy Corp. and PPL Corporation, including Market position, Key segments, and exposure to disruption:
FirstEnergy Corp.
- Large market cap ~26B USD, operates in several US states; faces regulated electric industry pressure.
- Key segments include Regulated Distribution (~6.8B) and Transmission (~1.8B) with diverse generation sources.
- Owns coal, nuclear, hydro, natural gas, wind, and solar assets; traditional utility model with limited disruption data.
PPL Corporation
- Similar market cap ~25.6B USD; serves US and UK markets with regulated electric focus.
- Key segments are Kentucky, Pennsylvania, and Rhode Island regulated businesses totaling ~8.5B revenue.
- Generates electricity from coal, gas, hydro, solar; operates in US and UK regulated markets; no direct disruption data.
FirstEnergy Corp. vs PPL Corporation Positioning
FirstEnergy has a more diversified generation portfolio and broader geographic reach within the US, while PPL has a more concentrated regulated segment focus including international exposure. FirstEnergy’s larger customer base contrasts with PPL’s dual-country presence, reflecting different market strategies and scale advantages.
Which has the best competitive advantage?
Both companies are shedding value as ROIC is below WACC; however, PPL shows a growing ROIC trend, suggesting improving profitability, while FirstEnergy experiences declining returns, indicating a weaker competitive moat.
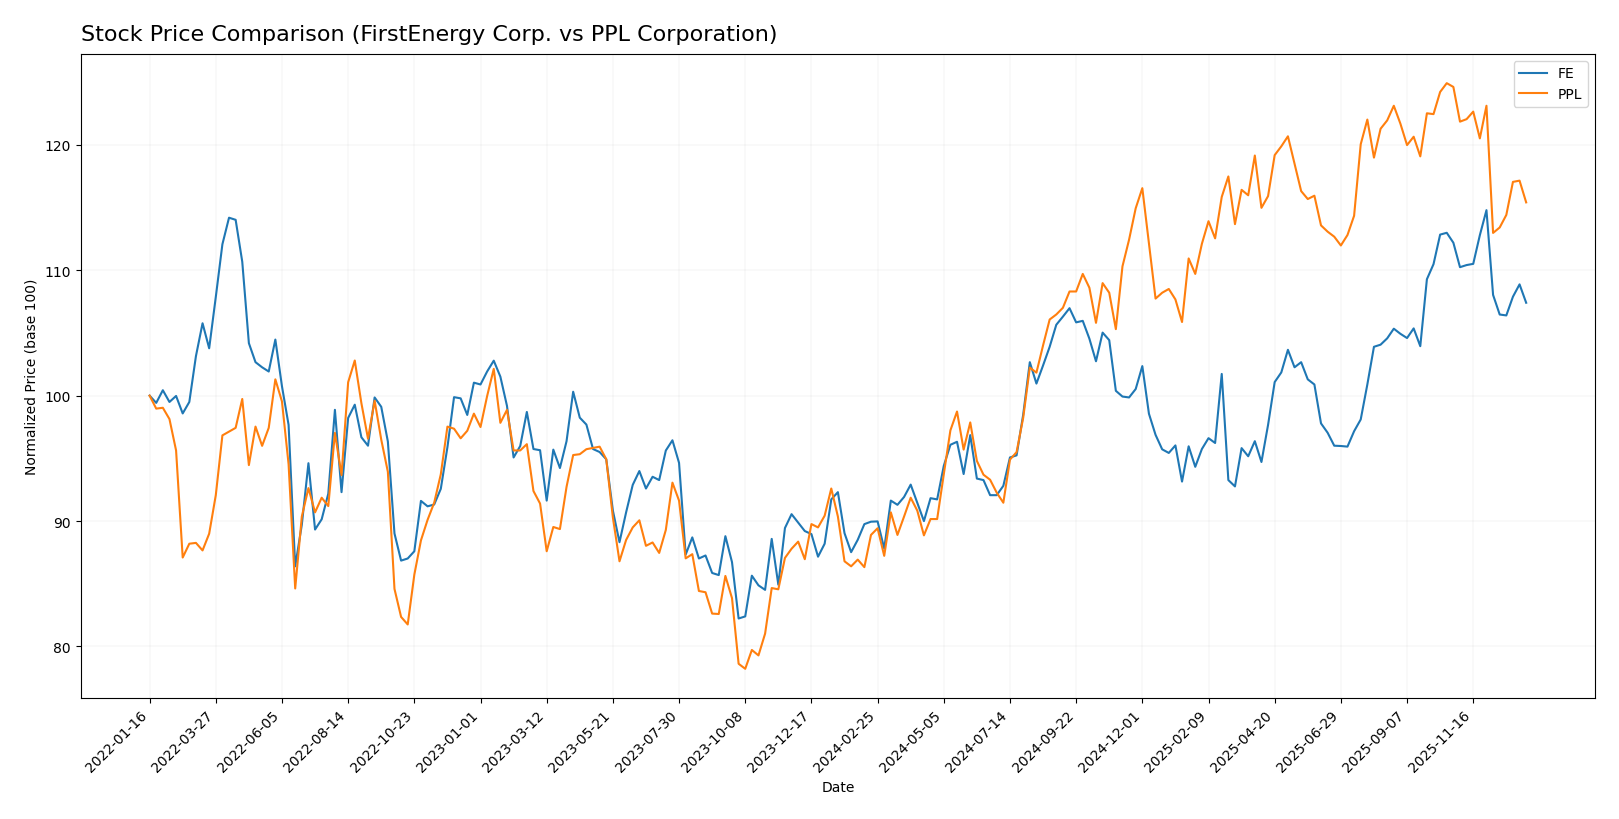
Stock Comparison
The stock price charts of FirstEnergy Corp. and PPL Corporation over the past year reveal significant bullish trends, with both stocks showing notable gains despite a recent period of decline.
Trend Analysis
FirstEnergy Corp. exhibited a bullish trend with a 19.42% price increase over the past 12 months, though the trend shows deceleration. The stock reached a high of 47.72 and a low of 36.5, with recent weeks showing a slight bearish correction.
PPL Corporation demonstrated a stronger bullish trend, gaining 29.84% over the last year but also experiencing deceleration. The highest price hit 37.44 while the lowest was 26.14, with a more pronounced recent decline compared to FirstEnergy.
Comparing both, PPL Corporation delivered a higher market performance over the analyzed period, despite recent downturns, outperforming FirstEnergy in total price appreciation.
Target Prices
The current analyst consensus indicates moderate upside potential for both FirstEnergy Corp. and PPL Corporation.
| Company | Target High | Target Low | Consensus |
|---|---|---|---|
| FirstEnergy Corp. | 54 | 46 | 49.29 |
| PPL Corporation | 45 | 36 | 41.29 |
Analysts expect FirstEnergy’s stock to rise above its current price of $44.65, while PPL’s consensus target also suggests an upside from its $34.59 level. Both show potential gains within a cautious range.
Analyst Opinions Comparison
This section compares analysts’ ratings and grades for FirstEnergy Corp. and PPL Corporation:
Rating Comparison
FirstEnergy Corp. Rating
- Rating: B, classified as Very Favorable by analysts, indicating solid overall financial standing.
- Discounted Cash Flow Score: 4, Favorable, suggests FirstEnergy’s stock may be undervalued based on cash flow.
- ROE Score: 4, Favorable, shows FirstEnergy efficiently generates profit from shareholders’ equity.
- ROA Score: 3, Moderate, FirstEnergy uses its assets with average effectiveness to generate earnings.
- Debt To Equity Score: 1, Very Unfavorable, FirstEnergy carries higher financial risk due to debt levels.
- Overall Score: 3, Moderate, FirstEnergy has a balanced but not outstanding overall financial score.
PPL Corporation Rating
- Rating: C+, also labeled Very Favorable, reflecting a positive but lower assessment than FirstEnergy.
- Discounted Cash Flow Score: 1, Very Unfavorable, indicating PPL’s stock appears overvalued or weak in cash flow.
- ROE Score: 3, Moderate, PPL has decent but less efficient equity profit generation compared to FirstEnergy.
- ROA Score: 3, Moderate, PPL similarly shows average asset utilization to create earnings.
- Debt To Equity Score: 2, Moderate, PPL demonstrates better balance sheet strength with lower relative debt.
- Overall Score: 2, Moderate, PPL’s overall financial score is below FirstEnergy’s, reflecting weaker metrics.
Which one is the best rated?
Based on the data, FirstEnergy holds a better rating (B vs. C+) and higher scores in discounted cash flow and return on equity. Despite its weaker debt to equity score, FirstEnergy’s overall financial standing is stronger than PPL’s.
Scores Comparison
The comparison of the Altman Z-Score and Piotroski Score for the two companies is as follows:
FE Scores
- Altman Z-Score: 0.78, in distress zone, high risk of bankruptcy
- Piotroski Score: 6, average financial strength
PPL Scores
- Altman Z-Score: 0.97, in distress zone, high risk of bankruptcy
- Piotroski Score: 6, average financial strength
Which company has the best scores?
Both FE and PPL have Altman Z-Scores in the distress zone, indicating financial risk. Their Piotroski Scores are identical at 6, reflecting average financial strength. Thus, neither company shows a distinct advantage based on these scores.
Grades Comparison
Here is a comparison of recent reliable grades and ratings from major financial institutions for the two companies:
FirstEnergy Corp. Grades
This table summarizes recent grades assigned by reputable financial firms for FirstEnergy Corp.:
| Grading Company | Action | New Grade | Date |
|---|---|---|---|
| UBS | Maintain | Neutral | 2025-12-17 |
| Mizuho | Maintain | Neutral | 2025-10-24 |
| Scotiabank | Maintain | Sector Outperform | 2025-10-24 |
| UBS | Maintain | Neutral | 2025-10-24 |
| Morgan Stanley | Maintain | Overweight | 2025-10-21 |
| Jefferies | Maintain | Hold | 2025-10-21 |
| Keybanc | Downgrade | Sector Weight | 2025-10-15 |
| Scotiabank | Maintain | Sector Outperform | 2025-10-06 |
| Morgan Stanley | Maintain | Overweight | 2025-09-25 |
| Barclays | Upgrade | Overweight | 2025-08-25 |
Overall, FirstEnergy displays mostly neutral to overweight ratings with some sector outperform grades, indicating a cautious but generally positive outlook from analysts.
PPL Corporation Grades
This table summarizes recent grades assigned by reputable financial firms for PPL Corporation:
| Grading Company | Action | New Grade | Date |
|---|---|---|---|
| UBS | Maintain | Neutral | 2025-12-17 |
| Wells Fargo | Maintain | Overweight | 2025-12-12 |
| JP Morgan | Maintain | Overweight | 2025-12-11 |
| BMO Capital | Maintain | Outperform | 2025-10-21 |
| B of A Securities | Maintain | Buy | 2025-10-16 |
| Barclays | Maintain | Equal Weight | 2025-10-14 |
| UBS | Maintain | Neutral | 2025-10-10 |
| Morgan Stanley | Maintain | Overweight | 2025-09-25 |
| Barclays | Maintain | Equal Weight | 2025-07-01 |
| Morgan Stanley | Maintain | Overweight | 2025-06-18 |
PPL Corporation shows a stronger analyst consensus with predominantly overweight and buy ratings, reflecting a more favorable market sentiment.
Which company has the best grades?
PPL Corporation holds a stronger overall rating consensus with multiple buy and outperform designations, compared to FirstEnergy’s more mixed neutral and overweight grades. This may imply higher analyst confidence in PPL’s growth prospects or stability, which investors often interpret as a positive signal for potential portfolio inclusion.
Strengths and Weaknesses
Below is a comparison table of key strengths and weaknesses for FirstEnergy Corp. (FE) and PPL Corporation (PPL) based on the most recent financial and operational data.
| Criterion | FirstEnergy Corp. (FE) | PPL Corporation (PPL) |
|---|---|---|
| Diversification | Primarily focused on regulated distribution and transmission; limited geographic diversification | More geographically diversified across several U.S. states (Kentucky, Pennsylvania, Rhode Island) |
| Profitability | Net margin 7.26% (neutral); ROIC 3.66% (unfavorable); declining ROIC trend | Higher net margin 10.49% (favorable); ROIC 3.59% (unfavorable) but with improving ROIC trend |
| Innovation | Low innovation emphasis; legacy regulated utility model | Moderate innovation with focus on efficiency improvements in regulated markets |
| Global presence | No significant international operations | Previously had UK operations, now focused mainly on U.S. regulated markets |
| Market Share | Strong regional presence in regulated distribution | Solid market share in multiple U.S. state markets |
Key takeaways: Both companies operate mainly in regulated utility sectors with stable but limited diversification. FE shows weakening profitability and value destruction, while PPL demonstrates improving profitability despite overall unfavorable returns. Investors should weigh FE’s value erosion against PPL’s gradual turnaround and geographic diversification.
Risk Analysis
Below is a comparative risk table for FirstEnergy Corp. (FE) and PPL Corporation (PPL) based on their latest 2024 financial data and market conditions.
| Metric | FirstEnergy Corp. (FE) | PPL Corporation (PPL) |
|---|---|---|
| Market Risk | Moderate (Beta 0.63) | Moderate (Beta 0.72) |
| Debt Level | High (D/E 1.95, Unfavorable) | Elevated (D/E 1.19, Unfavorable) |
| Regulatory Risk | High (Utility sector, multi-state regulation) | High (Utility sector, US & UK regulation) |
| Operational Risk | Moderate (Aging coal and nuclear assets) | Moderate (Mixed generation assets, UK exposure) |
| Environmental Risk | Elevated (Coal use, transition pressures) | Elevated (Coal & gas assets, renewables transition) |
| Geopolitical Risk | Low (US-focused operations) | Moderate (US and UK operations, Brexit-related uncertainty) |
The most impactful risks are regulatory and environmental due to ongoing energy transition and stricter emissions policies. Both companies are financially stressed, reflected in high debt levels and distress zone Altman Z-Scores, increasing bankruptcy risk. Market and geopolitical risks remain moderate but warrant monitoring, especially for PPL’s UK exposure. Investors should weigh these risks carefully against dividend yields and sector stability.
Which Stock to Choose?
FirstEnergy Corp. (FE) shows mixed income evolution with a 4.68% revenue growth but declining net margin and EPS over five years, and a slightly unfavorable overall income statement. Its financial ratios are mostly unfavorable, reflecting high leverage and weak liquidity. Despite this, its rating is very favorable (B). The company has a very unfavorable economic moat, indicating value destruction and declining profitability.
PPL Corporation (PPL) presents moderate revenue growth but a more favorable recent income statement, with positive EBIT and net margin growth. Its financial ratios remain mostly unfavorable, with moderate leverage and liquidity concerns. The rating is very favorable (C+). The economic moat is slightly unfavorable, showing value destruction but improving profitability trends.
Investors focused on income growth and improving profitability might find PPL more aligned with their goals, while those considering a higher-rated company with a stable but challenged financial structure may view FE as more suitable. The choice could depend on tolerance for financial risks and preference for either improving margins or a stronger rating profile.
Disclaimer: Investment carries a risk of loss of initial capital. The past performance is not a reliable indicator of future results. Be sure to understand risks before making an investment decision.
Go Further
I encourage you to read the complete analyses of FirstEnergy Corp. and PPL Corporation to enhance your investment decisions: