In the competitive landscape of regulated electric utilities, Pacific Gas & Electric Co. (PCG) and FirstEnergy Corp. (FE) stand out as two prominent players shaping the U.S. energy market. Both companies operate extensive electric and gas distribution networks, employing diverse energy generation strategies including nuclear, hydroelectric, and renewable sources. This comparison explores their market positions, innovation approaches, and financial health to help you decide which utility stock could be a valuable addition to your investment portfolio.

Table of contents
Companies Overview
I will begin the comparison between Pacific Gas & Electric Co. and FirstEnergy Corp. by providing an overview of these two companies and their main differences.
Pacific Gas & Electric Co. Overview
Pacific Gas & Electric Co. operates as a major utility company in northern and central California, generating, transmitting, distributing, and selling electricity and natural gas. Its power sources include nuclear, hydroelectric, fossil fuel, and photovoltaic energy. The company also innovates with integrated personal microgrid backup power devices, serving a diverse customer base across residential, commercial, industrial, and agricultural sectors.
FirstEnergy Corp. Overview
FirstEnergy Corp. is a utility company operating in multiple U.S. states, including Ohio and Pennsylvania, with a focus on regulated distribution and transmission. It owns and operates a variety of power plants such as coal, nuclear, hydroelectric, natural gas, wind, and solar facilities. The company manages extensive transmission and distribution infrastructure and serves about 6 million customers across six states in the eastern United States.
Key similarities and differences
Both companies operate within the regulated electric utility sector, focusing on electricity generation, transmission, and distribution using diverse energy sources. Pacific Gas & Electric primarily serves northern and central California, while FirstEnergy’s operations cover a broader eastern U.S. region. FirstEnergy has a larger transmission network in terms of circuit miles, whereas Pacific Gas & Electric emphasizes integrated technology solutions like personal microgrids for its customers.
Income Statement Comparison
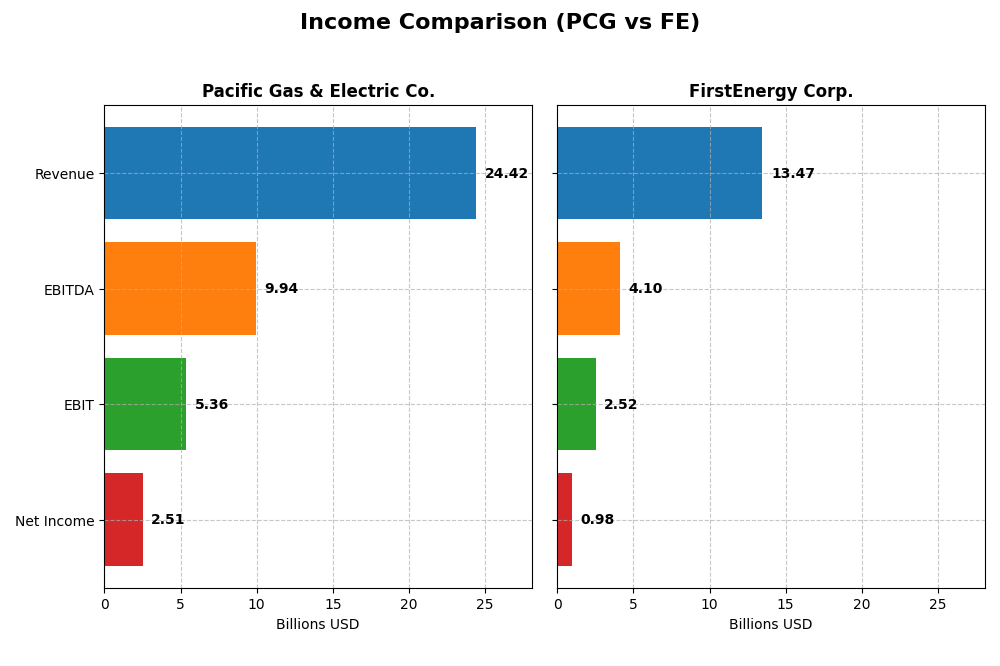
The table below compares key income statement metrics for Pacific Gas & Electric Co. and FirstEnergy Corp. based on their most recent fiscal year data for 2024.
| Metric | Pacific Gas & Electric Co. (PCG) | FirstEnergy Corp. (FE) |
|---|---|---|
| Market Cap | 34.8B | 25.8B |
| Revenue | 24.4B | 13.5B |
| EBITDA | 9.94B | 4.10B |
| EBIT | 5.36B | 2.52B |
| Net Income | 2.51B | 978M |
| EPS | 1.16 | 1.70 |
| Fiscal Year | 2024 | 2024 |
Income Statement Interpretations
Pacific Gas & Electric Co.
Pacific Gas & Electric Co. showed a notable revenue increase of 32.22% over 2020-2024, with net income surging 292.64%. Margins improved significantly, gross margin at 37.5% and net margin at 10.29%, both favorable. Despite a slight revenue decline of 0.04% in 2024, gross profit and EBIT grew robustly, reflecting margin expansion and operational efficiency.
FirstEnergy Corp.
FirstEnergy Corp. experienced moderate revenue growth of 24.86% over the period, though net income declined by 9.36%. Gross margin remained strong at 67.52%, with stable EBIT margin at 18.67%. However, 2024 showed a revenue increase of 4.68% but net margin and EPS deteriorated, indicating cost pressures and weakening profitability despite solid top-line growth.
Which one has the stronger fundamentals?
Pacific Gas & Electric Co. presents stronger fundamentals with consistently favorable margin improvements and significant net income growth. In contrast, FirstEnergy’s solid gross margins are overshadowed by net income and EPS declines, leading to an overall unfavorable income statement evaluation. The former’s operational gains and margin expansion outweigh the latter’s challenges in profitability.
Financial Ratios Comparison
The table below presents a side-by-side comparison of key financial ratios for Pacific Gas & Electric Co. (PCG) and FirstEnergy Corp. (FE) for the fiscal year 2024, offering insights into their profitability, liquidity, leverage, and efficiency metrics.
| Ratios | Pacific Gas & Electric Co. (PCG) | FirstEnergy Corp. (FE) |
|---|---|---|
| ROE | 8.33% | 7.85% |
| ROIC | 3.98% | 3.66% |
| P/E | 17.20 | 23.39 |
| P/B | 1.43 | 1.84 |
| Current Ratio | 1.05 | 0.56 |
| Quick Ratio | 1.00 | 0.45 |
| D/E (Debt-to-Equity) | 1.94 | 1.95 |
| Debt-to-Assets | 43.65% | 46.63% |
| Interest Coverage | 1.46 | 2.35 |
| Asset Turnover | 0.18 | 0.26 |
| Fixed Asset Turnover | 0.28 | 0.33 |
| Payout ratio | 3.42% | 99.18% |
| Dividend yield | 0.20% | 4.24% |
Interpretation of the Ratios
Pacific Gas & Electric Co.
Pacific Gas & Electric Co. shows mixed ratio strengths with a favorable net margin of 10.29% and solid valuation indicated by a price-to-book ratio of 1.43. However, concerns arise from its low returns on equity (8.33%) and invested capital (3.98%), alongside weak asset turnover ratios. The company pays a small dividend yield of 0.2%, which appears unsustainably low given the unfavorable interest coverage and elevated debt levels.
FirstEnergy Corp.
FirstEnergy Corp. presents neutral to unfavorable ratios, including a modest net margin of 7.26% and returns on equity and invested capital below 8%, reflecting operational challenges. Its liquidity ratios are weak, with current and quick ratios under 0.6. The dividend yield stands out positively at 4.24%, supported by a neutral interest coverage ratio, though high leverage and weak asset turnover remain concerns.
Which one has the best ratios?
Both Pacific Gas & Electric Co. and FirstEnergy Corp. face notable weaknesses, particularly in returns and leverage metrics. Pacific Gas & Electric fares better on profitability and liquidity ratios, whereas FirstEnergy offers a significantly higher dividend yield but struggles with liquidity. Overall, each company exhibits a slightly unfavorable ratio profile with different risk and income characteristics to consider.
Strategic Positioning
This section compares the strategic positioning of Pacific Gas & Electric Co. (PCG) and FirstEnergy Corp. (FE) in terms of Market position, Key segments, and Exposure to technological disruption:
Pacific Gas & Electric Co.
- Large market cap of 34.8B with lower beta, facing regulated electric market pressures.
- Key segments: Electricity (18.6B), Natural Gas (6.6B), serving residential to industrial sectors.
- Developing personal microgrid backup power integrating with SmartMeter, addressing tech disruption.
FirstEnergy Corp.
- Smaller 25.8B market cap, moderate beta, operates in regulated electric markets.
- Key segments: Regulated Distribution (6.9B), Regulated Transmission (1.8B), serving ~6M customers.
- Operates diverse generation assets including coal, nuclear, wind, solar; no specific tech disruption noted.
PCG vs FE Positioning
PCG has a diversified portfolio across electricity and natural gas with innovative technology integration, while FE focuses more on regulated distribution and transmission with broad generation assets. PCG’s larger scale contrasts with FE’s customer base spread across six states.
Which has the best competitive advantage?
Both companies are currently shedding value as ROIC is below WACC; however, PCG shows growing profitability trends, whereas FE experiences declining profitability, indicating a relatively stronger competitive position for PCG despite challenges.
Stock Comparison
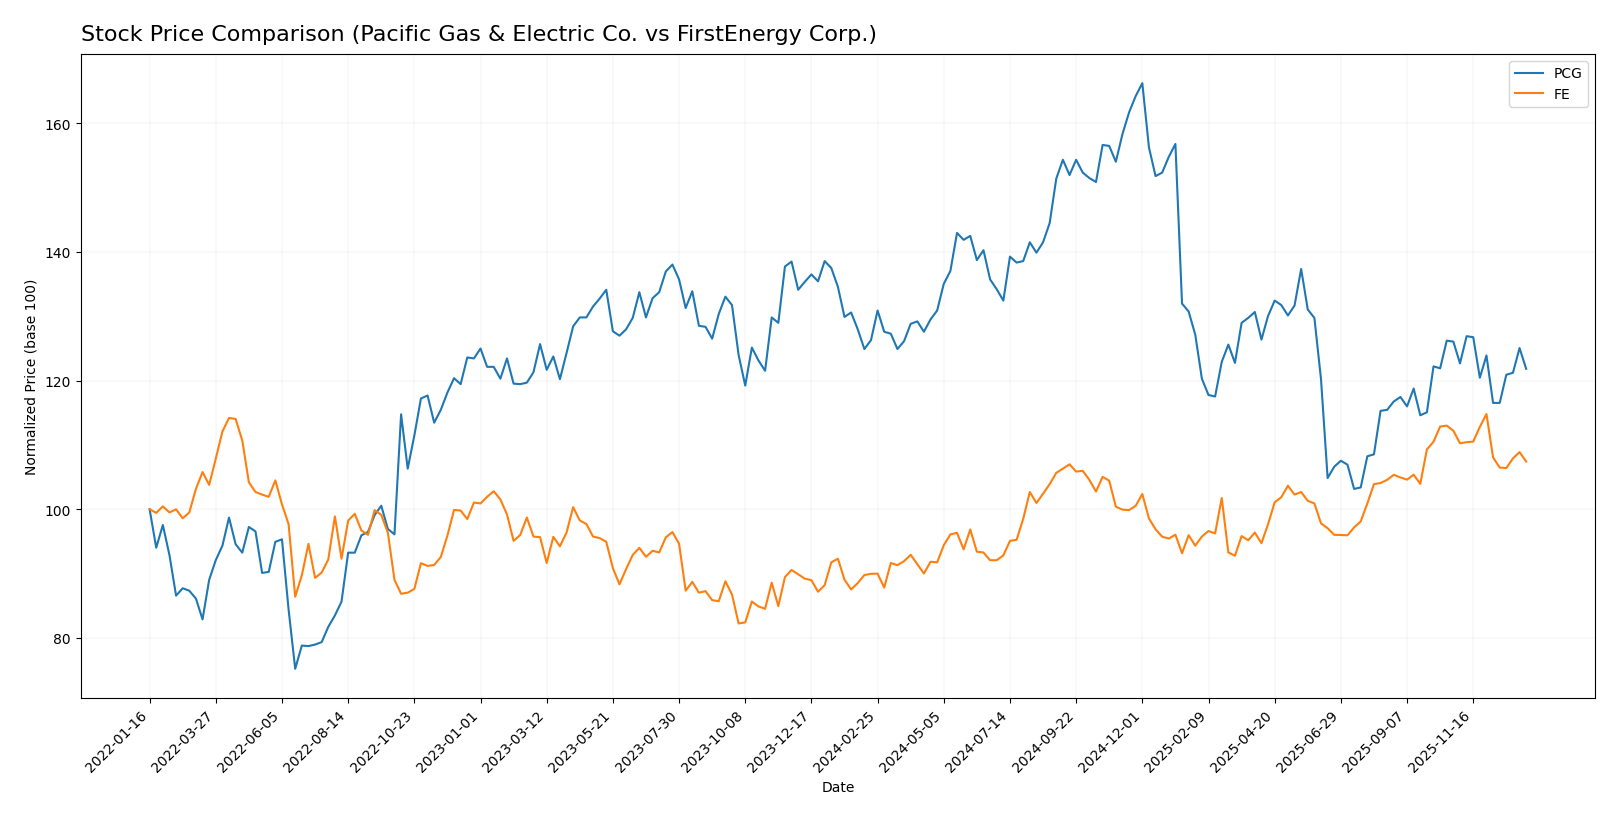
The stock price movements of Pacific Gas & Electric Co. and FirstEnergy Corp. over the past 12 months highlight contrasting trends, with notable shifts in market sentiment and trading volumes affecting their trajectories.
Trend Analysis
Pacific Gas & Electric Co. (PCG) experienced a bearish trend over the past year, with a price decline of -3.53%. The trend shows deceleration and moderate volatility, with prices ranging between 13.42 and 21.63.
FirstEnergy Corp. (FE) displayed a bullish trend over the same period, gaining 19.42%. Despite deceleration in momentum, volatility was slightly higher than PCG’s, with prices spanning 36.5 to 47.72.
Comparing both, FirstEnergy outperformed Pacific Gas & Electric in market performance, delivering significant positive returns while PCG’s stock declined.
Target Prices
The current analyst consensus indicates moderate upside potential for both Pacific Gas & Electric Co. and FirstEnergy Corp.
| Company | Target High | Target Low | Consensus |
|---|---|---|---|
| Pacific Gas & Electric Co. | 25 | 18 | 21.5 |
| FirstEnergy Corp. | 54 | 46 | 49.29 |
For Pacific Gas & Electric Co., the consensus target price of 21.5 USD is significantly above the current price of 15.85 USD, suggesting potential growth. FirstEnergy Corp. shows a consensus target near 49.29 USD, also above its present market price of 44.65 USD, indicating positive analyst expectations.
Analyst Opinions Comparison
This section compares analysts’ ratings and grades for Pacific Gas & Electric Co. (PCG) and FirstEnergy Corp. (FE):
Rating Comparison
PCG Rating
- Rating: B-, classified as Very Favorable.
- Discounted Cash Flow Score: 1, indicating Very Unfavorable valuation.
- ROE Score: 3, reflecting Moderate profitability from shareholders’ equity.
- ROA Score: 3, showing Moderate asset utilization efficiency.
- Debt To Equity Score: 1, indicating Very Unfavorable financial risk profile.
- Overall Score: 3, assessed as Moderate overall financial standing.
FE Rating
- Rating: B, classified as Very Favorable.
- Discounted Cash Flow Score: 4, indicating a Favorable valuation.
- ROE Score: 4, reflecting Favorable profitability from shareholders’ equity.
- ROA Score: 3, showing Moderate asset utilization efficiency.
- Debt To Equity Score: 1, indicating Very Unfavorable financial risk profile.
- Overall Score: 3, assessed as Moderate overall financial standing.
Which one is the best rated?
Based strictly on the provided data, FE holds a higher rating (B vs. B-) and scores better on discounted cash flow and return on equity, while both share similar overall and asset utilization scores. Debt risk is equally unfavorable for both.
Scores Comparison
Here is a comparison of the Altman Z-Score and Piotroski Score for Pacific Gas & Electric Co. and FirstEnergy Corp.:
PCG Scores
- Altman Z-Score: 0.48, indicating financial distress and high bankruptcy risk.
- Piotroski Score: 5, reflecting average financial strength.
FE Scores
- Altman Z-Score: 0.78, indicating financial distress and high bankruptcy risk.
- Piotroski Score: 6, reflecting average financial strength.
Which company has the best scores?
Based on the provided data, FE has slightly better scores with a higher Altman Z-Score and Piotroski Score, though both companies remain in financial distress with average financial strength.
Grades Comparison
Here is the detailed grades comparison for Pacific Gas & Electric Co. and FirstEnergy Corp.:
Pacific Gas & Electric Co. Grades
The recent grades from leading financial institutions for Pacific Gas & Electric Co. are as follows:
| Grading Company | Action | New Grade | Date |
|---|---|---|---|
| JP Morgan | Maintain | Overweight | 2025-12-12 |
| UBS | Maintain | Neutral | 2025-10-24 |
| Jefferies | Maintain | Buy | 2025-10-22 |
| BMO Capital | Maintain | Outperform | 2025-10-14 |
| Jefferies | Maintain | Buy | 2025-10-03 |
| Barclays | Maintain | Overweight | 2025-10-01 |
| Morgan Stanley | Maintain | Equal Weight | 2025-09-25 |
| Morgan Stanley | Upgrade | Equal Weight | 2025-09-18 |
| UBS | Maintain | Neutral | 2025-09-18 |
| Barclays | Maintain | Overweight | 2025-07-22 |
Pacific Gas & Electric Co. shows a consistent pattern of mostly buy-side or overweight ratings, with several upgrades and no downgrades in the recent period.
FirstEnergy Corp. Grades
The recent grades from leading financial institutions for FirstEnergy Corp. are as follows:
| Grading Company | Action | New Grade | Date |
|---|---|---|---|
| UBS | Maintain | Neutral | 2025-12-17 |
| Mizuho | Maintain | Neutral | 2025-10-24 |
| Scotiabank | Maintain | Sector Outperform | 2025-10-24 |
| UBS | Maintain | Neutral | 2025-10-24 |
| Morgan Stanley | Maintain | Overweight | 2025-10-21 |
| Jefferies | Maintain | Hold | 2025-10-21 |
| Keybanc | Downgrade | Sector Weight | 2025-10-15 |
| Scotiabank | Maintain | Sector Outperform | 2025-10-06 |
| Morgan Stanley | Maintain | Overweight | 2025-09-25 |
| Barclays | Upgrade | Overweight | 2025-08-25 |
FirstEnergy Corp. has a mix of neutral, hold, and overweight ratings, with some downgrades and upgrades, reflecting more cautious sentiment compared to its peer.
Which company has the best grades?
Pacific Gas & Electric Co. has received stronger and more consistent buy-side and overweight ratings compared to FirstEnergy Corp., which shows a more mixed and cautious grading profile. This difference may affect investor confidence and portfolio positioning by indicating relative analyst conviction in Pacific Gas & Electric Co.’s outlook over FirstEnergy Corp.
Strengths and Weaknesses
The following table summarizes the key strengths and weaknesses of Pacific Gas & Electric Co. (PCG) and FirstEnergy Corp. (FE) based on their diversification, profitability, innovation, global presence, and market share.
| Criterion | Pacific Gas & Electric Co. (PCG) | FirstEnergy Corp. (FE) |
|---|---|---|
| Diversification | Revenue mainly from Electricity (18.6B) and Natural Gas (6.6B), showing moderate product diversification within regulated energy sectors | Primarily focused on Regulated Distribution (6.9B) and Transmission (1.8B), with some exposure to unregulated energy services; less diversified |
| Profitability | Net margin favorable at 10.3%, but ROIC (3.98%) below WACC (4.68%), indicating slight value destruction despite improving ROIC trend | Net margin neutral at 7.3%, with ROIC (3.66%) below WACC (4.85%) and declining profitability, signaling value destruction |
| Innovation | Limited innovation indicators; operational efficiency and asset turnover ratios unfavorable, suggesting room for improvement | Similar challenges with operational efficiency; declining ROIC trend points to weak innovation or operational adaptation |
| Global presence | Primarily US-regulated markets with no significant international operations | Also focused on US-regulated markets; no notable global footprint |
| Market Share | Strong in California electricity and natural gas markets with consistent revenue growth | Concentrated in regulated transmission and distribution markets, but less dominant compared to PCG |
In summary, both companies face challenges in profitability and operational efficiency, with PCG showing a slightly more favorable outlook due to improving ROIC. However, both lack significant diversification and global presence, which may limit growth opportunities and expose investors to regional regulatory risks.
Risk Analysis
The table below summarizes key risks associated with Pacific Gas & Electric Co. (PCG) and FirstEnergy Corp. (FE) based on their latest financial and operational data from 2024.
| Metric | Pacific Gas & Electric Co. (PCG) | FirstEnergy Corp. (FE) |
|---|---|---|
| Market Risk | Low beta (0.38) indicates lower volatility; moderate market exposure | Moderate beta (0.63) implies somewhat higher volatility and market sensitivity |
| Debt level | High debt-to-equity ratio (~1.94), unfavorable interest coverage (1.76) | High debt-to-equity (~1.95), moderate interest coverage (2.49), both signal leverage risks |
| Regulatory Risk | High, given California’s strict utility regulations and wildfire liabilities | High, operating in multiple states with complex regulatory environments |
| Operational Risk | Moderate, with infrastructure aging and asset turnover low (0.18) | Moderate, with extensive transmission network but low asset turnover (0.26) |
| Environmental Risk | Significant, due to wildfire liabilities and fossil fuel reliance | Moderate, with coal and nuclear assets under environmental scrutiny |
| Geopolitical Risk | Low, primarily US domestic operations | Low, US focused but spread across several states |
Both companies face critical financial stress signals: Altman Z-Scores place them in the distress zone, indicating high bankruptcy risk. Market risk is moderate to low, but regulatory and environmental risks are particularly impactful, especially for PCG with its wildfire liabilities. High leverage and weak interest coverage further amplify financial vulnerability. Investors should weigh these risks carefully against potential dividends and strategic shifts in energy mix.
Which Stock to Choose?
Pacific Gas & Electric Co. (PCG) has shown a favorable income statement with strong growth in net income and margins, despite a slight revenue decline. Its financial ratios are slightly unfavorable overall, reflecting moderate profitability and high debt levels. The company’s rating is very favorable, but scores indicate financial distress with average Piotroski strength.
FirstEnergy Corp. (FE) presents a less favorable income evolution, marked by declining net income and margins over the long term, though recent revenue growth is neutral. Its financial ratios are also slightly unfavorable, with weaker liquidity and moderate profitability. FE holds a very favorable rating overall but is similarly in the distress zone with an average Piotroski score.
Considering ratings and financial evaluations, PCG’s improving profitability amid value shedding and FE’s declining profitability both suggest risks. Investors prioritizing growth potential might find PCG more appealing, while those seeking dividend yield and moderate stability may see FE as a possible choice, depending on risk tolerance and strategy.
Disclaimer: Investment carries a risk of loss of initial capital. The past performance is not a reliable indicator of future results. Be sure to understand risks before making an investment decision.
Go Further
I encourage you to read the complete analyses of Pacific Gas & Electric Co. and FirstEnergy Corp. to enhance your investment decisions: