Investors seeking opportunities in the regulated electric sector face choices between established power giants and innovative newcomers. FirstEnergy Corp. (FE) operates a vast, diversified energy portfolio with a strong foothold in traditional and renewable sources. Meanwhile, Oklo Inc. (OKLO) pioneers advanced nuclear technology with a focus on fission power and fuel recycling. This article will analyze both companies to help you identify the most compelling investment for your portfolio.
Table of contents
Companies Overview
I will begin the comparison between FirstEnergy Corp. and Oklo Inc. by providing an overview of these two companies and their main differences.
FirstEnergy Corp. Overview
FirstEnergy Corp. operates in the regulated electric industry, generating, transmitting, and distributing electricity across multiple states including Ohio and Pennsylvania. The company owns diverse power generation assets such as coal, nuclear, hydroelectric, natural gas, wind, and solar facilities. With a market cap of 25.8B USD and approximately 12,300 employees, FirstEnergy serves about 6 million customers primarily through its regulated distribution and transmission segments.
Oklo Inc. Overview
Oklo Inc. is a newer player in the regulated electric sector, focusing on designing and developing fission power plants for commercial-scale energy in the United States. Founded in 2013 and based in Santa Clara, California, Oklo also provides used nuclear fuel recycling services. The company has a market cap of 16.5B USD and a workforce of around 120 employees, reflecting its specialized and innovative approach within the utilities sector.
Key similarities and differences
Both FirstEnergy and Oklo operate in the regulated electric utilities sector in the US and are publicly traded on the NYSE. FirstEnergy has a broad energy mix and a large customer base, emphasizing traditional and renewable sources, while Oklo specializes in cutting-edge fission power technology and nuclear fuel recycling. The companies differ markedly in scale, with FirstEnergy being a large, established utility and Oklo a smaller, innovative firm with a focus on advanced nuclear solutions.
Income Statement Comparison
Below is the income statement comparison for FirstEnergy Corp. and Oklo Inc. based on their most recent fiscal year 2024 financial data.
| Metric | FirstEnergy Corp. (FE) | Oklo Inc. (OKLO) |
|---|---|---|
| Market Cap | 25.8B | 16.5B |
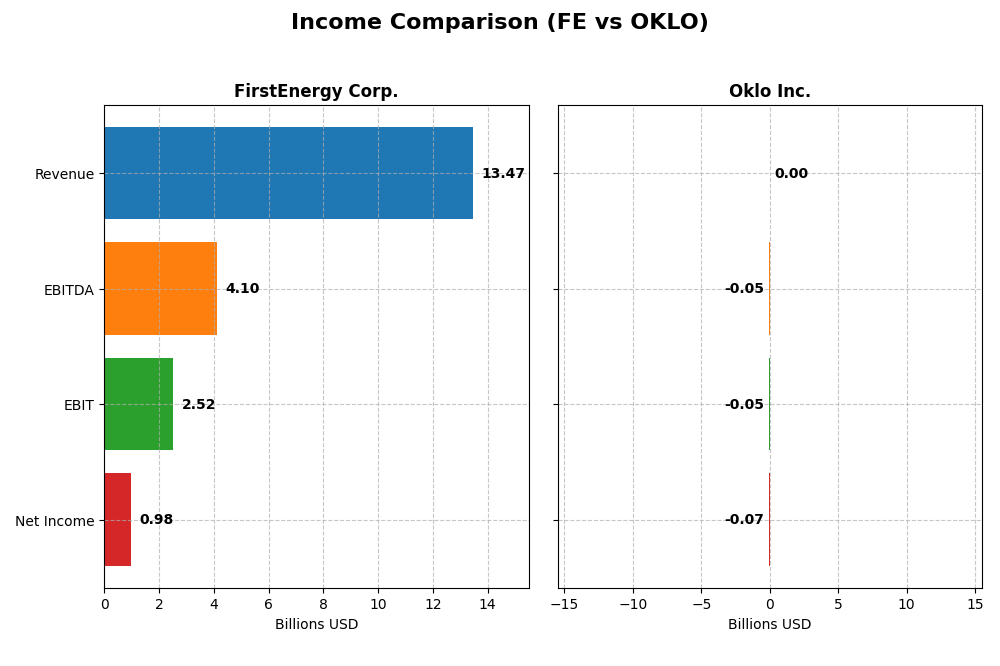
| Revenue | 13.5B | 0 |
| EBITDA | 4.1B | -52.5M |
| EBIT | 2.5B | -52.8M |
| Net Income | 978M | -73.6M |
| EPS | 1.7 | -0.74 |
| Fiscal Year | 2024 | 2024 |
Income Statement Interpretations
FirstEnergy Corp.
FirstEnergy’s revenue showed a steady increase from $10.79B in 2020 to $13.47B in 2024, a 24.9% growth over five years. Net income fluctuated, peaking at $1.28B in 2021 before declining to $978M in 2024. Margins remained relatively stable, with a gross margin of 67.5% and a net margin of 7.3% in 2024. The latest year saw moderate revenue growth of 4.7% but a 15.2% drop in net margin, indicating some pressure on profitability.
Oklo Inc.
Oklo reported no revenue from 2021 to 2024, reflecting its developmental stage. Net losses widened significantly from -$5.16M in 2021 to -$73.6M in 2024. Margins are negative, consistent with zero revenue and ongoing expenses related to R&D and G&A. The 2024 results showed an increased operating loss and a 59.4% decline in EPS, signaling escalating investment costs without corresponding income growth.
Which one has the stronger fundamentals?
FirstEnergy demonstrates stronger fundamentals with consistent revenue growth, positive gross and net margins, and substantial market capitalization of $25.8B. Oklo’s lack of revenue and growing net losses highlight its early-stage risk profile and ongoing investment phase. Both companies have unfavorable overall income statement evaluations, but FirstEnergy’s scale and profitability offer a more established financial footing.
Financial Ratios Comparison
The table below presents a side-by-side comparison of key financial ratios for FirstEnergy Corp. and Oklo Inc. based on their most recent fiscal year data (2024).
| Ratios | FirstEnergy Corp. (FE) | Oklo Inc. (OKLO) |
|---|---|---|
| ROE | 7.85% | -29.35% |
| ROIC | 3.66% | -19.23% |
| P/E | 23.39 | -28.52 |
| P/B | 1.84 | 8.37 |
| Current Ratio | 0.56 | 43.47 |
| Quick Ratio | 0.45 | 43.47 |
| D/E | 1.95 | 0.005 |
| Debt-to-Assets | 46.63% | 0.46% |
| Interest Coverage | 2.35 | 0 |
| Asset Turnover | 0.26 | 0 |
| Fixed Asset Turnover | 0.33 | 0 |
| Payout Ratio | 99.18% | 0 |
| Dividend Yield | 4.24% | 0 |
Interpretation of the Ratios
FirstEnergy Corp.
FirstEnergy shows a mixed financial profile with several unfavorable ratios, including low return on equity (7.85%) and return on invested capital (3.66%), alongside a weak liquidity position (current ratio 0.56). However, its weighted average cost of capital (4.85%) and dividend yield (4.24%) are favorable. The company pays consistent dividends supported by reasonable payout ratios, though some risk exists given its debt levels and cash flow coverage.
Oklo Inc.
Oklo’s financial ratios mostly appear unfavorable, marked notably by negative returns on equity (-29.35%) and invested capital (-19.23%), and zero net margin. Despite a very high current ratio (43.47), this signals potential inefficiency rather than strength. Oklo does not pay dividends, likely reflecting its growth phase and reinvestment strategy, prioritizing R&D and expansion over shareholder returns for now.
Which one has the best ratios?
Comparing the two, FirstEnergy presents a slightly unfavorable but more balanced set of ratios with some strengths in dividend yield and cost of capital. Oklo, despite some favorable liquidity and leverage metrics, suffers from deeply negative profitability and no dividend payout, leading to an overall unfavorable ratio profile relative to FirstEnergy.
Strategic Positioning
This section compares the strategic positioning of FirstEnergy Corp. and Oklo Inc., focusing on market position, key segments, and exposure to technological disruption:
FirstEnergy Corp.
- Large market cap of 25.8B USD, serving 6M customers, faces regulated electric industry pressures.
- Operates regulated distribution and transmission, with diversified energy sources including coal, nuclear, hydro, gas, wind, and solar.
- Exposure to traditional utility regulations; potential disruption from nuclear innovation but less diversified in tech disruption.
Oklo Inc.
- Smaller market cap of 16.5B USD, emerging player in fission power plant design and nuclear recycling.
- Focuses on fission power plants and used nuclear fuel recycling, concentrated in advanced nuclear technology.
- High exposure to technological disruption through innovative nuclear power plant designs and recycling services.
FirstEnergy Corp. vs Oklo Inc. Positioning
FirstEnergy has a diversified energy portfolio with extensive infrastructure and customer base, which provides stability but faces competitive pressures in regulated markets. Oklo’s concentrated focus on nuclear innovation offers growth potential but involves higher technological risks and a smaller scale.
Which has the best competitive advantage?
Both companies show very unfavorable MOAT evaluations with declining ROIC trends, indicating value destruction and weak competitive advantages based on efficient capital use and profitability. Neither currently demonstrates a strong sustainable economic moat.
Stock Comparison
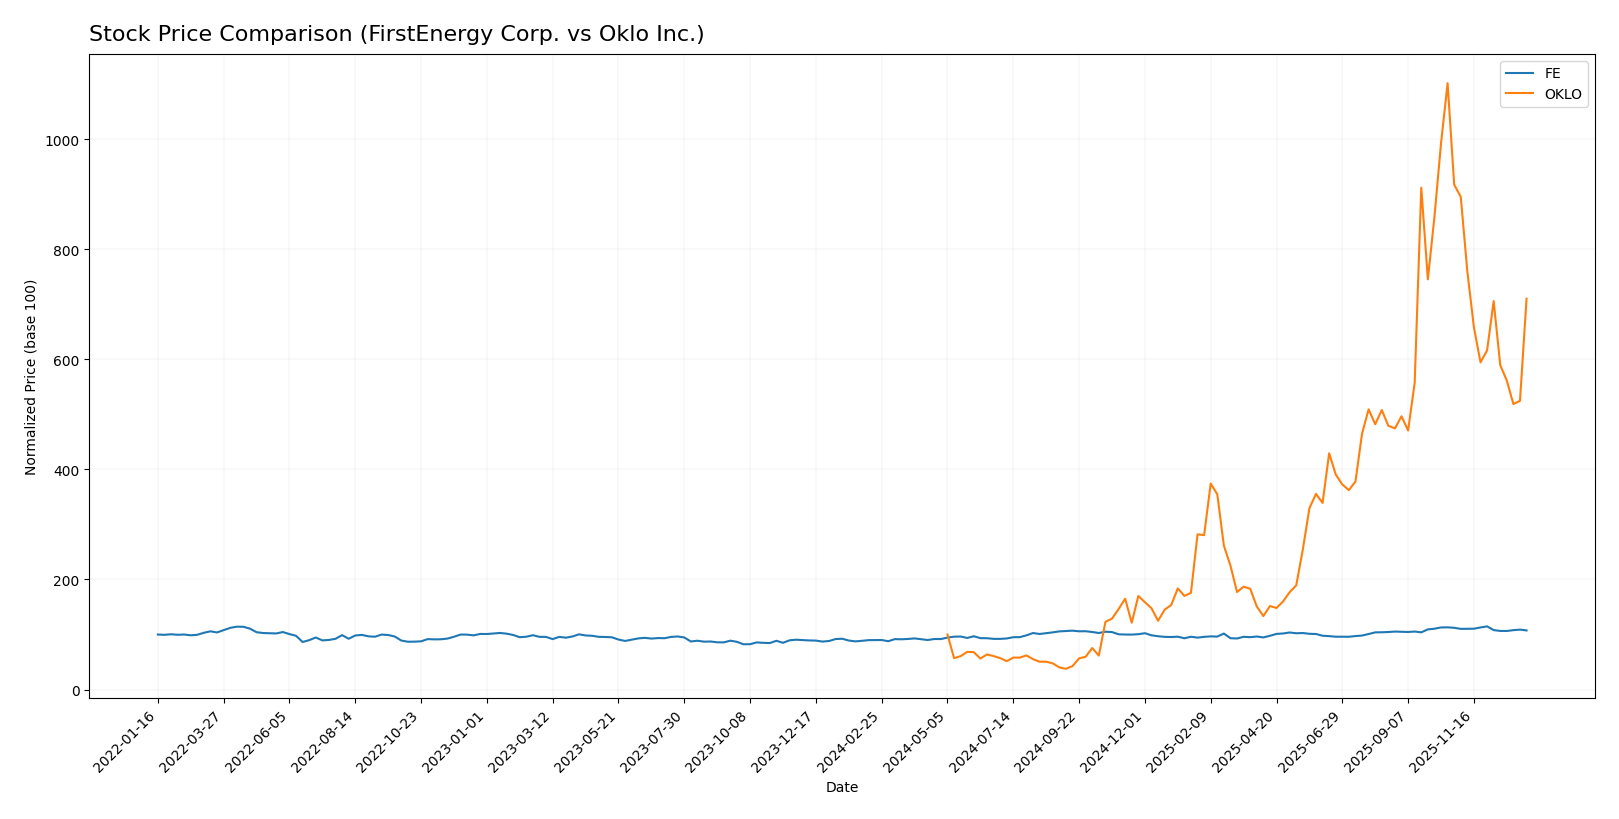
The stock prices of FirstEnergy Corp. and Oklo Inc. have experienced significant fluctuations over the past year, with both showing strong overall gains but recent declines, reflecting dynamic trading patterns and shifting investor sentiment.
Trend Analysis
FirstEnergy Corp. shows a bullish trend over the past 12 months with a 19.42% price increase, though the trend exhibits deceleration. The stock reached a high of 47.72 and a low of 36.5, with moderate volatility (std deviation 2.64). Recent months reveal a slight bearish reversal.
Oklo Inc. experienced a very strong bullish trend with a 610.11% price increase over the past year, despite deceleration and high volatility (std deviation 39.02). The stock’s price ranged from 5.59 to 163.39, but recent weeks show a sharp decline of 22.59%.
Comparing both stocks, Oklo Inc. delivered the highest market performance over the analyzed period, outperforming FirstEnergy Corp. by a wide margin despite recent volatility and downward pressure.
Target Prices
Analysts present a cautiously optimistic target consensus for both FirstEnergy Corp. and Oklo Inc.
| Company | Target High | Target Low | Consensus |
|---|---|---|---|
| FirstEnergy Corp. | 54 | 46 | 49.29 |
| Oklo Inc. | 150 | 95 | 125.67 |
The consensus targets for FirstEnergy Corp. and Oklo Inc. exceed their current stock prices of $44.65 and $105.31 respectively, indicating expectations of moderate to strong price appreciation.
Analyst Opinions Comparison
This section compares analysts’ ratings and grades for FirstEnergy Corp. and Oklo Inc.:
Rating Comparison
FE Rating
- Rating: B, considered Very Favorable overall by analysts.
- Discounted Cash Flow Score: 4, indicating a Favorable valuation outlook.
- ROE Score: 4, showing Favorable efficiency in generating shareholder profits.
- ROA Score: 3, assessed as Moderate asset utilization effectiveness.
- Debt To Equity Score: 1, seen as Very Unfavorable, indicating higher risk.
- Overall Score: 3, categorized as Moderate overall financial standing.
OKLO Rating
- Rating: C+, also marked Very Favorable overall despite a lower grade.
- Discounted Cash Flow Score: 3, reflecting a Moderate valuation assessment.
- ROE Score: 1, viewed as Very Unfavorable in terms of equity profit generation.
- ROA Score: 1, rated Very Unfavorable for asset use efficiency.
- Debt To Equity Score: 5, considered Very Favorable, implying low financial risk.
- Overall Score: 2, also Moderate but lower compared to FE’s score.
Which one is the best rated?
Based strictly on the data, FirstEnergy Corp. holds a higher rating (B) with stronger scores in discounted cash flow, ROE, and ROA. Oklo Inc. shows strength in debt management but has lower profitability and overall scores.
Scores Comparison
The scores comparison between FirstEnergy Corp. and Oklo Inc. is as follows:
FirstEnergy Corp. Scores
- Altman Z-Score: 0.78, in distress zone, high bankruptcy risk.
- Piotroski Score: 6, average financial strength.
Oklo Inc. Scores
- Altman Z-Score: 339.43, in safe zone, very low bankruptcy risk.
- Piotroski Score: 2, very weak financial strength.
Which company has the best scores?
Based on the provided data, Oklo has a much stronger Altman Z-Score indicating financial safety, but a weaker Piotroski Score than FirstEnergy, which shows average financial strength.
Grades Comparison
Here is the comparison of the recent grades assigned to FirstEnergy Corp. and Oklo Inc.:
FirstEnergy Corp. Grades
The table below summarizes recent grades for FirstEnergy Corp. from reputable grading companies.
| Grading Company | Action | New Grade | Date |
|---|---|---|---|
| UBS | Maintain | Neutral | 2025-12-17 |
| Mizuho | Maintain | Neutral | 2025-10-24 |
| Scotiabank | Maintain | Sector Outperform | 2025-10-24 |
| UBS | Maintain | Neutral | 2025-10-24 |
| Morgan Stanley | Maintain | Overweight | 2025-10-21 |
| Jefferies | Maintain | Hold | 2025-10-21 |
| Keybanc | Downgrade | Sector Weight | 2025-10-15 |
| Scotiabank | Maintain | Sector Outperform | 2025-10-06 |
| Morgan Stanley | Maintain | Overweight | 2025-09-25 |
| Barclays | Upgrade | Overweight | 2025-08-25 |
Overall, FirstEnergy Corp. shows a stable pattern with most grades clustered around Neutral to Overweight, indicating a generally cautious to positive outlook by analysts.
Oklo Inc. Grades
The following table presents recent grades for Oklo Inc. by recognized grading firms.
| Grading Company | Action | New Grade | Date |
|---|---|---|---|
| Seaport Global | Upgrade | Buy | 2025-12-08 |
| UBS | Maintain | Neutral | 2025-12-03 |
| B of A Securities | Maintain | Neutral | 2025-11-12 |
| B. Riley Securities | Maintain | Buy | 2025-11-12 |
| Wedbush | Maintain | Outperform | 2025-11-12 |
| B of A Securities | Downgrade | Neutral | 2025-09-30 |
| Seaport Global | Downgrade | Neutral | 2025-09-23 |
| Wedbush | Maintain | Outperform | 2025-09-22 |
| Wedbush | Maintain | Outperform | 2025-08-14 |
| Wedbush | Maintain | Outperform | 2025-08-12 |
Oklo Inc. displays a positive trend with multiple Buy and Outperform ratings, although occasional downgrades to Neutral suggest some caution.
Which company has the best grades?
Oklo Inc. has generally received more positive grades, including multiple Buy and Outperform ratings, compared to FirstEnergy Corp.’s mostly Neutral to Overweight consensus. Investors might interpret Oklo’s stronger grades as a signal of greater growth potential, while FirstEnergy’s ratings imply steadiness with moderate upside expectations.
Strengths and Weaknesses
Below is a comparative overview of the key strengths and weaknesses of FirstEnergy Corp. (FE) and Oklo Inc. (OKLO) based on their latest financial and operational data.
| Criterion | FirstEnergy Corp. (FE) | Oklo Inc. (OKLO) |
|---|---|---|
| Diversification | Moderate; primarily focused on regulated distribution and transmission segments with stable revenue streams (e.g., $6.86B in regulated distribution in 2024) | Low; early-stage with limited product and revenue diversification |
| Profitability | Moderate; net margin 7.26% (neutral), ROIC 3.66% (unfavorable), ROE 7.85% (unfavorable) | Negative profitability; net margin 0%, ROIC -19.23%, ROE -29.35% (unfavorable) |
| Innovation | Limited; traditional utility operations with slow ROIC decline (-20.3%) indicating challenges in growth | High potential; however, currently value-destroying with steep ROIC decline (-75.5%) reflecting early development stage |
| Global presence | Strong U.S. regulated market presence in electricity transmission and distribution | Minimal to none; niche focus with no significant global operations reported |
| Market Share | Established in regulated energy markets, stable but facing profitability pressures | Very small; emerging company with no reported revenues yet |
In summary, FirstEnergy Corp. offers a stable but declining profitability profile with a solid regulated market base, while Oklo Inc. is still in development with high risk and no current profitability. Investors should weigh stability against growth potential and manage risk accordingly.
Risk Analysis
Below is a comparative table summarizing key risks for FirstEnergy Corp. (FE) and Oklo Inc. (OKLO) based on the most recent 2024 data:
| Metric | FirstEnergy Corp. (FE) | Oklo Inc. (OKLO) |
|---|---|---|
| Market Risk | Moderate, beta 0.63 suggests lower volatility | Moderate, beta 0.77 indicates moderate volatility |
| Debt level | High leverage: Debt-to-equity 1.95 (unfavorable) | Very low debt: Debt-to-equity 0.01 (favorable) |
| Regulatory Risk | Significant due to regulated electric utility sector | High, as nuclear energy is heavily regulated |
| Operational Risk | Diverse energy sources, but aging infrastructure | High, early-stage nuclear technology risks |
| Environmental Risk | Exposure to coal and nuclear environmental issues | Moderate, nuclear fuel recycling involved |
| Geopolitical Risk | Low, primarily US-focused operations | Low, US-focused but nuclear tech sensitive to policy |
The most impactful risks are FirstEnergy’s high debt level combined with aging infrastructure and regulatory pressures in multiple states. Oklo faces significant operational and regulatory risks due to its advanced nuclear technology and early commercial stage, despite a strong balance sheet and low debt. Investors should weigh these risks carefully, considering FirstEnergy’s financial distress signals and Oklo’s technological uncertainties.
Which Stock to Choose?
FirstEnergy Corp. (FE) shows moderate revenue growth of 4.7% in 2024 with favorable gross and EBIT margins but declining net margin and EPS over the 2020–2024 period. Financial ratios reveal a slightly unfavorable profile, with low liquidity and high debt levels, despite a favorable dividend yield. The company’s rating is very favorable at grade B, though its Altman Z-Score signals financial distress.
Oklo Inc. (OKLO) exhibits no revenue growth and negative profitability metrics, with worsening EPS and net income over 2021–2024. Its financial ratios are generally unfavorable, except for strong liquidity and low debt. The company’s rating is very favorable at grade C+, but the Altman Z-Score suggests a safe zone with a very weak Piotroski score.
Investors focused on value preservation and dividend income might find FirstEnergy’s stable margins and rating more appealing, whereas those with high risk tolerance seeking growth potential might consider Oklo’s volatile but bullish price trend and low leverage, despite its unfavorable profitability and financial ratios.
Disclaimer: Investment carries a risk of loss of initial capital. The past performance is not a reliable indicator of future results. Be sure to understand risks before making an investment decision.
Go Further
I encourage you to read the complete analyses of FirstEnergy Corp. and Oklo Inc. to enhance your investment decisions: