Workday, Inc. and Figma, Inc. are two prominent players in the software application industry, each driving innovation in enterprise cloud solutions and collaborative design tools, respectively. While Workday focuses on financial and human capital management for large organizations, Figma revolutionizes product development with its browser-based design platform. This article will analyze their market positions and strategies to help you identify the most compelling investment opportunity.
Table of contents
Companies Overview
I will begin the comparison between Workday, Inc. and Figma, Inc. by providing an overview of these two companies and their main differences.
Workday Overview
Workday, Inc. provides enterprise cloud applications designed to help organizations plan, execute, analyze, and manage business operations. It offers financial management, human capital management, planning, and analytics applications aimed at improving operational efficiency and insights. Workday serves diverse industries including financial services, healthcare, education, and technology, positioning itself as a comprehensive cloud software provider since its incorporation in 2005.
Figma Overview
Figma, Inc. develops collaborative browser-based design tools targeted at design and development teams. Its product suite includes tools for interface design, prototyping, code inspection, brainstorming, and presentations, with AI-driven features to accelerate prototyping. Since its founding in 2012, Figma has focused on enabling seamless teamwork in product design, serving primarily the technology sector from its San Francisco headquarters.
Key similarities and differences
Both companies operate in the software application industry with a focus on cloud-based solutions, targeting business users. Workday emphasizes enterprise resource planning and human capital management across multiple industries, while Figma specializes in design collaboration tools mainly for product development teams. Workday is a larger firm by market cap and employee count, reflecting a broader enterprise focus, whereas Figma is newer with a niche in creative software tailored to designers and developers.
Income Statement Comparison
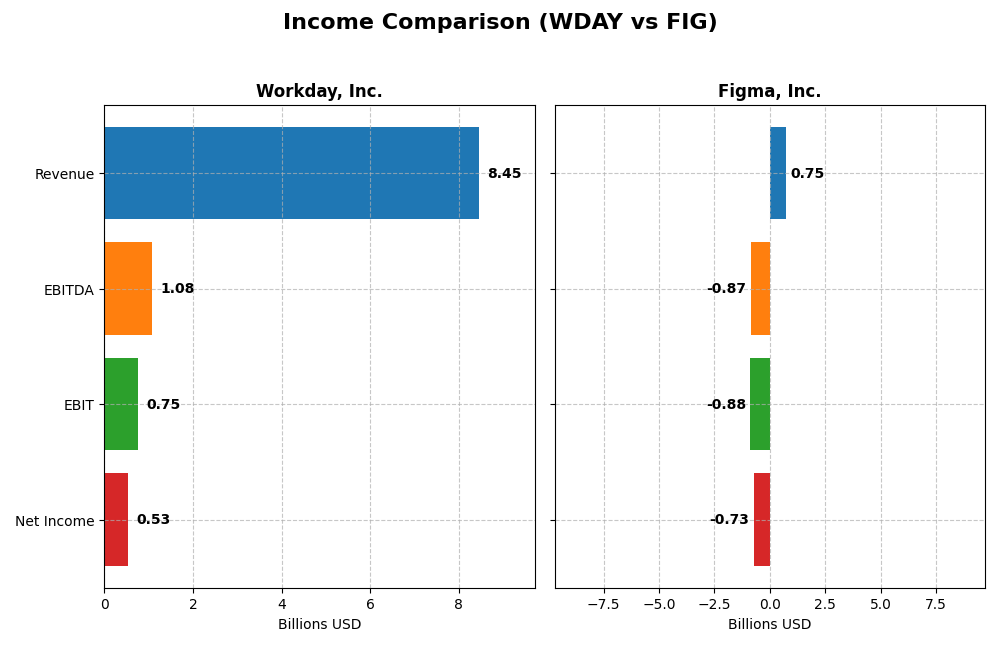
The table below compares the latest fiscal year income statement metrics for Workday, Inc. and Figma, Inc., providing a snapshot of their financial performance in 2025 and 2024 respectively.
| Metric | Workday, Inc. (WDAY) | Figma, Inc. (FIG) |
|---|---|---|
| Market Cap | 49.9B | 14.4B |
| Revenue | 8.45B | 749M |
| EBITDA | 1.08B | -870M |
| EBIT | 752M | -877M |
| Net Income | 526M | -732M |
| EPS | 1.98 | -3.11 |
| Fiscal Year | 2025 | 2024 |
Income Statement Interpretations
Workday, Inc.
Workday’s revenue and net income showed strong growth from 2021 to 2025, with revenue nearly doubling and net income increasing by over 280%. Gross margins remained robust around 75%, while EBIT margins were stable. The latest fiscal year saw a 16.35% revenue increase and a 60% EBIT growth, despite a notable decline in net margin and EPS growth.
Figma, Inc.
Figma’s revenue grew significantly by 48.36% from 2023 to 2024, but net income declined sharply, remaining negative. Gross margins were high at 88%, although EBIT and net margins were deeply negative and deteriorated further. Operating expenses grew unfavorably in line with revenue, and EPS fell considerably in the latest year.
Which one has the stronger fundamentals?
Workday exhibits stronger fundamentals with a favorable overall income statement evaluation, sustained revenue growth, improving EBIT, and positive net income trends. Figma, despite revenue growth, faces ongoing challenges with negative profitability, unfavorable margin trends, and net losses. The cautious assessment favors Workday’s more consistent financial performance.
Financial Ratios Comparison
The table below presents the most recent key financial ratios for Workday, Inc. and Figma, Inc., allowing a direct comparison of their financial health and market valuation as of their latest fiscal years.
| Ratios | Workday, Inc. (2025) | Figma, Inc. (2024) |
|---|---|---|
| ROE | 5.82% | -55.29% |
| ROIC | 2.73% | -59.68% |
| P/E | 132.15 | -70.71 |
| P/B | 7.69 | 39.10 |
| Current Ratio | 1.85 | 3.66 |
| Quick Ratio | 1.85 | 3.66 |
| D/E (Debt-to-Equity) | 0.37 | 0.02 |
| Debt-to-Assets | 18.70% | 1.60% |
| Interest Coverage | 3.64 | 0 |
| Asset Turnover | 0.47 | 0.42 |
| Fixed Asset Turnover | 5.36 | 17.09 |
| Payout Ratio | 0 | 0 |
| Dividend Yield | 0 | 0 |
Interpretation of the Ratios
Workday, Inc.
Workday exhibits a balanced set of financial ratios with favorable liquidity (current and quick ratios at 1.85) and low leverage (debt-to-equity at 0.37). However, profitability measures such as return on equity (5.82%) and return on invested capital (2.73%) are unfavorable, with an elevated price-to-earnings ratio of 132.15 indicating high valuation. The company does not pay dividends, reflecting a possible focus on reinvestment or growth.
Figma, Inc.
Figma shows significant challenges with negative profitability metrics, including a net margin of -97.74% and return on equity at -55.29%, signaling operational losses. Despite low debt levels and favorable weighted average cost of capital (4.76%), several ratios such as interest coverage at zero and a very high price-to-book ratio of 39.1 suggest financial stress and valuation concerns. Figma also does not distribute dividends, likely prioritizing growth and R&D.
Which one has the best ratios?
Comparing the two, Workday holds a more neutral overall rating with balanced liquidity and manageable leverage, while Figma’s ratios are predominantly unfavorable due to deep losses and weaker coverage ratios. Workday’s stronger asset turnover and interest coverage contrast with Figma’s operational difficulties, positioning Workday as having the more stable financial profile based on these ratios.
Strategic Positioning
This section compares the strategic positioning of Workday, Inc. and Figma, Inc. in terms of market position, key segments, and exposure to technological disruption:
Workday, Inc.
- Strong market presence in enterprise cloud applications with competitive pressure from diversified sectors.
- Key segments include subscription services and professional services, driven by financial management and HCM solutions.
- Exposure to technological disruption through integration of machine learning and augmented analytics in cloud applications.
Figma, Inc.
- Smaller market cap with a focus on collaborative UI design tools, facing intense competition in a niche market.
- Concentrated on browser-based design tools including Figma Design, Dev Mode, and AI-powered prototyping.
- High exposure to disruption with AI tools and browser-based innovation shaping product development workflows.
Workday, Inc. vs Figma, Inc. Positioning
Workday exhibits a diversified business model spanning multiple industries and service types, offering stability but facing broad competition. Figma focuses narrowly on design collaboration, enabling agility but limiting market scope and increasing dependency on innovation success.
Which has the best competitive advantage?
Both companies are currently shedding value relative to their capital costs. Workday shows improving profitability trends, indicating some operational resilience, whereas Figma faces declining profitability, suggesting weaker competitive advantage over the recent period.
Stock Comparison
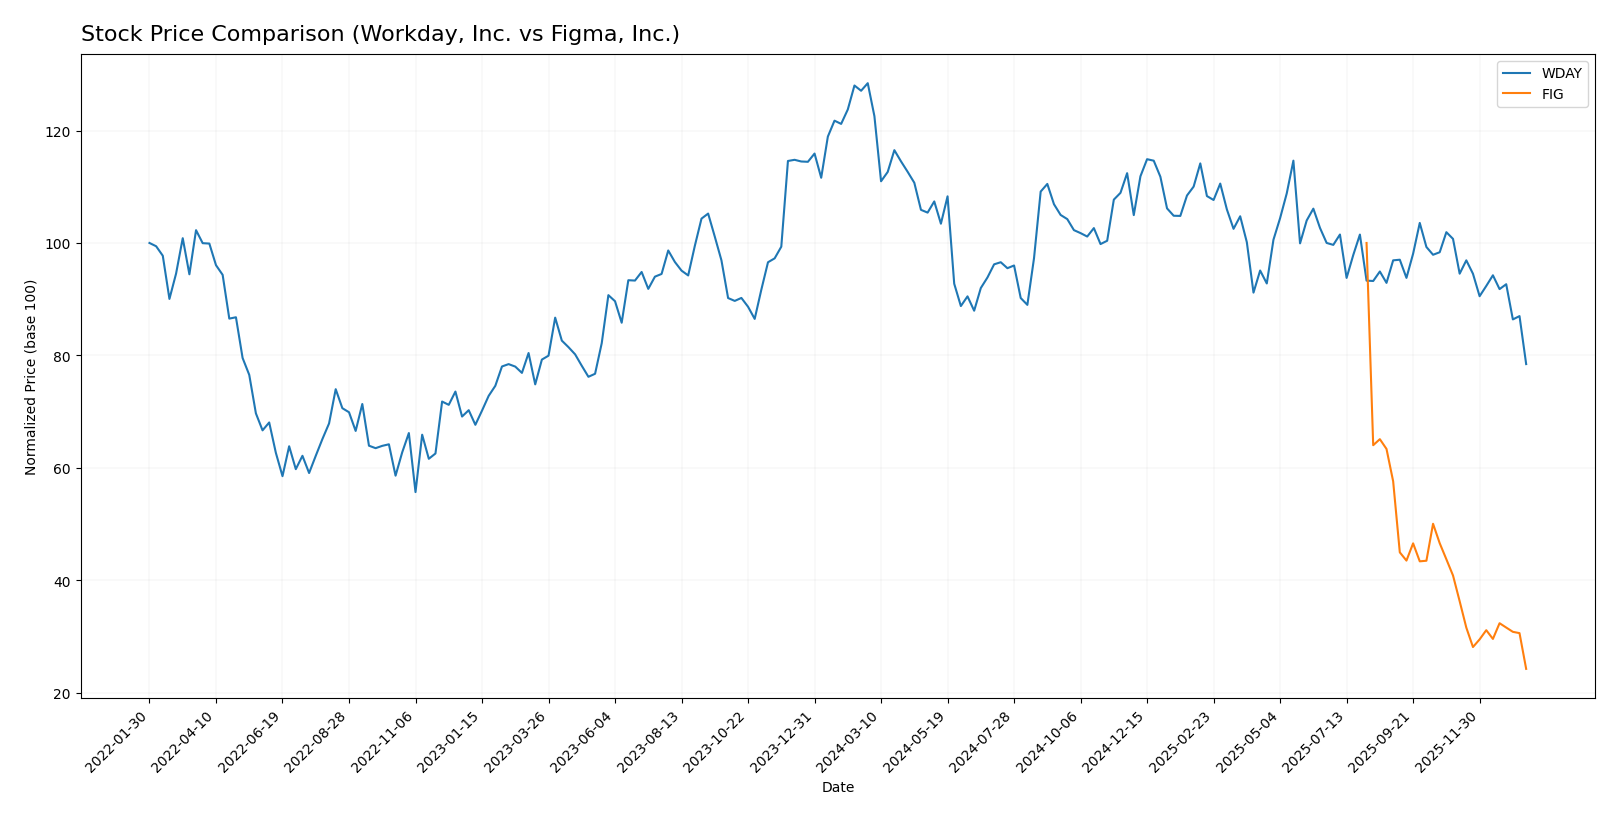
The stock price chart highlights significant bearish trends for both Workday, Inc. and Figma, Inc. over the past year, with marked price declines and shifting trading volumes indicating seller dominance.
Trend Analysis
Workday, Inc. experienced a -38.91% price change over the past 12 months, indicating a bearish trend with decelerating downward momentum. The stock ranged from a high of 305.88 to a low of 186.86, showing substantial volatility (std deviation 20.22).
Figma, Inc. showed a more pronounced bearish trend with a -75.76% price change over the same period, coupled with accelerating decline. Its price fluctuated between 122.0 and 29.57, with a high volatility level (std deviation 19.95).
Comparing both, Figma, Inc. delivered the highest market loss, significantly underperforming Workday, Inc. in terms of price depreciation over the past year.
Target Prices
The current analyst consensus reflects a generally positive outlook for both Workday, Inc. and Figma, Inc.
| Company | Target High | Target Low | Consensus |
|---|---|---|---|
| Workday, Inc. | 320 | 235 | 274.47 |
| Figma, Inc. | 52 | 38 | 43.6 |
Analysts expect Workday’s price to rise significantly from its current $186.86, with targets around $274.47 on average. Figma’s consensus target of $43.6 also suggests upside potential from its current $29.57 price.
Analyst Opinions Comparison
This section compares analysts’ ratings and grades for Workday, Inc. and Figma, Inc.:
Rating Comparison
Workday, Inc. Rating
- Rating: B- with a very favorable status
- Discounted Cash Flow Score: 4, favorable
- ROE Score: 3, moderate
- ROA Score: 3, moderate
- Debt To Equity Score: 2, moderate
- Overall Score: 2, moderate
Figma, Inc. Rating
- Rating: C+ with a very favorable status
- Discounted Cash Flow Score: 4, favorable
- ROE Score: 1, very unfavorable
- ROA Score: 1, very unfavorable
- Debt To Equity Score: 4, favorable
- Overall Score: 2, moderate
Which one is the best rated?
Workday holds a higher rating (B-) than Figma (C+), with better ROE and ROA scores, while Figma shows a stronger Debt To Equity score. Overall, both have moderate overall scores of 2.
Scores Comparison
The scores comparison between Workday, Inc. and Figma, Inc. is as follows:
WDAY Scores
- Altman Z-Score: 4.41, indicating a safe zone for bankruptcy risk.
- Piotroski Score: 6, representing average financial strength.
FIG Scores
- Altman Z-Score: 14.34, indicating a safe zone for bankruptcy risk.
- Piotroski Score: 4, representing average financial strength.
Which company has the best scores?
Figma has a significantly higher Altman Z-Score than Workday, indicating stronger bankruptcy safety. Workday holds a higher Piotroski Score, suggesting relatively better financial strength. Both companies fall into the safe zone and average financial health categories.
Grades Comparison
Here is a summary of the latest available grades from recognized financial institutions for both companies:
Workday, Inc. Grades
The table below shows recent grades and actions from reputable grading companies for Workday, Inc.:
| Grading Company | Action | New Grade | Date |
|---|---|---|---|
| Barclays | Maintain | Overweight | 2026-01-12 |
| RBC Capital | Maintain | Outperform | 2026-01-05 |
| TD Cowen | Maintain | Buy | 2025-11-26 |
| DA Davidson | Maintain | Neutral | 2025-11-26 |
| Wells Fargo | Maintain | Overweight | 2025-11-26 |
| Barclays | Maintain | Overweight | 2025-11-26 |
| Keybanc | Maintain | Overweight | 2025-11-26 |
| Citigroup | Maintain | Neutral | 2025-11-26 |
| JP Morgan | Maintain | Overweight | 2025-11-26 |
| UBS | Maintain | Neutral | 2025-11-26 |
Workday’s grades consistently show a positive outlook with multiple “Overweight,” “Outperform,” and “Buy” recommendations, and very few neutral ratings.
Figma, Inc. Grades
Below are the recent grades and actions from recognized grading companies for Figma, Inc.:
| Grading Company | Action | New Grade | Date |
|---|---|---|---|
| Morgan Stanley | Maintain | Equal Weight | 2026-01-15 |
| Wells Fargo | Upgrade | Overweight | 2026-01-08 |
| RBC Capital | Maintain | Sector Perform | 2026-01-05 |
| Goldman Sachs | Maintain | Neutral | 2025-11-07 |
| JP Morgan | Maintain | Neutral | 2025-11-06 |
| Piper Sandler | Maintain | Overweight | 2025-11-06 |
| Wells Fargo | Maintain | Equal Weight | 2025-11-05 |
| Wells Fargo | Maintain | Equal Weight | 2025-09-04 |
| Morgan Stanley | Maintain | Equal Weight | 2025-09-04 |
| RBC Capital | Maintain | Sector Perform | 2025-09-04 |
Figma’s grades mainly range from “Equal Weight” to “Overweight,” with several neutral or sector perform ratings, indicating a more cautious and balanced market outlook.
Which company has the best grades?
Workday, Inc. has received generally stronger grades with a clear consensus leaning toward “Buy” and “Outperform” ratings, while Figma, Inc. holds mostly “Hold” to “Equal Weight” grades. This difference may influence investors seeking more confident growth prospects in Workday compared to a more moderate stance on Figma.
Strengths and Weaknesses
Below is a comparison table highlighting the key strengths and weaknesses of Workday, Inc. (WDAY) and Figma, Inc. (FIG) based on their latest financial and operational data.
| Criterion | Workday, Inc. (WDAY) | Figma, Inc. (FIG) |
|---|---|---|
| Diversification | Moderate: Revenue mainly from subscription services ($7.7B in 2025) with additional professional services ($728M) | Low: Primarily focused on design software, limited diversification |
| Profitability | Neutral to slightly unfavorable: Net margin at 6.23%, ROIC below WACC but improving | Unfavorable: Negative net margin (-97.74%) and declining ROIC |
| Innovation | Moderate: Growing ROIC trend suggests improving competitive advantage | Weak: Declining ROIC and profitability indicate challenges in innovation monetization |
| Global presence | Strong: Established SaaS provider with global customer base | Developing: Smaller scale and shorter operating history |
| Market Share | Substantial in enterprise HCM software | Niche player in design software with limited scale |
Key takeaways: Workday shows stable revenue growth and improving profitability trends, though value creation remains slightly unfavorable. Figma struggles with significant losses and declining returns, indicating higher risk. Investors should weigh Workday’s moderate strengths against Figma’s current financial challenges.
Risk Analysis
Below is a comparative risk assessment table for Workday, Inc. (WDAY) and Figma, Inc. (FIG) based on the most recent data from 2025 and 2024 respectively.
| Metric | Workday, Inc. (WDAY) | Figma, Inc. (FIG) |
|---|---|---|
| Market Risk | Moderate (Beta 1.14) | High volatility (Beta -3.80) |
| Debt level | Low (D/E 0.37, favorable) | Very low (D/E 0.02, favorable) |
| Regulatory Risk | Medium (Technology sector) | Medium (Technology sector) |
| Operational Risk | Moderate (20,482 employees, mature) | Higher (1,646 employees, younger company) |
| Environmental Risk | Low | Low |
| Geopolitical Risk | Moderate (US exposure) | Moderate (US exposure) |
Workday shows moderate market risk with stable debt levels and operational scale, while Figma faces higher market volatility and operational risk due to its recent IPO and smaller size. Both companies have manageable regulatory and geopolitical risks in the US tech sector. Investors should weigh Figma’s high volatility against Workday’s more stable profile.
Which Stock to Choose?
Workday, Inc. (WDAY) shows a favorable income statement with 16.35% revenue growth in 2025 and overall 95.6% growth since 2021. Its financial ratios are mixed, with 42.86% favorable and unfavorable each, profitability is modest, debt levels are manageable, and it holds a very favorable B- rating.
Figma, Inc. (FIG) experienced 48.36% revenue growth in 2024 but faces unfavorable income trends overall, with net margin deeply negative. Financial ratios are predominantly unfavorable at 57.14%, profitability is negative, debt is very low, and it carries a very favorable C+ rating despite challenges.
Investors seeking growth with improving profitability might view Workday’s stronger income and stable rating as more favorable, while those tolerant of higher risk and focused on potential turnaround could consider Figma’s profile, given its low debt and growth despite negative margins.
Disclaimer: Investment carries a risk of loss of initial capital. The past performance is not a reliable indicator of future results. Be sure to understand risks before making an investment decision.
Go Further
I encourage you to read the complete analyses of Workday, Inc. and Figma, Inc. to enhance your investment decisions: