In the dynamic world of technology, Uber Technologies, Inc. and Figma, Inc. represent two innovative leaders shaping distinct yet overlapping markets. Uber revolutionizes mobility and delivery services worldwide, while Figma transforms collaborative design with its cutting-edge browser-based tools. Both companies drive growth through innovation, making them compelling options for investors seeking exposure to high-potential tech stocks. This article will help you decide which company holds the most promise for your investment portfolio.
Table of contents
Companies Overview
I will begin the comparison between Uber Technologies, Inc. and Figma, Inc. by providing an overview of these two companies and their main differences.
Uber Overview
Uber Technologies, Inc. operates proprietary technology platforms connecting consumers with independent providers of ride services, delivery, and freight. The company serves multiple global regions including the US, Latin America, Europe, and Asia Pacific. Its three main segments are Mobility, Delivery, and Freight, offering a range of transportation, delivery, and logistics solutions. Uber is headquartered in San Francisco and employs over 31K people.
Figma Overview
Figma, Inc. develops a browser-based collaborative design platform targeted at design and development teams. Its offerings include tools for design, prototyping, presentation, and AI-assisted product development. Founded in 2012 and also based in San Francisco, Figma employs around 1.6K people and focuses exclusively on software applications for user interface design and team collaboration.
Key similarities and differences
Both Uber and Figma are US-based technology companies listed on the NYSE and operate in the software application industry. However, Uber’s business model centers on connecting independent service providers with consumers across mobility, delivery, and freight logistics, while Figma provides a SaaS platform focused on design collaboration and product development. Uber has a significantly larger market capitalization and workforce compared to Figma, reflecting their differing scales and service domains.
Income Statement Comparison
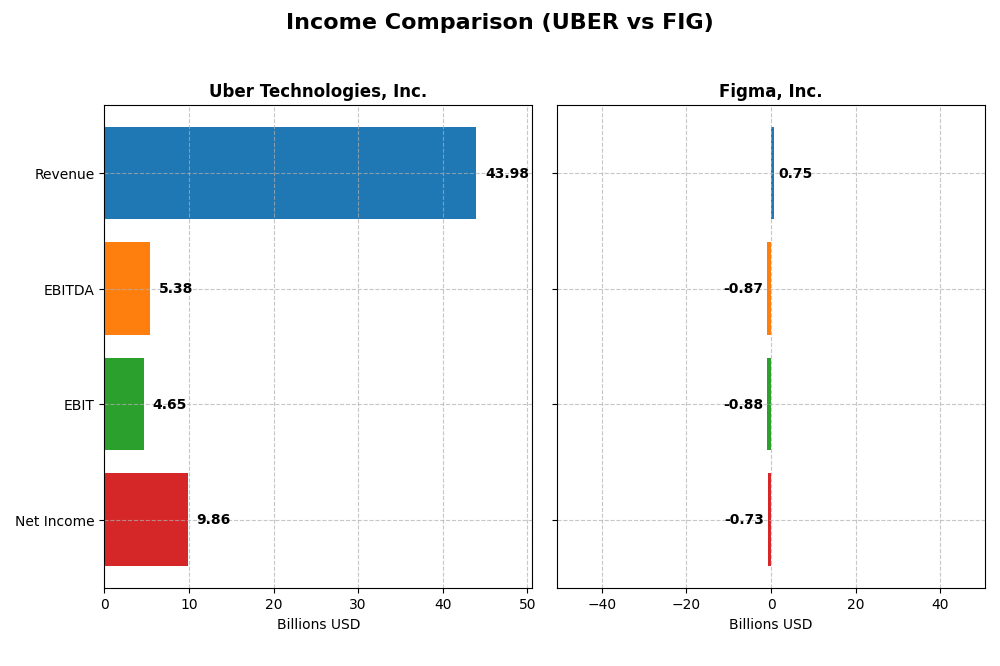
This table presents a side-by-side comparison of key income statement metrics for Uber Technologies, Inc. and Figma, Inc. for the fiscal year 2024, providing a snapshot of their financial performance.
| Metric | Uber Technologies, Inc. | Figma, Inc. |
|---|---|---|
| Market Cap | 176.3B | 14.4B |
| Revenue | 43.98B | 749M |
| EBITDA | 5.39B | -870M |
| EBIT | 4.65B | -877M |
| Net Income | 9.86B | -732M |
| EPS | 4.71 | -3.11 |
| Fiscal Year | 2024 | 2024 |
Income Statement Interpretations
Uber Technologies, Inc.
Uber’s revenue rose significantly from $11.1B in 2020 to $43.98B in 2024, with net income reversing from a $6.75B loss in 2020 to a $9.86B profit in 2024. Margins improved markedly, with gross margin at 39.4% and net margin at 22.41% in 2024. The latest year showed strong growth, with revenue up 18% and net margin expanding substantially, reflecting operational efficiency gains.
Figma, Inc.
Figma’s revenue grew from $505M in 2023 to $749M in 2024, a 48% increase, but net income declined to a $732M loss in 2024 from a $286M profit in 2023. Gross margin remained high at 88.3%, yet EBIT and net margins deteriorated sharply, with EBIT margin at -117% and net margin at -97.7%. The latest year showed strong top-line growth but worsening profitability due to rising expenses.
Which one has the stronger fundamentals?
Uber demonstrates stronger fundamentals with consistent revenue growth, margin improvements, and a transition to profitability. Its income statement indicators are fully favorable, supporting sustainable performance. In contrast, Figma, despite rapid revenue growth and high gross margin, faces challenges with significant losses and unfavorable EBIT and net margin trends, indicating weaker income statement fundamentals.
Financial Ratios Comparison
The table below compares key financial ratios for Uber Technologies, Inc. and Figma, Inc. based on their most recent fiscal year data for 2024.
| Ratios | Uber Technologies, Inc. | Figma, Inc. |
|---|---|---|
| ROE | 45.7% | -55.3% |
| ROIC | 6.8% | -59.7% |
| P/E | 12.8 | -70.7 |
| P/B | 5.86 | 39.1 |
| Current Ratio | 1.07 | 3.66 |
| Quick Ratio | 1.07 | 3.66 |
| D/E | 0.53 | 0.02 |
| Debt-to-Assets | 22.3% | 1.6% |
| Interest Coverage | 5.35 | 0 |
| Asset Turnover | 0.86 | 0.42 |
| Fixed Asset Turnover | 14.1 | 17.1 |
| Payout ratio | 0 | 0 |
| Dividend yield | 0 | 0 |
Interpretation of the Ratios
Uber Technologies, Inc.
Uber’s financial ratios show a balanced profile with half of the key metrics rated favorable, including strong net margin (22.41%) and return on equity (45.72%), while some ratios like price-to-book (5.86) are less favorable. Liquidity and leverage ratios are generally stable, reflecting moderate risk. Uber does not pay dividends, focusing instead on reinvestment and growth, with no dividend yield.
Figma, Inc.
Figma’s ratios predominantly signal challenges, with unfavorable results in net margin (-97.74%), return on equity (-55.29%), and asset turnover (0.42), indicating operational and profitability struggles. However, low debt levels and a low debt-to-assets ratio offer some financial stability. Figma also does not pay dividends, likely prioritizing R&D and growth at this stage.
Which one has the best ratios?
Uber exhibits a more favorable ratio profile overall, with significant strengths in profitability and coverage metrics, while Figma faces multiple unfavorable indicators related to profitability and efficiency. Despite some neutral ratings for Uber, its financial health appears stronger compared to Figma’s predominantly unfavorable assessments.
Strategic Positioning
This section compares the strategic positioning of Uber Technologies, Inc. and Figma, Inc. regarding market position, key segments, and exposure to technological disruption:
Uber Technologies, Inc.
- Leading global mobility and delivery platform facing competitive pressure in multiple regions.
- Diversified business with Mobility, Delivery, and Freight segments driving revenue growth.
- Moderate exposure through technology-driven logistics and platform innovation.
Figma, Inc.
- Emerging player in collaborative design software with growing market presence.
- Concentrated on browser-based collaborative design and prototyping tools.
- High exposure to technological disruption with AI and collaborative design tools.
Uber Technologies, Inc. vs Figma, Inc. Positioning
Uber pursues a diversified approach across mobility, delivery, and freight, offering broad market coverage. Figma focuses on a concentrated niche in design software, leveraging AI-powered collaboration tools. Uber benefits from multiple revenue streams; Figma faces risks tied to rapid tech evolution.
Which has the best competitive advantage?
Uber shows a slightly unfavorable moat with growing profitability but still shedding value. Figma’s moat is very unfavorable, with declining profitability and value destruction, indicating Uber currently maintains a relatively stronger competitive advantage.
Stock Comparison
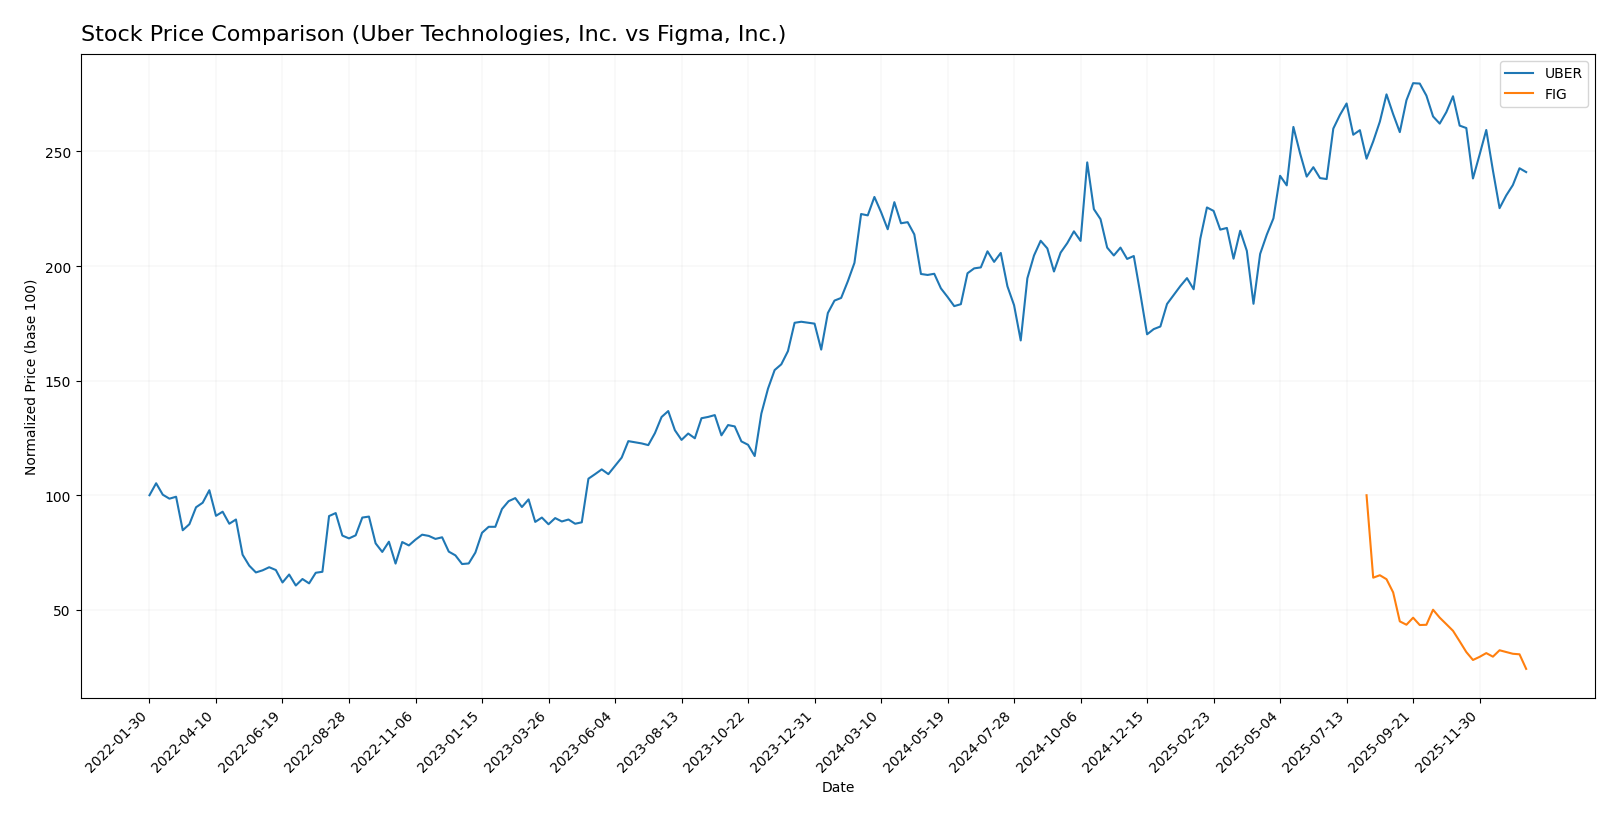
The past year showcased divergent trajectories for Uber Technologies, Inc. and Figma, Inc., with Uber exhibiting moderate gains despite recent downturns, while Figma faced a steep decline accelerating over the period.
Trend Analysis
Uber Technologies, Inc. experienced a bullish trend over the past 12 months with an 8.5% price increase, albeit with decelerating momentum. The stock ranged between 58.99 and 98.51, showing notable volatility with a 10.29 standard deviation.
Figma, Inc. displayed a bearish trend over the same period, with a significant 75.76% price drop and accelerating downward momentum. The stock fluctuated between 29.57 and 122.0, reflecting high volatility with a 19.95 standard deviation.
Comparing both, Uber delivered the highest market performance with positive overall returns, whereas Figma’s stock suffered substantial losses and accelerated declines.
Target Prices
Analysts present a mixed but generally optimistic target consensus for Uber Technologies, Inc. and Figma, Inc.
| Company | Target High | Target Low | Consensus |
|---|---|---|---|
| Uber Technologies, Inc. | 140 | 73 | 111.26 |
| Figma, Inc. | 52 | 38 | 43.6 |
For Uber, the consensus target price of 111.26 USD is significantly above the current price of 84.85 USD, suggesting upside potential. Figma’s target consensus of 43.6 USD is well above its current trading price of 29.57 USD, indicating notable expected growth.
Analyst Opinions Comparison
This section compares analysts’ ratings and grades for Uber Technologies, Inc. and Figma, Inc.:
Rating Comparison
Uber Rating
- Rating: B, considered Very Favorable by analysts.
- Discounted Cash Flow Score: 1, rated Very Unfavorable.
- ROE Score: 5, rated Very Favorable for profitability.
- ROA Score: 5, rated Very Favorable for asset utilization.
- Debt To Equity Score: 2, rated Moderate financial risk.
- Overall Score: 3, rated Moderate overall financial standing.
Figma Rating
- Rating: C+, also considered Very Favorable by analysts.
- Discounted Cash Flow Score: 4, rated Favorable.
- ROE Score: 1, rated Very Unfavorable for profitability.
- ROA Score: 1, rated Very Unfavorable for asset utilization.
- Debt To Equity Score: 4, rated Favorable financial risk.
- Overall Score: 2, rated Moderate overall financial standing.
Which one is the best rated?
Based on the provided data, Uber holds a higher overall rating (B) and stronger scores in ROE and ROA compared to Figma. However, Figma scores better on discounted cash flow and debt to equity. Overall, Uber is better rated in most key metrics.
Scores Comparison
Here is a comparison of Uber and Figma’s financial scores based on Altman Z-Score and Piotroski Score:
Uber Scores
- Altman Z-Score of 4.44 indicates Uber is in the safe zone, low bankruptcy risk.
- Piotroski Score of 6 reflects average financial strength for Uber.
Figma Scores
- Altman Z-Score of 14.34 places Figma well within the safe zone, very low bankruptcy risk.
- Piotroski Score of 4 indicates average financial strength for Figma.
Which company has the best scores?
Figma has a notably higher Altman Z-Score than Uber, suggesting stronger financial stability. However, Uber has a higher Piotroski Score, indicating comparatively better financial strength based on profitability and efficiency metrics.
Grades Comparison
The following is a detailed comparison of the most recent grades assigned to Uber Technologies, Inc. and Figma, Inc.:
Uber Technologies, Inc. Grades
This table summarizes the latest grades and rating actions from reputable financial institutions for Uber Technologies, Inc.
| Grading Company | Action | New Grade | Date |
|---|---|---|---|
| BTIG | Maintain | Buy | 2026-01-15 |
| Wells Fargo | Maintain | Overweight | 2026-01-08 |
| Cantor Fitzgerald | Maintain | Overweight | 2026-01-08 |
| Wolfe Research | Maintain | Outperform | 2026-01-06 |
| Wedbush | Maintain | Neutral | 2025-12-19 |
| Morgan Stanley | Maintain | Overweight | 2025-12-08 |
| Arete Research | Upgrade | Buy | 2025-12-03 |
| Wells Fargo | Maintain | Overweight | 2025-11-05 |
| Guggenheim | Maintain | Buy | 2025-11-05 |
| DA Davidson | Maintain | Buy | 2025-11-05 |
Uber’s grades show a strong and consistent positive trend with multiple Buy and Overweight ratings, suggesting a favorable outlook from major analysts.
Figma, Inc. Grades
This table details the recent grades and rating changes from recognized financial firms for Figma, Inc.
| Grading Company | Action | New Grade | Date |
|---|---|---|---|
| Morgan Stanley | Maintain | Equal Weight | 2026-01-15 |
| Wells Fargo | Upgrade | Overweight | 2026-01-08 |
| RBC Capital | Maintain | Sector Perform | 2026-01-05 |
| Goldman Sachs | Maintain | Neutral | 2025-11-07 |
| JP Morgan | Maintain | Neutral | 2025-11-06 |
| Piper Sandler | Maintain | Overweight | 2025-11-06 |
| Wells Fargo | Maintain | Equal Weight | 2025-11-05 |
| Wells Fargo | Maintain | Equal Weight | 2025-09-04 |
| Morgan Stanley | Maintain | Equal Weight | 2025-09-04 |
| RBC Capital | Maintain | Sector Perform | 2025-09-04 |
Figma’s ratings are generally balanced, with several Equal Weight or Neutral grades, indicating a more cautious analyst stance with some recent positive movement.
Which company has the best grades?
Uber Technologies, Inc. holds a stronger rating profile with a clear majority of Buy and Overweight grades compared to Figma, Inc.’s more mixed Equal Weight and Neutral consensus. This difference may influence investors by suggesting Uber currently enjoys higher analyst confidence and perceived growth potential.
Strengths and Weaknesses
Below is a comparative table summarizing the key strengths and weaknesses of Uber Technologies, Inc. and Figma, Inc., based on the most recent financial and operational data available.
| Criterion | Uber Technologies, Inc. | Figma, Inc. |
|---|---|---|
| Diversification | Strong: revenues from Delivery (13.75B), Mobility (25.09B), Freight (5.14B) | Limited: single product focus on design software |
| Profitability | Favorable net margin (22.41%), ROE (45.72%), but ROIC slightly below WACC | Unfavorable net margin (-97.74%), ROE (-55.29%), ROIC well below WACC |
| Innovation | Moderate: expanding mobility and freight services, technology programs | High: recognized innovator in collaborative design tools |
| Global presence | Extensive: operations in numerous countries with strong market penetration | Growing but limited compared to Uber’s scale |
| Market Share | Large and established in ride-sharing and delivery markets | Niche leader in design platform but smaller scale |
Key takeaways: Uber demonstrates strong diversification and solid profitability metrics despite a slightly unfavorable economic moat, supported by growing ROIC trends. Figma, while innovative in its niche, faces significant profitability challenges with declining returns and a very unfavorable moat status, suggesting higher investment risk.
Risk Analysis
Below is a comparison of key risks for Uber Technologies, Inc. and Figma, Inc. based on the most recent data from 2024 and 2025.
| Metric | Uber Technologies, Inc. | Figma, Inc. |
|---|---|---|
| Market Risk | Beta 1.20 (moderate volatility) | Beta -3.80 (highly volatile, unusual negative beta) |
| Debt Level | Debt-to-Equity 0.53 (moderate) | Debt-to-Equity 0.02 (very low) |
| Regulatory Risk | Moderate (global ride-sharing regulations) | Moderate (data privacy and software compliance) |
| Operational Risk | Moderate (global operations, driver network) | Moderate (new IPO, scaling challenges) |
| Environmental Risk | Moderate (fleet emissions and sustainability pressures) | Low (digital product, minimal direct environmental impact) |
| Geopolitical Risk | Moderate (international markets exposure) | Low (primarily US-focused) |
Uber faces its most impactful risks from market volatility and regulatory challenges globally, with a moderate debt level supporting financial flexibility. Figma, as a recently public software company, shows high market risk due to its unusual beta and carries operational risks linked to rapid scaling and unprofitable margins. Both companies remain in a safe zone regarding bankruptcy risk, but Figma’s financials are less stable, requiring cautious risk management.
Which Stock to Choose?
Uber Technologies, Inc. has shown strong income growth with a 295% revenue increase over five years, favorable net margin of 22.41%, and high return on equity at 45.72%. Its debt levels are moderate, with a net debt to EBITDA of 0.93, and it holds a very favorable overall rating.
Figma, Inc. displays significant revenue growth of 48.36% year-on-year but suffers from unfavorable profitability metrics, including a net margin of -97.74% and negative returns on equity and invested capital. Its debt is low, and it has a very favorable rating despite these challenges.
Investors seeking growth with improving profitability might view Uber’s solid income and financial ratios as attractive, while those with tolerance for risk and focus on rapid expansion could interpret Figma’s high revenue growth and low debt as potential, despite current losses and unfavorable profitability.
Disclaimer: Investment carries a risk of loss of initial capital. The past performance is not a reliable indicator of future results. Be sure to understand risks before making an investment decision.
Go Further
I encourage you to read the complete analyses of Uber Technologies, Inc. and Figma, Inc. to enhance your investment decisions: