In today’s fast-evolving technology landscape, Tyler Technologies, Inc. (TYL) and Figma, Inc. (FIG) stand out as influential players in the software application industry. Tyler focuses on integrated public sector management solutions, while Figma leads in collaborative design tools for product development. Their innovation strategies and market approaches offer unique investment opportunities. In this article, I will help you decide which company holds the most promise for your portfolio.
Table of contents
Companies Overview
I will begin the comparison between Tyler Technologies, Inc. and Figma, Inc. by providing an overview of these two companies and their main differences.
Tyler Technologies Overview
Tyler Technologies, Inc. provides integrated information management solutions and services tailored for the public sector. Its offerings cover enterprise software, appraisal and tax systems, and NIC services. The company supports a broad range of government functions, including financial management, judicial solutions, public safety, and student information systems. Founded in 1966 and headquartered in Plano, Texas, Tyler serves a niche market with a focus on automating government operations.
Figma Overview
Figma, Inc. develops a browser-based collaborative design platform aimed at design and development teams. Its suite includes tools for UI design, prototyping, code inspection, presentations, and AI-powered design assistance. Incorporated in 2012 and based in San Francisco, California, Figma focuses on streamlining the product development lifecycle through real-time collaboration and design innovation in the technology sector.
Key similarities and differences
Both Tyler Technologies and Figma operate in the software application industry with a focus on specialized solutions. Tyler targets public sector agencies with comprehensive management systems, while Figma serves creative and development teams with design and prototyping tools. Tyler’s business model emphasizes government process automation, whereas Figma prioritizes collaborative design workflows and product development efficiency. Their markets and customer bases differ significantly despite operating under the broader technology sector.
Income Statement Comparison
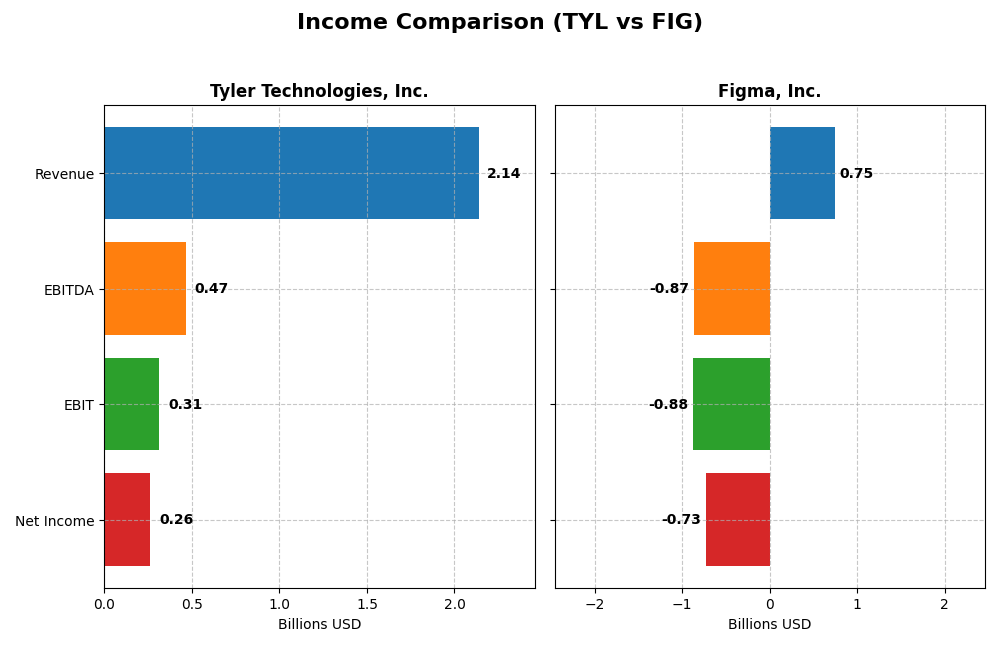
This table presents a side-by-side comparison of key income statement metrics for Tyler Technologies, Inc. and Figma, Inc. for the fiscal year 2024.
| Metric | Tyler Technologies, Inc. (TYL) | Figma, Inc. (FIG) |
|---|---|---|
| Market Cap | 18.9B | 14.4B |
| Revenue | 2.14B | 749M |
| EBITDA | 466M | -870M |
| EBIT | 314M | -877M |
| Net Income | 263M | -732M |
| EPS | 6.17 | -3.11 |
| Fiscal Year | 2024 | 2024 |
Income Statement Interpretations
Tyler Technologies, Inc.
Tyler Technologies exhibited strong revenue growth from 2020 to 2024, reaching $2.14B in 2024 with a 9.53% increase from the previous year. Net income rose steadily to $263M in 2024, though net margin slightly declined overall. The company improved its EBIT margin to 14.69% in 2024, reflecting operational efficiency gains and solid profitability despite a minor margin contraction over the long term.
Figma, Inc.
Figma’s revenue grew rapidly by 48.36% from 2023 to 2024, hitting $749M. However, net income remained deeply negative at -$732M in 2024, worsening from the prior year. Despite a high gross margin of 88.32%, the company faced significant operating losses, with EBIT margin at -117.15% and net margin at -97.74%. Expense growth outpaced revenue, indicating ongoing investment and operational challenges.
Which one has the stronger fundamentals?
Tyler Technologies shows favorable fundamentals, with consistent revenue and net income growth, positive margins, and controlled interest expenses. Figma, while growing its top line quickly, struggles with substantial losses and unfavorable profitability metrics. Overall, Tyler Technologies demonstrates more stable and efficient income statement performance compared to Figma’s heavily negative earnings and margins.
Financial Ratios Comparison
The table below presents a side-by-side comparison of key financial ratios for Tyler Technologies, Inc. (TYL) and Figma, Inc. (FIG) based on their most recent fiscal year data from 2024.
| Ratios | Tyler Technologies, Inc. (TYL) | Figma, Inc. (FIG) |
|---|---|---|
| ROE | 7.76% | -55.29% |
| ROIC | 6.20% | -59.68% |
| P/E | 93.42 | -70.71 |
| P/B | 7.25 | 39.10 |
| Current Ratio | 1.35 | 3.66 |
| Quick Ratio | 1.35 | 3.66 |
| D/E (Debt-to-Equity) | 0.19 | 0.02 |
| Debt-to-Assets | 12.32% | 1.60% |
| Interest Coverage | 50.50 | 0 |
| Asset Turnover | 0.41 | 0.42 |
| Fixed Asset Turnover | 10.95 | 17.09 |
| Payout Ratio | 0 | 0 |
| Dividend Yield | 0% | 0% |
Interpretation of the Ratios
Tyler Technologies, Inc.
Tyler Technologies shows a mixed picture with 50% favorable and 35.7% unfavorable ratios. Net margin at 12.3% and interest coverage of 52.96 indicate solid profitability and debt service ability, yet return on equity at 7.76% and price-to-earnings of 93.42 raise concerns on efficiency and valuation. The company does not pay dividends, likely prioritizing reinvestment given zero dividend yield.
Figma, Inc.
Figma’s ratios are mostly unfavorable with 57.14% negative indicators, reflecting high losses and inefficiencies: net margin at -97.74%, return on equity at -55.29%, and interest coverage at zero. Despite a low debt level and a favorable weighted average cost of capital, the company does not pay dividends, consistent with its negative earnings and focus on growth and R&D.
Which one has the best ratios?
Tyler Technologies exhibits a slightly favorable overall ratio profile, balancing strong profitability and manageable debt against some valuation and efficiency concerns. Figma’s financial ratios are predominantly unfavorable, reflecting ongoing losses and operational challenges. Based solely on ratio evaluations, Tyler Technologies presents a more stable financial position relative to Figma.
Strategic Positioning
This section compares the strategic positioning of Tyler Technologies and Figma, focusing on Market position, Key segments, and Exposure to technological disruption:
Tyler Technologies, Inc.
- Established market player serving public sector software needs with moderate competitive pressure.
- Diverse segments including enterprise software, appraisal and tax, SaaS, and public sector solutions.
- Strategic AWS collaboration for cloud hosting reduces disruption risks but remains software-dependent.
Figma, Inc.
- Newer entrant focused on collaborative UI design tools facing intense competitive dynamics.
- Concentrated on browser-based collaborative design and prototyping tools for development teams.
- Heavy reliance on browser-based and AI-driven design tools exposes it to rapid technological changes.
Tyler Technologies vs Figma Positioning
Tyler Technologies pursues a diversified approach across multiple public sector software segments, offering stability but exposure to government budgets. Figma concentrates on UI design innovation, enabling agility but facing higher competitive and technological disruption risks.
Which has the best competitive advantage?
Both companies show very unfavorable MOAT evaluations with declining ROIC and value destruction. Neither currently demonstrates a sustainable competitive advantage based on efficient capital use or profitability trends.
Stock Comparison
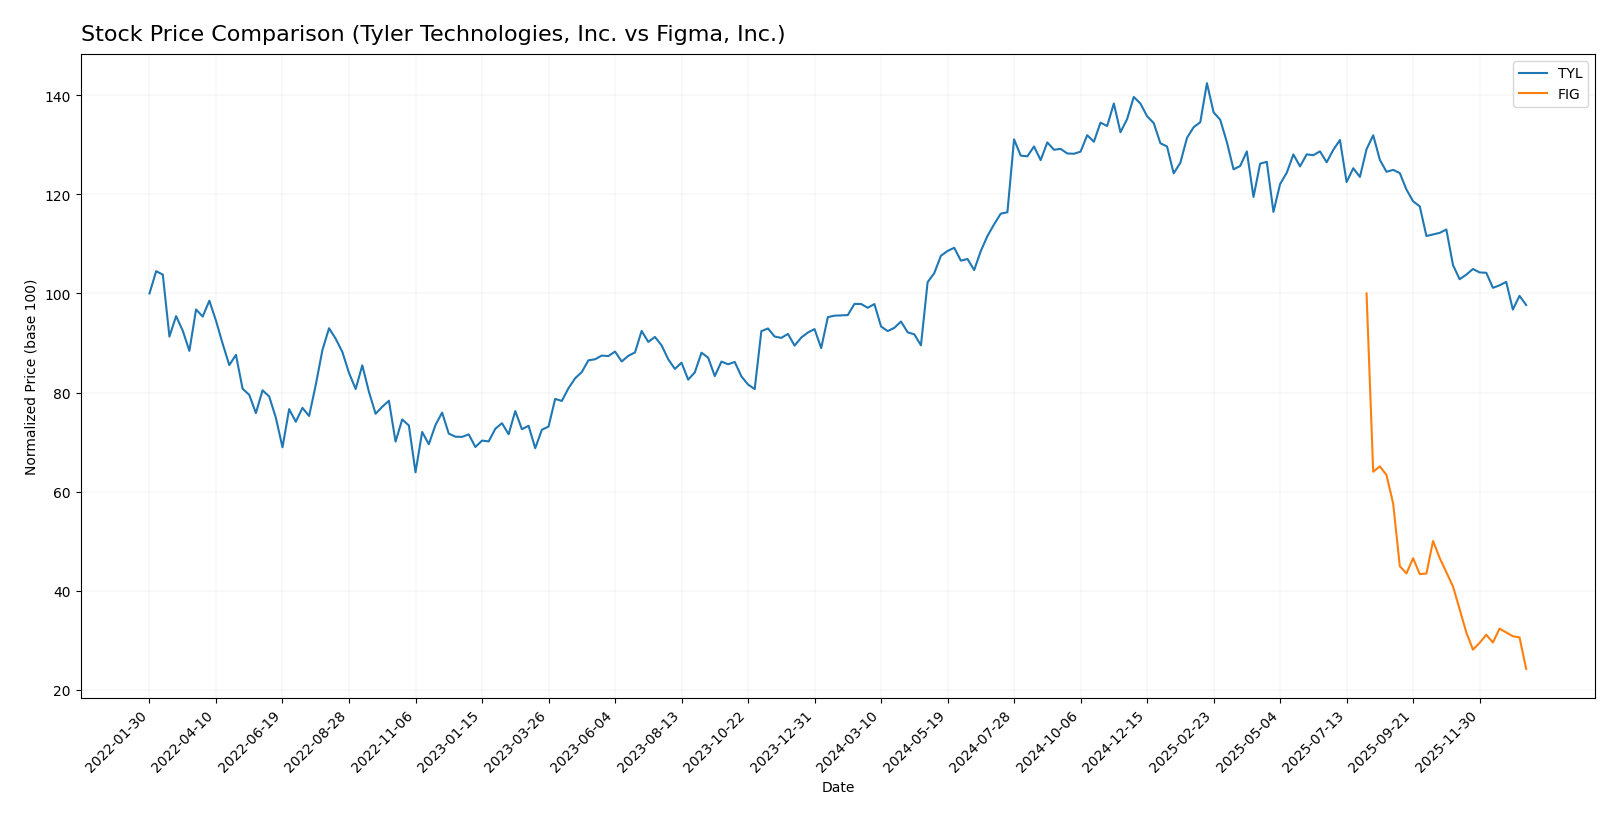
The stock prices of Tyler Technologies, Inc. (TYL) and Figma, Inc. (FIG) showed contrasting dynamics over the past 12 months, with TYL experiencing a mild bullish trend while FIG faced a steep bearish trajectory.
Trend Analysis
Tyler Technologies, Inc. (TYL) exhibited a slight bullish trend over the past year with a 0.58% price increase, accompanied by deceleration in momentum and a high volatility level indicated by a 61.82 standard deviation. The stock peaked at 641.7 and dipped to 403.35 during this period.
Figma, Inc. (FIG) displayed a pronounced bearish trend with a 75.76% price decline over the same 12-month timeframe, with accelerating downward pressure and moderate volatility (19.95 standard deviation). The stock ranged from a high of 122.0 to a low of 29.57.
Comparing the two, Tyler Technologies delivered the highest market performance with a stable slight gain, whereas Figma’s stock significantly lost value, reflecting a more severe bearish trend.
Target Prices
Analysts present a cautiously optimistic consensus for Tyler Technologies, Inc. and Figma, Inc.
| Company | Target High | Target Low | Consensus |
|---|---|---|---|
| Tyler Technologies, Inc. | 675 | 470 | 584 |
| Figma, Inc. | 52 | 38 | 43.6 |
Tyler Technologies shows a strong upside potential with consensus target prices well above the current $440.01 stock price. Figma’s consensus target at $43.6 also suggests upside from the current $29.57, despite its higher volatility indicated by beta.
Analyst Opinions Comparison
This section compares analysts’ ratings and grades for Tyler Technologies, Inc. and Figma, Inc.:
Rating Comparison
TYL Rating
- Rating: B, considered Very Favorable by analysts.
- Discounted Cash Flow Score: 4, indicating a Favorable outlook on future cash flow projections.
- ROE Score: 3, a Moderate efficiency in generating profit from shareholders’ equity.
- ROA Score: 4, Favorable use of assets to generate earnings.
- Debt To Equity Score: 3, Moderate financial risk with balanced debt levels.
- Overall Score: 3, a Moderate summary assessment of financial standing.
FIG Rating
- Rating: C+, also marked Very Favorable by analysts.
- Discounted Cash Flow Score: 4, similarly Favorable for future cash flow valuation.
- ROE Score: 1, Very Unfavorable, showing weak profit generation from equity.
- ROA Score: 1, Very Unfavorable, indicating poor asset utilization.
- Debt To Equity Score: 4, Favorable, suggesting stronger balance sheet with lower financial risk.
- Overall Score: 2, Moderate but lower than TYL’s overall score.
Which one is the best rated?
Based on the provided data, Tyler Technologies, Inc. holds a higher overall rating (B) and better scores in ROE and ROA compared to Figma, Inc., which has a lower overall rating (C+) and weaker profitability metrics despite a stronger debt-to-equity score.
Scores Comparison
Here is the comparison of the Altman Z-Score and Piotroski Score for both companies:
TYL Scores
- Altman Z-Score: 7.42, indicating a safe zone with low bankruptcy risk.
- Piotroski Score: 6, representing average financial strength.
FIG Scores
- Altman Z-Score: 14.34, indicating a safe zone with very low bankruptcy risk.
- Piotroski Score: 4, representing average financial strength.
Which company has the best scores?
FIG has a higher Altman Z-Score, suggesting stronger financial stability, while TYL has a higher Piotroski Score, indicating relatively better financial strength. Both scores reflect different aspects of financial health, with FIG stronger in bankruptcy risk assessment.
Grades Comparison
The following is a comparison of recent grades assigned to Tyler Technologies, Inc. and Figma, Inc.:
Tyler Technologies, Inc. Grades
This table summarizes the recent grades from reliable financial institutions for Tyler Technologies, Inc.:
| Grading Company | Action | New Grade | Date |
|---|---|---|---|
| Piper Sandler | Maintain | Overweight | 2026-01-13 |
| Wells Fargo | Maintain | Equal Weight | 2026-01-08 |
| DA Davidson | Maintain | Neutral | 2025-12-09 |
| Evercore ISI Group | Maintain | In Line | 2025-10-31 |
| DA Davidson | Maintain | Neutral | 2025-10-31 |
| DA Davidson | Maintain | Neutral | 2025-10-10 |
| DA Davidson | Maintain | Neutral | 2025-08-05 |
| Barclays | Maintain | Overweight | 2025-07-31 |
| Needham | Maintain | Buy | 2025-05-13 |
| Barclays | Maintain | Overweight | 2025-04-25 |
Overall, Tyler Technologies has consistently received neutral to positive grades, with several overweight and buy ratings maintained by reputable firms.
Figma, Inc. Grades
This table summarizes the recent grades from reliable financial institutions for Figma, Inc.:
| Grading Company | Action | New Grade | Date |
|---|---|---|---|
| Morgan Stanley | Maintain | Equal Weight | 2026-01-15 |
| Wells Fargo | Upgrade | Overweight | 2026-01-08 |
| RBC Capital | Maintain | Sector Perform | 2026-01-05 |
| Goldman Sachs | Maintain | Neutral | 2025-11-07 |
| JP Morgan | Maintain | Neutral | 2025-11-06 |
| Piper Sandler | Maintain | Overweight | 2025-11-06 |
| Wells Fargo | Maintain | Equal Weight | 2025-11-05 |
| Wells Fargo | Maintain | Equal Weight | 2025-09-04 |
| Morgan Stanley | Maintain | Equal Weight | 2025-09-04 |
| RBC Capital | Maintain | Sector Perform | 2025-09-04 |
Figma’s grades are mostly neutral to moderately positive, with a recent upgrade to overweight by Wells Fargo, indicating some upward momentum.
Which company has the best grades?
Tyler Technologies has a stronger consensus with more buy and overweight ratings than Figma, which mainly holds equal weight and sector perform ratings. This suggests a generally more favorable outlook for Tyler Technologies among analysts, which could influence investor sentiment accordingly.
Strengths and Weaknesses
Below is a comparison table summarizing key strengths and weaknesses of Tyler Technologies, Inc. (TYL) and Figma, Inc. (FIG) based on the most recent financial and strategic data.
| Criterion | Tyler Technologies, Inc. (TYL) | Figma, Inc. (FIG) |
|---|---|---|
| Diversification | Moderate: diverse revenue streams including SaaS, transaction fees, and professional services | Limited: mainly focused on design software platform |
| Profitability | Moderate profitability with 12.3% net margin; ROIC 6.2% near cost of capital | Negative profitability; net margin -97.7%, ROIC -59.7% |
| Innovation | Steady innovation in enterprise software and platform technologies | High innovation focus but unprofitable and declining returns |
| Global presence | Established presence mainly in North America with expanding software solutions | Primarily US-based with growing international adoption |
| Market Share | Strong in public sector enterprise software | Growing but still small market share in design software space |
Key takeaways: Tyler Technologies shows moderate profitability and a diversified revenue base but faces challenges with declining return on invested capital. Figma, while innovative and growing, currently struggles with severe losses and value destruction, signaling higher investment risk.
Risk Analysis
Below is a comparison table of key risks for Tyler Technologies, Inc. (TYL) and Figma, Inc. (FIG) based on the most recent data for 2024.
| Metric | Tyler Technologies, Inc. (TYL) | Figma, Inc. (FIG) |
|---|---|---|
| Market Risk | Moderate (Beta 0.92) | High (Beta -3.80) |
| Debt Level | Low (Debt-to-Equity 0.19) | Very Low (Debt-to-Equity 0.02) |
| Regulatory Risk | Moderate (Public sector focus) | Moderate (Tech/software sector) |
| Operational Risk | Moderate (Integrated public sector solutions) | High (Early-stage, rapid growth) |
| Environmental Risk | Low (Software industry) | Low (Software industry) |
| Geopolitical Risk | Moderate (US-based, government contracts) | Moderate (US-based, tech) |
The most significant risks are Figma’s high market volatility, indicated by an unusual negative beta of -3.80, and its unfavorable profitability metrics, signaling operational and financial instability. Tyler Technologies shows more stability with low debt and moderate market risk but faces challenges in operational efficiency. Investors should weigh Figma’s growth potential against its high risk and consider Tyler’s steadier profile for risk-averse strategies.
Which Stock to Choose?
Tyler Technologies, Inc. (TYL) shows a favorable income evolution with 9.53% revenue growth in 2024 and generally positive profitability metrics. Its financial ratios are slightly favorable overall, supported by low debt levels and strong interest coverage, though valuation multiples are high. The company carries a very favorable rating but faces a very unfavorable MOAT due to declining ROIC and value destruction.
Figma, Inc. (FIG) experienced strong revenue growth of 48.36% in 2024 but suffers from negative profitability and unfavorable income statement trends. Its financial ratios are globally unfavorable despite low debt and a good quick ratio. The rating is very favorable overall, yet the MOAT is very unfavorable, highlighting significant value destruction and declining returns.
Investors seeking growth exposure might find Figma’s rapid revenue expansion attractive despite its current profitability challenges, while those favoring more stable profitability and a balanced financial profile could view Tyler Technologies as more suitable. Both companies exhibit very unfavorable MOATs, indicating caution regarding long-term value creation.
Disclaimer: Investment carries a risk of loss of initial capital. The past performance is not a reliable indicator of future results. Be sure to understand risks before making an investment decision.
Go Further
I encourage you to read the complete analyses of Tyler Technologies, Inc. and Figma, Inc. to enhance your investment decisions: