Home > Comparison > Technology > MSTR vs FIG
The strategic rivalry between Strategy Inc and Figma, Inc. shapes the trajectory of the technology sector’s software application industry. Strategy Inc operates as a bitcoin treasury and AI analytics provider, blending capital-intensive asset management with enterprise software. Figma, Inc. focuses on collaborative, browser-based design tools with a high-margin, user-centric SaaS model. This analysis will assess which company offers superior risk-adjusted returns amid evolving digital demands for diversified portfolios.
Table of contents
Companies Overview
Strategy Inc and Figma, Inc. represent pivotal players in the software application market with distinct strategic focuses.
Strategy Inc: Bitcoin Treasury Innovator and Analytics Leader
Strategy Inc dominates as a bitcoin treasury company with a global footprint across the US, Europe, and beyond. Its revenue model blends bitcoin exposure through equity and fixed income securities alongside AI-driven enterprise analytics software. In 2025, it sharpened its focus on integrating data governance tools like Strategy Mosaic to unify insights across platforms, reinforcing its dual role in crypto finance and enterprise intelligence.
Figma, Inc.: Collaborative Interface Design Pioneer
Figma, Inc. leads as a browser-based UI design platform that fosters team collaboration in product development. Its revenue springs from subscription-based design tools including Figma Design, Dev Mode, and AI-powered Figma Make. Since its 2025 IPO, the company has prioritized expanding its all-in-one workspace, enhancing productivity by integrating design, prototyping, and presentation capabilities for creative teams.
Strategic Collision: Similarities & Divergences
Both companies operate within the software application sector but diverge sharply in business models. Strategy Inc focuses on a closed ecosystem combining cryptocurrency investments with AI analytics, while Figma embraces an open collaborative platform for design innovation. Their primary battleground is digital transformation services, yet their distinct markets create unique investment profiles—Strategy Inc appeals to crypto-savvy investors, whereas Figma targets the creative tech niche.
Income Statement Comparison
This data dissects the core profitability and scalability of both corporate engines to reveal who dominates the bottom line:
| Metric | Strategy Inc (MSTR) | Figma, Inc. (FIG) |
|---|---|---|
| Revenue | 477M | 749M |
| Cost of Revenue | 149M | 88M |
| Operating Expenses | 5.62B | 1.54B |
| Gross Profit | 328M | 661M |
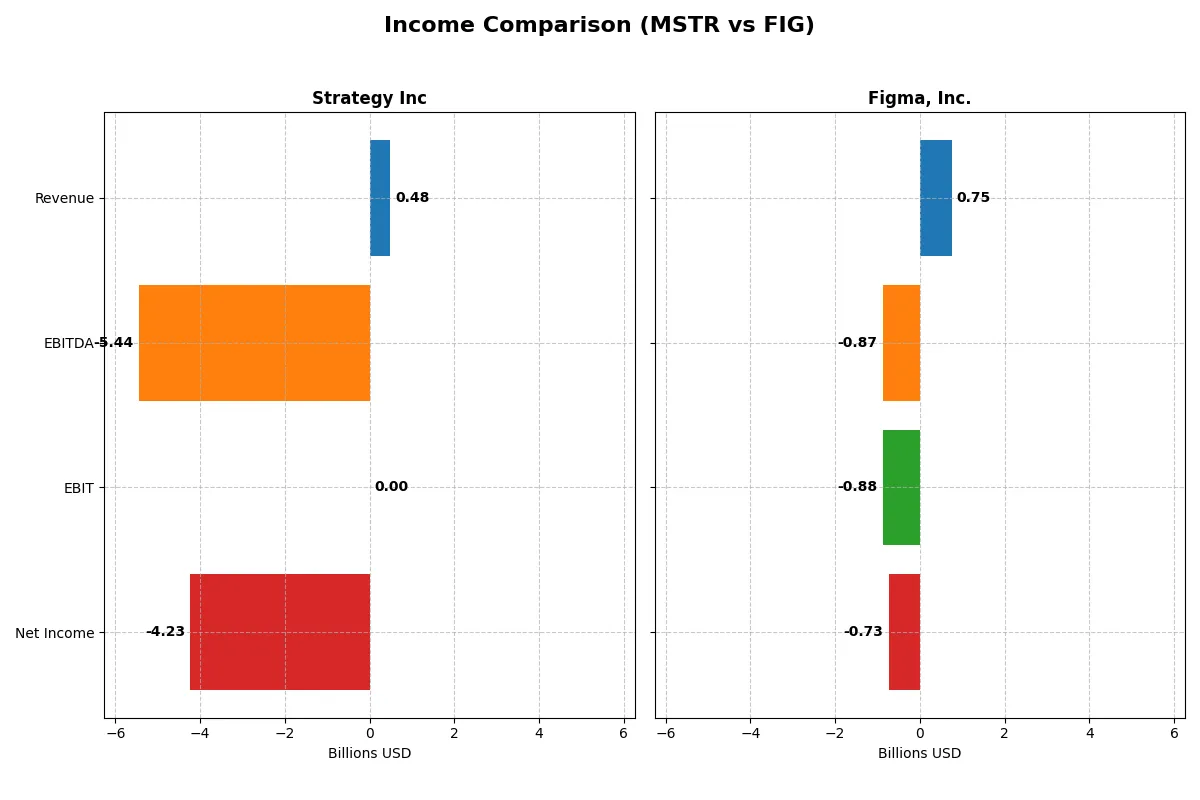
| EBITDA | -5.44B | -870M |
| EBIT | 0 | -877M |
| Interest Expense | -65M | 0 |
| Net Income | -4.23B | -732M |
| EPS | -15.23 | -3.11 |
| Fiscal Year | 2025 | 2024 |
Income Statement Analysis: The Bottom-Line Duel
This comparison reveals the true operational efficiency and profitability trends driving each company’s financial engine over recent years.
Strategy Inc Analysis
Strategy Inc’s revenue declines slightly from 510M in 2021 to 477M in 2025, while net income swings from a 535M loss in 2021 to a 4.23B loss in 2025. The gross margin remains strong near 69%, but net margins collapse deeply negative, reflecting significant operational inefficiencies and escalating expenses. The 2025 results show worsening momentum with a severe net loss despite stable revenues.
Figma, Inc. Analysis
Figma, Inc. boasts rapid revenue growth, jumping 48% from 505M in 2023 to 749M in 2024. Gross margin impresses at 88%, yet net margins remain negative near -98%, driven by heavy R&D and SG&A costs. Despite strong top-line momentum, Figma’s net income deteriorates sharply to a 732M loss in 2024, signaling persistent challenges in translating growth into profitability.
Margin Resilience vs. Growth Pressure
Strategy Inc maintains a solid gross margin but suffers from ballooning net losses and declining revenue, undermining its operational efficiency. In contrast, Figma delivers robust revenue and gross profit growth but faces mounting losses driven by aggressive spending. Strategy’s profile warns of structural issues, while Figma’s growth story carries risk from continued unprofitability. Investors must weigh margin stability against high-growth burn rates.
Financial Ratios Comparison
These vital ratios act as a diagnostic tool to expose the underlying fiscal health, valuation premiums, and capital efficiency of the companies analyzed:
| Ratios | Strategy Inc (MSTR) | Figma, Inc. (FIG) |
|---|---|---|
| ROE | -6.40% | -55.29% |
| ROIC | -4.38% | -59.68% |
| P/E | -47.8 | -70.7 |
| P/B | 3.06 | 39.10 |
| Current Ratio | 0.71 | 3.66 |
| Quick Ratio | 0.71 | 3.66 |
| D/E | 0.40 | 0.02 |
| Debt-to-Assets | 28.1% | 1.60% |
| Interest Coverage | -29.9 | 0 |
| Asset Turnover | 0.02 | 0.42 |
| Fixed Asset Turnover | 5.73 | 17.09 |
| Payout ratio | 0 | 0 |
| Dividend yield | 0 | 0 |
| Fiscal Year | 2024 | 2024 |
Efficiency & Valuation Duel: The Vital Signs
Financial ratios serve as a company’s DNA, uncovering hidden risks and operational strengths that raw numbers alone cannot reveal.
Strategy Inc
Strategy Inc shows weak profitability with negative ROE and ROIC, signaling operational challenges. Its P/E ratio appears favorable but masks underlying losses. The stock trades at a modest P/B of 3.06. The company does not pay dividends, instead reinvesting heavily in R&D, which accounts for 25.6% of revenue, aiming for future growth despite current inefficiencies.
Figma, Inc.
Figma, Inc. reports deeper losses with a severely negative ROE and ROIC, indicating strained core profitability. Its valuation is stretched, with a high P/B of 39.1 despite a favorable P/E. The company holds a strong liquidity position with a quick ratio of 3.66. Like Strategy Inc, Figma forgoes dividends, channeling funds into aggressive R&D at over 100% of revenue, reflecting a growth-focused strategy.
Valuation Stretch vs. Operational Strain
Both companies show unfavorable profitability and high operational risks, but Figma’s valuation is significantly more stretched. Strategy Inc offers a more balanced risk profile with moderate valuation and disciplined reinvestment. Investors seeking a growth play with liquidity may prefer Figma, while those cautious of valuation excess might lean toward Strategy Inc.
Which one offers the Superior Shareholder Reward?
I observe that neither Strategy Inc nor Figma, Inc. pays dividends, signaling a growth-focused distribution philosophy. Strategy Inc lacks buyback activity and posts negative free cash flow of -$115/share in 2024, reflecting heavy reinvestment or operational strains. Figma, Inc. also reports negative free cash flow of -$0.15/share, but its capital expenditure is minimal at $0.017/share, suggesting efficient reinvestment. Figma’s strong current ratio of 3.66 and low debt (debt-to-equity 0.022) contrast with Strategy’s weaker liquidity (current ratio 0.71) and higher leverage (debt-to-equity 0.40). Despite losses, Figma’s superior operating efficiency and prudent capital allocation make its growth reinvestment more sustainable. Therefore, I judge Figma, Inc. offers a more attractive total shareholder return profile in 2026.
Comparative Score Analysis: The Strategic Profile
The radar chart reveals the fundamental DNA and trade-offs of both Strategy Inc and Figma, Inc., highlighting their financial strengths and valuation nuances:
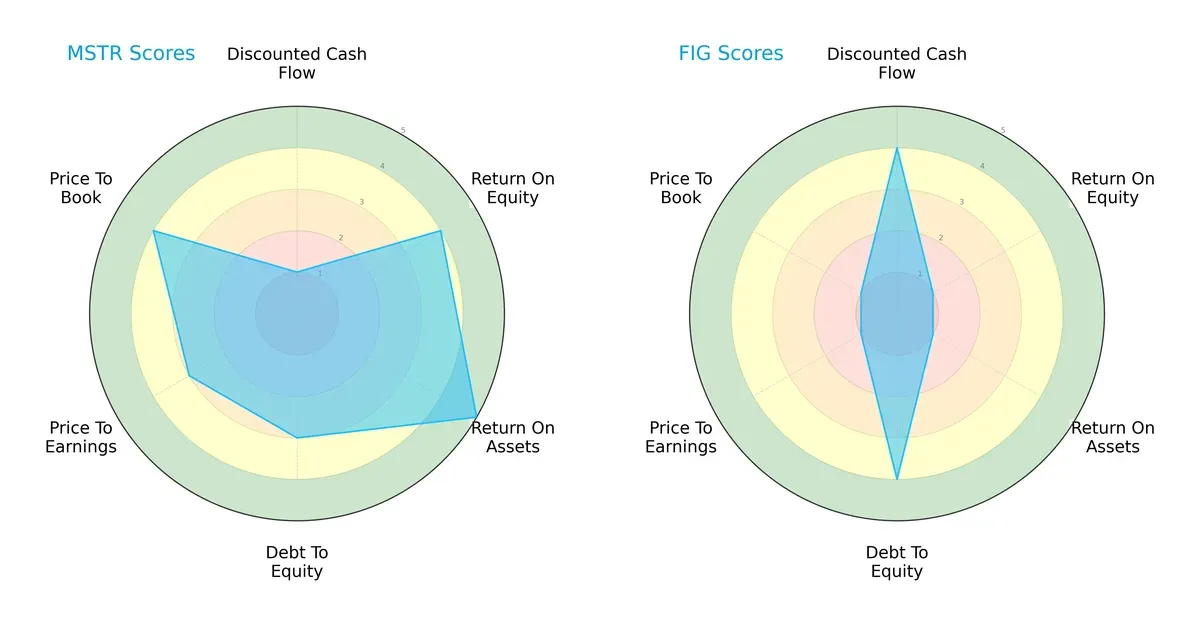
Strategy Inc displays a balanced profile with strong ROE (4) and ROA (5) scores, moderate leverage (3), and solid valuation metrics (PE 3, PB 4). Figma, Inc. relies heavily on discounted cash flow strength (4) and low leverage (4) but suffers from weak profitability (ROE 1, ROA 1) and poor valuation scores (PE 1, PB 1). Strategy Inc’s diverse strengths suggest a resilient model, whereas Figma depends on growth expectations amid operational challenges.
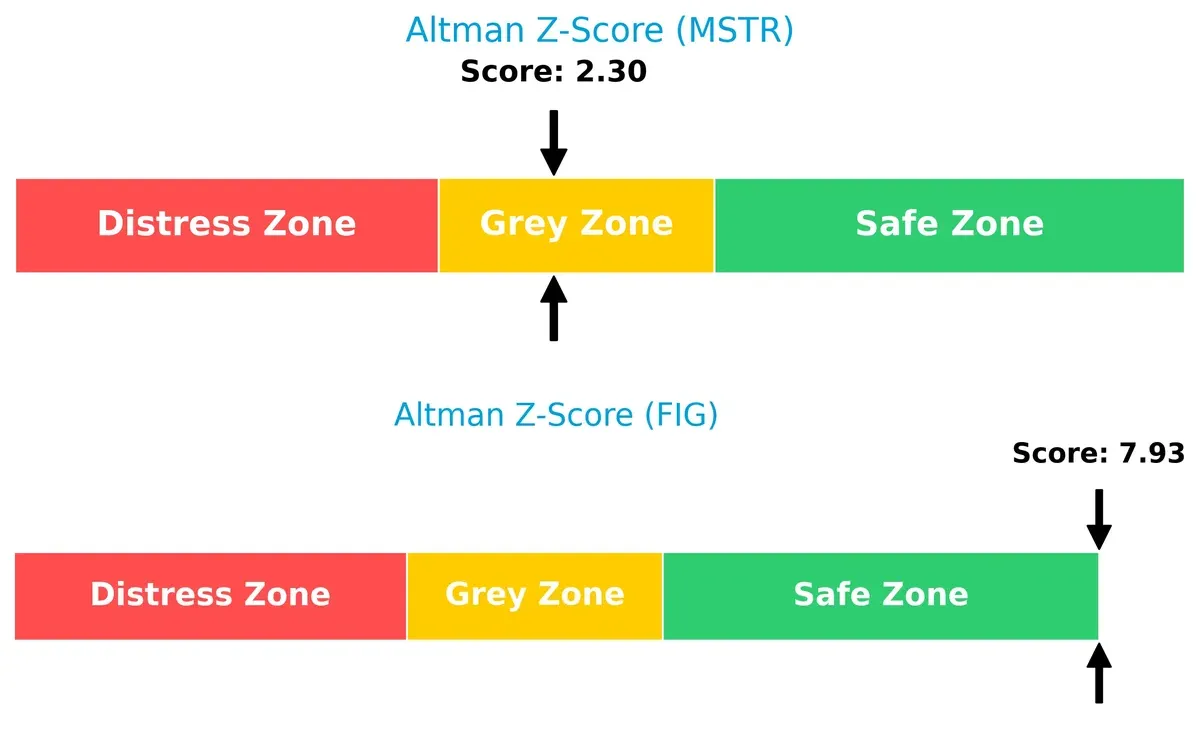
Bankruptcy Risk: Solvency Showdown
Strategy Inc’s Altman Z-Score of 2.3 places it in the grey zone, signaling moderate bankruptcy risk. Figma, Inc. scores 7.9, firmly in the safe zone, indicating robust long-term solvency:
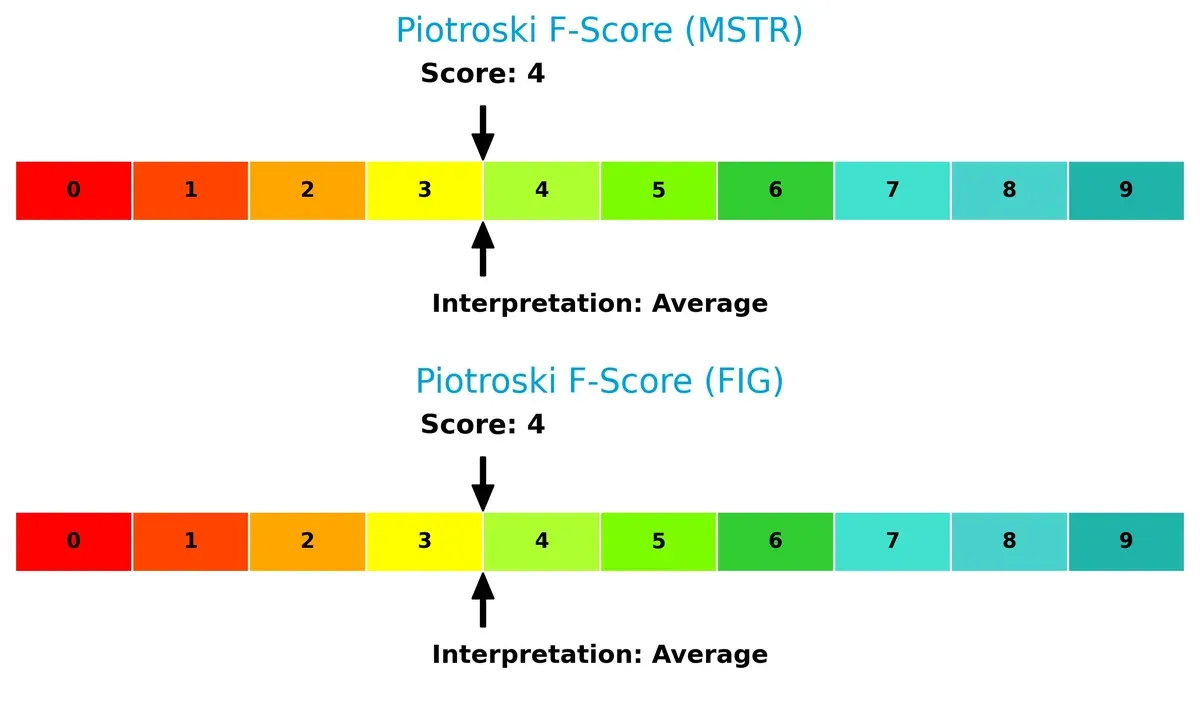
Financial Health: Quality of Operations
Both companies score 4 on the Piotroski F-Score, reflecting average internal financial health. Neither shows red flags, but neither excels in operational quality either:
How are the two companies positioned?
This section dissects the operational DNA of Strategy Inc and Figma, Inc. by comparing their revenue distribution and internal dynamics. The goal is to confront their economic moats to identify which model offers a more resilient, sustainable competitive advantage today.
Revenue Segmentation: The Strategic Mix
The following visual comparison dissects how both firms diversify their income streams and where their primary sector bets lie:
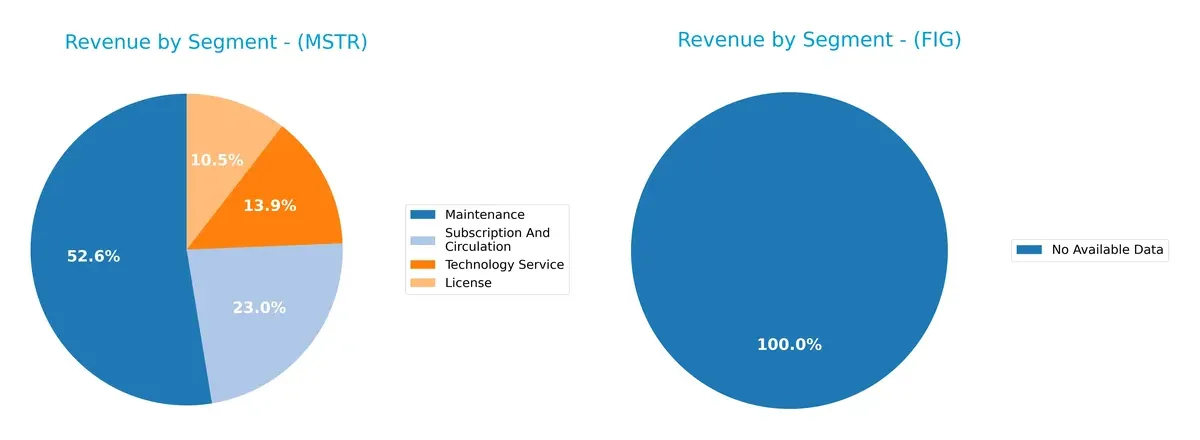
Strategy Inc anchors revenue in Maintenance at $244M in 2024, with License ($49M) and Subscription ($107M) trailing. This mix shows moderate diversification but leans heavily on Maintenance, indicating stable recurring income. Figma, Inc. lacks available segment data, preventing direct comparison. Strategy Inc’s focus on Maintenance suggests ecosystem lock-in, reducing volatility but exposing it to service demand shifts. This concentration demands caution despite steady cash flow.
Strengths and Weaknesses Comparison
This table compares the Strengths and Weaknesses of Strategy Inc and Figma, Inc.:
Strategy Inc Strengths
- Diversified revenue streams across License, Maintenance, Subscription, and Technology Service
- Established global presence with strong North America and EMEA sales
- Favorable debt-to-equity and debt-to-assets ratios support financial stability
- High fixed asset turnover indicates efficient asset use
Figma, Inc. Strengths
- Low debt-to-equity and debt-to-assets ratios show conservative leverage
- Favorable weighted average cost of capital (WACC) enhances capital efficiency
- High fixed asset turnover signals operational efficiency
- Quick ratio is favorable, indicating solid short-term liquidity
Strategy Inc Weaknesses
- Negative net margin, ROE, and ROIC reflect poor profitability
- Unfavorable liquidity ratios (current and quick) imply short-term risk
- Negative interest coverage signals difficulty servicing debt
- High price-to-book ratio suggests possible overvaluation
- No dividend yield limits income appeal
Figma, Inc. Weaknesses
- Negative net margin, ROE, and ROIC show weak profitability
- Unfavorable current ratio may challenge near-term liabilities
- Negative interest coverage risks debt servicing issues
- Very high price-to-book ratio indicates valuation concerns
- No dividend yield reduces shareholder income potential
Both companies face significant profitability challenges with negative returns and margins. Strategy Inc shows stronger diversification and global reach, while Figma benefits from better capital structure and liquidity. These contrasts highlight different strategic focuses and financial risks.
The Moat Duel: Analyzing Competitive Defensibility
A structural moat is the only defense protecting long-term profits from relentless competitive erosion. Let’s dissect how Strategy Inc and Figma, Inc. hold their ground:
Strategy Inc: Intangible Assets and Market Position Strength
Strategy Inc leverages proprietary AI-powered analytics software as its moat. This intangible asset supports stable gross margins near 69%, despite volatile earnings. The firm’s expansion into new enterprise analytics markets in 2026 could deepen this moat, yet declining ROIC warns of rising competitive pressures.
Figma, Inc.: Network Effects and User Collaboration
Figma’s moat stems from powerful network effects in collaborative design software. Its 88% gross margin and rapid 48% revenue growth underscore strong market traction. However, negative ROIC and worsening profitability highlight risks as Figma scales and faces intensified competition in 2026.
Intangible Assets vs. Network Effects: Which Moat Holds Stronger?
Strategy Inc’s moat relies on proprietary technology and stable margins, while Figma depends on expanding user ecosystems and fast growth. Despite Figma’s promising scale, its value destruction and declining ROIC make Strategy Inc’s intangible assets a deeper moat. Strategy Inc appears better equipped to defend its market share amid mounting sector challenges.
Which stock offers better returns?
The past year shows both Strategy Inc and Figma, Inc. enduring steep declines, with Strategy Inc’s trading volume increasing despite bearish price trends.
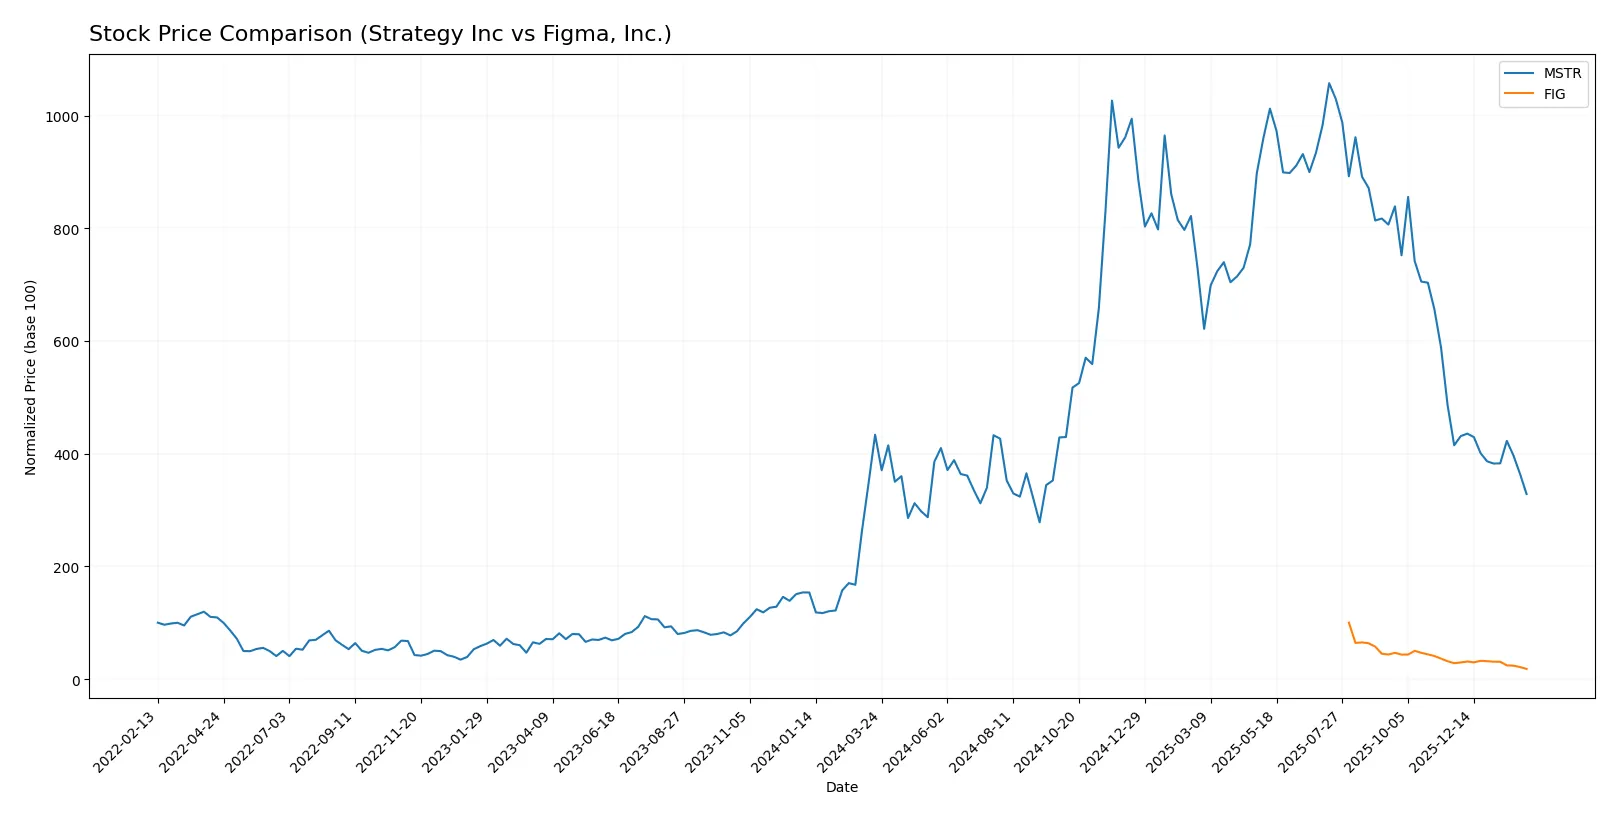
Trend Comparison
Strategy Inc’s stock fell 24.3% over the past 12 months, marking a bearish trend with decelerating losses. The price ranged between 114.3 and 434.58, showing high volatility (std dev 101.34).
Figma, Inc.’s stock plunged 81.98% over the same period, a bearish trend with accelerating declines. Its price fluctuated from 21.99 to 122.0, with moderate volatility (std dev 20.7).
Strategy Inc outperformed Figma, Inc. with a smaller percentage loss and a decelerating downward trend, indicating a less severe market decline.
Target Prices
Analysts present a wide but optimistic target price range for both Strategy Inc and Figma, Inc.
| Company | Target Low | Target High | Consensus |
|---|---|---|---|
| Strategy Inc | 175 | 705 | 374.5 |
| Figma, Inc. | 35 | 52 | 42.17 |
Targets for Strategy Inc imply more than double the current price of $134.93, suggesting high growth expectations despite elevated volatility. Figma’s consensus target of $42.17 also indicates significant upside from its $21.99 market price.

Don’t Let Luck Decide Your Entry Point
Optimize your entry points with our advanced ProRealTime indicators. You’ll get efficient buy signals with precise price targets for maximum performance. Start outperforming now!
How do institutions grade them?
Here is how major grading companies have recently assessed the two companies:
Strategy Inc Grades
The following table summarizes recent grades from reputable grading companies for Strategy Inc:
| Grading Company | Action | New Grade | Date |
|---|---|---|---|
| BTIG | Maintain | Buy | 2026-02-06 |
| Canaccord Genuity | Maintain | Buy | 2026-02-04 |
| Mizuho | Maintain | Outperform | 2026-01-16 |
| TD Cowen | Maintain | Buy | 2026-01-15 |
| Citigroup | Maintain | Buy | 2025-12-22 |
| Bernstein | Maintain | Outperform | 2025-12-08 |
| Monness, Crespi, Hardt | Upgrade | Neutral | 2025-11-10 |
| Canaccord Genuity | Maintain | Buy | 2025-11-03 |
| HC Wainwright & Co. | Maintain | Buy | 2025-11-03 |
| TD Cowen | Maintain | Buy | 2025-10-31 |
Figma, Inc. Grades
Below are the recent grades issued by established firms for Figma, Inc.:
| Grading Company | Action | New Grade | Date |
|---|---|---|---|
| Piper Sandler | Maintain | Overweight | 2026-02-03 |
| Morgan Stanley | Maintain | Equal Weight | 2026-01-15 |
| Wells Fargo | Upgrade | Overweight | 2026-01-08 |
| RBC Capital | Maintain | Sector Perform | 2026-01-05 |
| Goldman Sachs | Maintain | Neutral | 2025-11-07 |
| Piper Sandler | Maintain | Overweight | 2025-11-06 |
| JP Morgan | Maintain | Neutral | 2025-11-06 |
| Wells Fargo | Maintain | Equal Weight | 2025-11-05 |
| Wells Fargo | Maintain | Equal Weight | 2025-09-04 |
| Morgan Stanley | Maintain | Equal Weight | 2025-09-04 |
Which company has the best grades?
Strategy Inc consistently receives Buy and Outperform ratings from several top firms. Figma, Inc.’s grades mostly range from Neutral/Equal Weight to Overweight. Strategy Inc’s stronger consensus grades may indicate higher analyst confidence, which could influence investor sentiment and portfolio decisions.
Risks specific to each company
The following categories identify the critical pressure points and systemic threats facing both firms in the 2026 market environment:
1. Market & Competition
Strategy Inc
- Operates in bitcoin treasury and AI analytics, facing volatile crypto markets and tech rivals.
Figma, Inc.
- Competes in collaborative design software with rapid innovation demands and established incumbents.
2. Capital Structure & Debt
Strategy Inc
- Moderate debt-to-equity ratio at 0.4, manageable but interest coverage is negative, signaling risk.
Figma, Inc.
- Very low debt (0.02), strong balance sheet, but zero interest coverage raises caution on earnings.
3. Stock Volatility
Strategy Inc
- High beta at 3.535 indicates extreme sensitivity to market swings.
Figma, Inc.
- Negative beta (-3.576) suggests unusual inverse correlation, adding unpredictability for investors.
4. Regulatory & Legal
Strategy Inc
- Exposure to crypto regulations globally could create sudden compliance costs.
Figma, Inc.
- Faces regulatory scrutiny around data privacy and software compliance in tech hubs.
5. Supply Chain & Operations
Strategy Inc
- Relies on AI data integration; disruption in data sources or cloud services poses operational risk.
Figma, Inc.
- Dependent on cloud infrastructure and internet stability; any outages impair product usability.
6. ESG & Climate Transition
Strategy Inc
- Crypto-related energy consumption attracts ESG criticism, affecting investor sentiment.
Figma, Inc.
- Software development has lower direct emissions but must manage data center energy use.
7. Geopolitical Exposure
Strategy Inc
- Operates internationally across volatile regions, increasing geopolitical risk.
Figma, Inc.
- Primarily US-based but global user base exposes it to geopolitical trade tensions.
Which company shows a better risk-adjusted profile?
Strategy Inc’s most impactful risk stems from high stock volatility and negative profitability metrics, reflecting crypto market exposure. Figma, Inc. struggles with poor returns and negative equity efficiency but benefits from a safer debt structure and superior Altman Z-score. Figma’s stronger solvency metrics and stable capital structure suggest a better risk-adjusted profile despite operational challenges. Strategy Inc’s elevated beta and negative interest coverage underscore greater financial fragility in 2026.
Final Verdict: Which stock to choose?
Strategy Inc’s superpower lies in its solid asset turnover and a favorable debt profile, signaling operational efficiency and controlled leverage. However, its liquidity constraints pose a point of vigilance. It suits portfolios inclined toward aggressive growth, willing to tolerate near-term volatility for potential upside.
Figma, Inc. commands a strategic moat through its robust current ratio and minimal debt load, offering stronger financial safety than Strategy Inc. Its high gross margin and steady capital structure appeal to investors favoring growth at a reasonable price (GARP), balancing risk and expansion potential.
If you prioritize operational efficiency and are comfortable with tighter liquidity, Strategy Inc outshines as an aggressive growth candidate. However, if you seek better financial stability with room for measured growth, Figma, Inc. offers a safer profile despite its value-destroying trends. Both require cautious monitoring given their profitability challenges.
Disclaimer: Investment carries a risk of loss of initial capital. The past performance is not a reliable indicator of future results. Be sure to understand risks before making an investment decision.
Go Further
I encourage you to read the complete analyses of Strategy Inc and Figma, Inc. to enhance your investment decisions: