In the fast-evolving technology landscape, Figma, Inc. and SoundHound AI, Inc. stand out as innovative players in the software application industry. Figma specializes in collaborative design tools that streamline product development, while SoundHound AI focuses on cutting-edge voice AI platforms enhancing conversational experiences. Their market overlap and distinct innovation strategies make them compelling subjects for comparison. This article will help you decide which company offers the most attractive investment opportunity.
Table of contents
Companies Overview
I will begin the comparison between Figma and SoundHound AI by providing an overview of these two companies and their main differences.
Figma Overview
Figma, Inc. is a technology company specializing in browser-based design tools aimed at enhancing collaboration among design and development teams. Its flagship product, Figma Design, supports prototyping, feedback, and product development with various integrated tools like Dev Mode and FigJam. Founded in 2012 and headquartered in San Francisco, Figma positions itself as a leader in application software for user interface design.
SoundHound AI Overview
SoundHound AI, Inc. develops voice artificial intelligence platforms that empower businesses to create conversational experiences. Its Houndify platform offers tools such as speech recognition, natural language understanding, and text-to-speech to build custom voice assistants. Founded earlier and based in Santa Clara, SoundHound AI focuses on application software within the technology sector, serving diverse industries with its voice AI solutions.
Key similarities and differences
Both companies operate in the technology sector within the software application industry, focusing on innovative platforms that enhance user interaction—Figma in design collaboration and SoundHound AI in voice AI. Figma offers a suite of design and prototyping tools for product teams, while SoundHound AI provides voice assistant technology for businesses. Their market caps differ significantly, with Figma at approximately 14.4B and SoundHound AI at 4.7B USD, reflecting differing scales and possibly market reach.
Income Statement Comparison
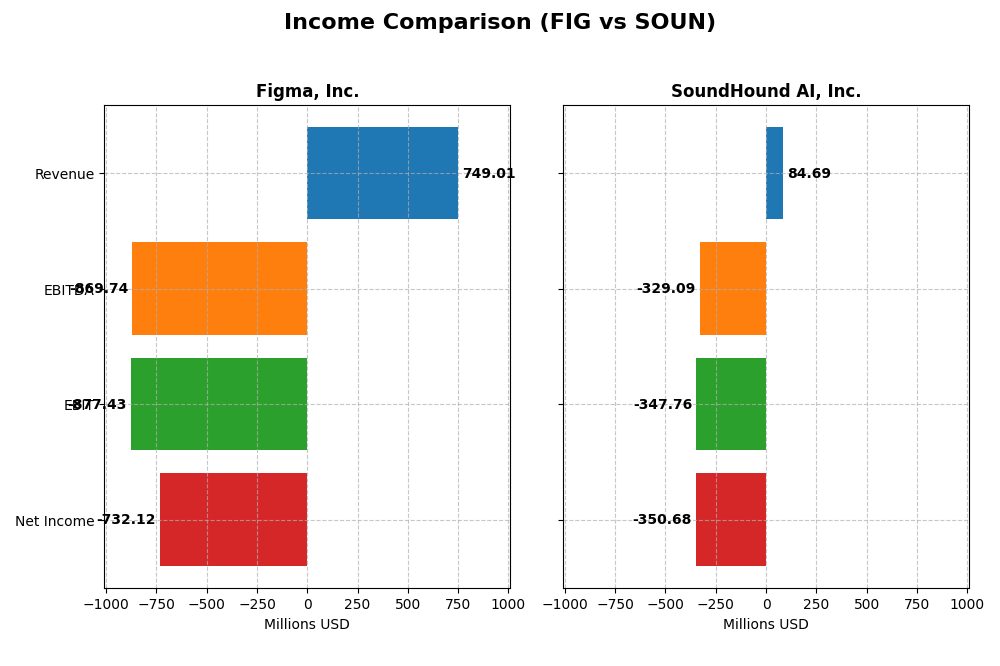
Below is a side-by-side comparison of the latest income statement figures for Figma, Inc. and SoundHound AI, Inc. for the fiscal year 2024.
| Metric | Figma, Inc. (FIG) | SoundHound AI, Inc. (SOUN) |
|---|---|---|
| Market Cap | 14.4B | 4.7B |
| Revenue | 749M | 85M |
| EBITDA | -870M | -329M |
| EBIT | -877M | -348M |
| Net Income | -732M | -351M |
| EPS | -3.11 | -1.04 |
| Fiscal Year | 2024 | 2024 |
Income Statement Interpretations
Figma, Inc.
Figma’s revenue grew strongly by 48.36% from 2023 to 2024, reaching $749M, with a gross margin of 88.32%, which is favorable. However, net income fell sharply to a loss of $732M, reflecting a negative net margin of -97.74%. Operating expenses rose proportionally, causing EBIT and net margin to deteriorate significantly in the latest year.
SoundHound AI, Inc.
SoundHound’s revenue surged 84.62% year-over-year to $85M in 2024, with a gross margin of 48.86%, considered favorable. Despite revenue growth, the company posted a net loss of $351M, with a steep net margin of -414.06% and increased interest expenses. Operating losses widened, indicating profitability challenges despite expanding top-line figures.
Which one has the stronger fundamentals?
Both companies show unfavorable net margins and losses, though Figma maintains a higher gross margin with strong revenue growth. SoundHound exhibits higher revenue growth overall but struggles with heavier interest expenses and larger negative margins. Each faces significant profitability headwinds, complicating a clear fundamental preference based solely on income statement metrics.
Financial Ratios Comparison
The table below compares key financial ratios for Figma, Inc. and SoundHound AI, Inc. based on their most recent fiscal year data for 2024.
| Ratios | Figma, Inc. (FIG) | SoundHound AI, Inc. (SOUN) |
|---|---|---|
| ROE | -55.3% | -191.9% |
| ROIC | -59.7% | -68.1% |
| P/E | -70.7 | -19.1 |
| P/B | 39.1 | 36.8 |
| Current Ratio | 3.66 | 3.77 |
| Quick Ratio | 3.66 | 3.77 |
| D/E | 0.022 | 0.024 |
| Debt-to-Assets | 1.6% | 0.8% |
| Interest Coverage | 0 | -28.1 |
| Asset Turnover | 0.42 | 0.15 |
| Fixed Asset Turnover | 17.1 | 14.3 |
| Payout ratio | 0 | 0 |
| Dividend yield | 0 | 0 |
Interpretation of the Ratios
Figma, Inc.
Figma shows mixed ratio strength with a low net margin of -97.74% and negative returns on equity and invested capital, indicating profitability challenges. Its current ratio is high at 3.66 but considered unfavorable due to potential inefficiencies. The company does not pay dividends, reflecting a reinvestment strategy in its growth phase without share buybacks.
SoundHound AI, Inc.
SoundHound AI exhibits weak profitability ratios with a net margin of -414.06% and a sharply negative return on equity of -191.99%. Its weighted average cost of capital is elevated at 17.71%, signaling higher capital costs. Like Figma, it pays no dividends, likely focusing on development and expansion priorities rather than shareholder returns.
Which one has the best ratios?
Both companies have predominantly unfavorable ratios, but Figma holds a slight edge with a higher percentage of favorable metrics (42.86% versus 35.71%) and a lower weighted average cost of capital. However, each faces significant profitability and efficiency challenges, necessitating careful consideration of financial risks.
Strategic Positioning
This section compares the strategic positioning of Figma, Inc. and SoundHound AI, Inc., including their market position, key segments, and exposure to technological disruption:
Figma, Inc.
- Market leader in collaborative UI design software with strong competitive pressure.
- Focuses on design collaboration tools for UI/UX teams across industries.
- Faces disruption from evolving AI tools in design and code translation.
SoundHound AI, Inc.
- Smaller market cap, competing in voice AI with moderate competitive pressure.
- Diversified revenue from hosted services, licensing, and professional services.
- Exposed to technological shifts in conversational AI and voice recognition.
Figma, Inc. vs SoundHound AI, Inc. Positioning
Figma concentrates on design collaboration software, serving mainly UI/UX teams, while SoundHound operates a broader voice AI platform with multiple revenue streams. Figma’s positioning is industry-specific; SoundHound shows more segment diversification but smaller scale.
Which has the best competitive advantage?
Both companies are currently shedding value as ROIC is below WACC, but SoundHound’s improving profitability trend suggests a slightly more favorable moat compared to Figma’s sharply declining returns.
Stock Comparison
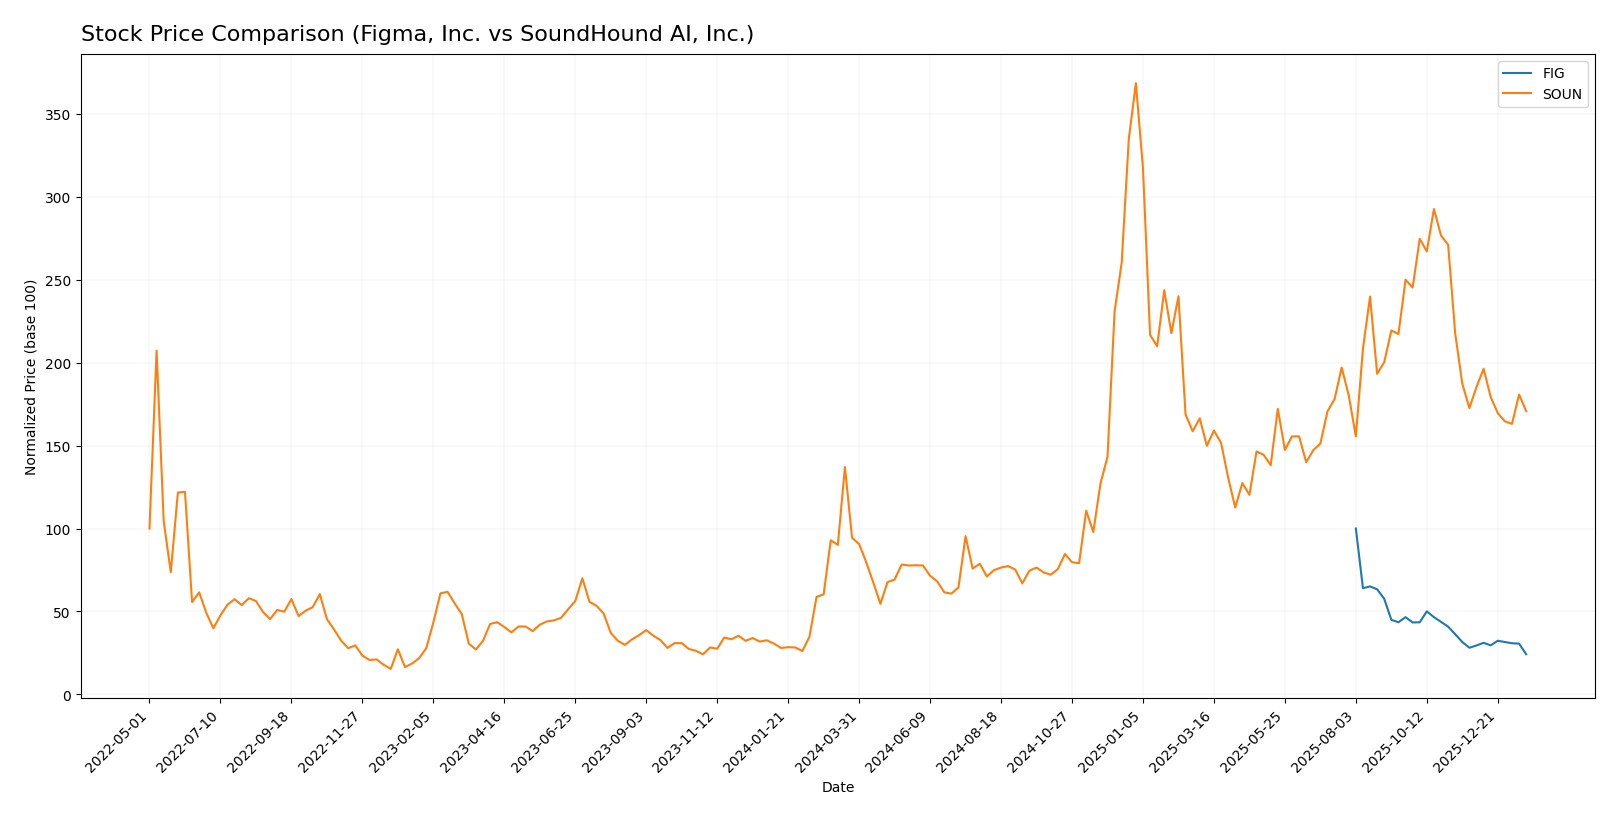
The stock prices of Figma, Inc. (FIG) and SoundHound AI, Inc. (SOUN) have displayed contrasting dynamics over the past 12 months, with FIG experiencing significant declines and SOUN showing strong growth followed by recent pullbacks.
Trend Analysis
Figma, Inc. (FIG) exhibited a bearish trend over the past 12 months with a price decline of -75.76%, accelerating downward and a high volatility level indicated by a 19.95 standard deviation. The stock reached a high of 122.0 and a low of 29.57.
SoundHound AI, Inc. (SOUN) showed a bullish trend over the same period with a 183.16% price increase, though recent months revealed deceleration and a moderate volatility of 4.66 standard deviation. The stock hit a high of 23.95 and a low of 3.55.
Comparing both stocks, SOUN delivered the highest market performance over the 12-month period despite recent declines, while FIG posted a steep bearish trend with accelerating losses.
Target Prices
Analysts provide a clear consensus on target prices for both Figma, Inc. and SoundHound AI, Inc.
| Company | Target High | Target Low | Consensus |
|---|---|---|---|
| Figma, Inc. | 52 | 38 | 43.6 |
| SoundHound AI, Inc. | 15 | 11 | 13.33 |
The consensus targets suggest that Figma’s stock price, currently at $29.57, has significant upside potential. Similarly, SoundHound AI’s consensus target of $13.33 is above its current price of $11.10, indicating moderate expected growth.
Analyst Opinions Comparison
This section compares analysts’ ratings and grades for Figma, Inc. and SoundHound AI, Inc.:
Rating Comparison
FIG Rating
- Rating: C+ with a Very Favorable status
- Discounted Cash Flow Score: 4, Favorable
- ROE Score: 1, Very Unfavorable
- ROA Score: 1, Very Unfavorable
- Debt To Equity Score: 4, Favorable
- Overall Score: 2, Moderate
SOUN Rating
- Rating: C- with a Very Favorable status
- Discounted Cash Flow Score: 1, Very Unfavorable
- ROE Score: 1, Very Unfavorable
- ROA Score: 1, Very Unfavorable
- Debt To Equity Score: 4, Favorable
- Overall Score: 1, Very Unfavorable
Which one is the best rated?
Based strictly on the data, Figma, Inc. holds a higher overall score (2 vs. 1) and a stronger discounted cash flow score, while both companies share low ROE and ROA scores and equal debt-to-equity strength. Figma is better rated overall.
Scores Comparison
Here is a comparison of the Altman Z-Score and Piotroski Score for Figma, Inc. and SoundHound AI, Inc.:
FIG Scores
- Altman Z-Score: 14.34, indicating a safe zone showing very low bankruptcy risk.
- Piotroski Score: 4, classified as average financial strength.
SOUN Scores
- Altman Z-Score: 6.62, indicating a safe zone showing very low bankruptcy risk.
- Piotroski Score: 3, classified as very weak financial strength.
Which company has the best scores?
Based strictly on the provided data, FIG has a higher Altman Z-Score and a better Piotroski Score than SOUN. FIG shows stronger financial health and lower bankruptcy risk compared to SOUN.
Grades Comparison
The following is a comparison of recent grades and ratings for Figma, Inc. and SoundHound AI, Inc.:
Figma, Inc. Grades
This table summarizes recent grades assigned to Figma, Inc. by major grading companies.
| Grading Company | Action | New Grade | Date |
|---|---|---|---|
| Morgan Stanley | Maintain | Equal Weight | 2026-01-15 |
| Wells Fargo | Upgrade | Overweight | 2026-01-08 |
| RBC Capital | Maintain | Sector Perform | 2026-01-05 |
| Goldman Sachs | Maintain | Neutral | 2025-11-07 |
| JP Morgan | Maintain | Neutral | 2025-11-06 |
| Piper Sandler | Maintain | Overweight | 2025-11-06 |
| Wells Fargo | Maintain | Equal Weight | 2025-11-05 |
| Wells Fargo | Maintain | Equal Weight | 2025-09-04 |
| Morgan Stanley | Maintain | Equal Weight | 2025-09-04 |
| RBC Capital | Maintain | Sector Perform | 2025-09-04 |
Figma’s grades mostly indicate a neutral to moderate positive outlook, with several “Equal Weight” and “Sector Perform” ratings alongside some “Overweight” recommendations.
SoundHound AI, Inc. Grades
This table presents the recent grading actions for SoundHound AI, Inc. by recognized grading firms.
| Grading Company | Action | New Grade | Date |
|---|---|---|---|
| Piper Sandler | Maintain | Neutral | 2026-01-05 |
| Cantor Fitzgerald | Upgrade | Overweight | 2025-12-12 |
| DA Davidson | Maintain | Buy | 2025-11-18 |
| Piper Sandler | Maintain | Neutral | 2025-11-07 |
| HC Wainwright & Co. | Maintain | Buy | 2025-10-16 |
| HC Wainwright & Co. | Maintain | Buy | 2025-09-17 |
| Wedbush | Maintain | Outperform | 2025-09-11 |
| DA Davidson | Maintain | Buy | 2025-09-10 |
| Ladenburg Thalmann | Upgrade | Buy | 2025-08-11 |
| Wedbush | Maintain | Outperform | 2025-08-08 |
SoundHound AI’s grades show a stronger positive trend, with multiple “Buy” and “Outperform” ratings and some recent upgrades.
Which company has the best grades?
SoundHound AI holds stronger grades overall, with more buy and outperform ratings compared to Figma’s more neutral and cautious grades. This suggests investors may perceive SoundHound as having higher growth potential or momentum relative to Figma.
Strengths and Weaknesses
Below is a comparison of key strengths and weaknesses for Figma, Inc. (FIG) and SoundHound AI, Inc. (SOUN) based on their most recent financial and operational data.
| Criterion | Figma, Inc. (FIG) | SoundHound AI, Inc. (SOUN) |
|---|---|---|
| Diversification | Limited product segmentation; focused on design software | Moderate diversification with Hosted Services (57.2M), Licensing (17.6M), Professional Services (9.5M) |
| Profitability | Negative net margin (-97.74%), ROIC -59.7%, value destroying | Negative net margin (-414.06%), ROIC -68.1%, but improving profitability trend |
| Innovation | Strong in UI/UX design innovation but profitability declining | AI voice tech innovation with growing ROIC, signaling improving efficiency |
| Global presence | Established user base worldwide but no clear revenue segmentation by region | Expanding Hosted Services revenue indicates growing global market penetration |
| Market Share | Leading position in design software market but challenged by profitability issues | Smaller market share with niche AI voice services, growing revenue base |
Key takeaways: Both companies currently face profitability challenges and are value destroyers financially. Figma leads in market share and product focus, while SoundHound shows promising improvement in profitability and revenue diversification. Investors should weigh growth potential against ongoing financial risks carefully.
Risk Analysis
Below is a comparative overview of key risks for Figma, Inc. (FIG) and SoundHound AI, Inc. (SOUN) based on the most recent data from 2024.
| Metric | Figma, Inc. (FIG) | SoundHound AI, Inc. (SOUN) |
|---|---|---|
| Market Risk | High volatility; beta -3.8 indicates strong price swings | Elevated volatility; beta 2.9 shows significant market sensitivity |
| Debt level | Low debt-to-equity ratio 0.02; low financial leverage | Low debt-to-equity ratio 0.02; low financial leverage |
| Regulatory Risk | Moderate; technology sector compliance risks | Moderate; AI sector faces evolving regulations |
| Operational Risk | Moderate; scaling challenges with 1.6K employees | Moderate; smaller scale with 842 employees, but reliant on tech innovation |
| Environmental Risk | Low; no direct material exposure | Low; minimal environmental footprint |
| Geopolitical Risk | Low; US-based with limited international exposure | Low; US-based, minimal global operational complexity |
Figma and SoundHound both face pronounced market risk due to high volatility and negative profitability metrics. Figma’s negative net margin (-97.7%) and SoundHound’s even larger losses (-414.1%) highlight operational and financial risks. Both companies maintain very low debt, reducing financial risk. Regulatory uncertainty in AI and software remains a moderate concern but is less impactful than market and operational risks. Overall, market fluctuations and sustained operational losses are the most critical risks to monitor closely.
Which Stock to Choose?
Figma, Inc. (FIG) shows a 48% revenue growth in 2024 but suffers from unfavorable profitability with negative returns on equity (-55%) and capital (-60%). Its debt levels are low and well-managed, yet overall financial ratios and income statements remain unfavorable, with a very unfavorable moat rating.
SoundHound AI, Inc. (SOUN) reports stronger revenue growth (85% in one year, 551% over several years) but endures significant losses, with negative returns on equity (-192%) and capital (-68%). It maintains low debt levels and a slightly unfavorable moat due to improving profitability, but its financial ratios and income statement evaluations are also unfavorable.
Investors prioritizing growth might find SoundHound’s strong revenue expansion and improving profitability trend appealing, while those seeking a larger market cap and relatively better debt management could view Figma’s profile as more stable despite its declining profitability; both companies present financial challenges reflected in their unfavorable ratings.
Disclaimer: Investment carries a risk of loss of initial capital. The past performance is not a reliable indicator of future results. Be sure to understand risks before making an investment decision.
Go Further
I encourage you to read the complete analyses of Figma, Inc. and SoundHound AI, Inc. to enhance your investment decisions: