In the fast-evolving software application sector, Snowflake Inc. and Figma, Inc. stand out as innovators transforming how businesses handle data and design. Snowflake’s cloud-based data platform and Figma’s collaborative design tools overlap in driving digital transformation, yet they serve different core needs. This analysis will help you understand which company aligns best with your investment goals in 2026. Let’s explore which presents the most compelling opportunity.
Table of contents
Companies Overview
I will begin the comparison between Snowflake and Figma by providing an overview of these two companies and their main differences.
Snowflake Overview
Snowflake Inc. provides a cloud-based data platform aimed at consolidating data into a single source of truth to drive business insights and build data-driven applications. Operating internationally from Bozeman, Montana, Snowflake serves organizations of various sizes across multiple industries. Founded in 2012 and publicly listed since 2020, it is positioned as a key player in cloud data management with a market cap of approximately 70B USD.
Figma Overview
Figma, Inc. develops browser-based design tools that facilitate collaboration among design and development teams. Its product suite includes tools for UI design, prototyping, and presentation, with innovative offerings like AI-driven design and brand template publishing. Incorporated in 2012 and headquartered in San Francisco, Figma entered the public market in 2025 and holds a market cap near 14.4B USD, focusing on software application solutions for creative workflows.
Key similarities and differences
Both Snowflake and Figma operate in the technology sector under software-application industries, providing cloud-centric platforms that enhance productivity for their users. Snowflake emphasizes data consolidation and analytics across industries, while Figma specializes in collaborative design and prototyping tools for product development teams. Their differing core focuses reflect distinct market needs despite sharing a reliance on cloud infrastructure and innovation-driven growth.
Income Statement Comparison
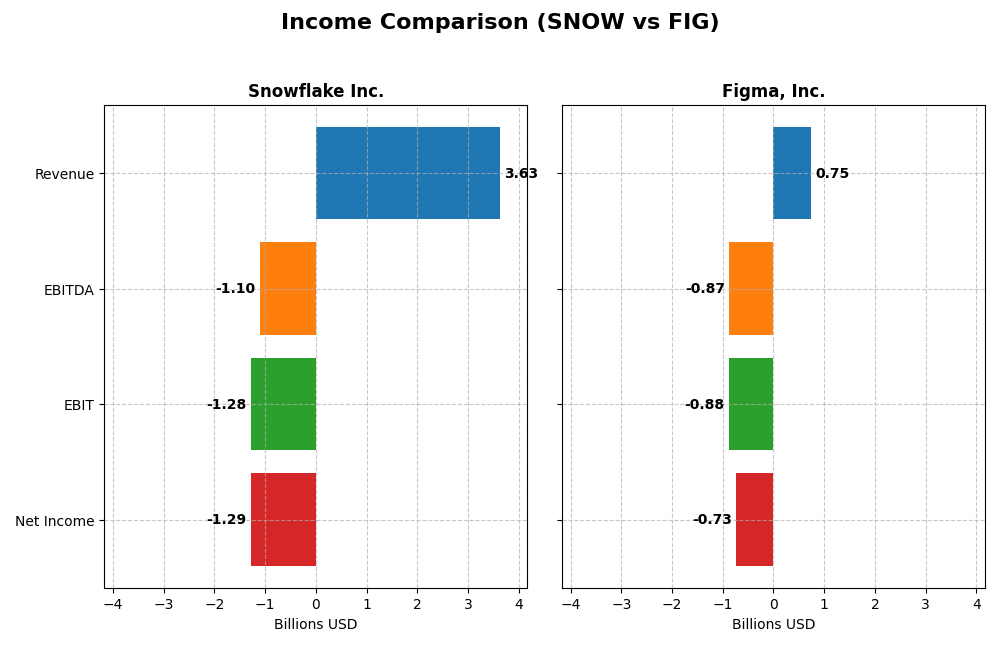
This table compares the key income statement metrics for Snowflake Inc. and Figma, Inc. for their most recent fiscal years, providing a snapshot of their financial performance.
| Metric | Snowflake Inc. (SNOW) | Figma, Inc. (FIG) |
|---|---|---|
| Market Cap | 70.4B | 14.4B |
| Revenue | 3.63B | 749M |
| EBITDA | -1.10B | -870M |
| EBIT | -1.28B | -877M |
| Net Income | -1.29B | -732M |
| EPS | -3.86 | -3.11 |
| Fiscal Year | 2025 | 2024 |
Income Statement Interpretations
Snowflake Inc.
Snowflake’s revenue showed a strong growth trend from 2021 to 2025, reaching $3.63B in 2025, up 29.2% from the previous year. Net income remained negative, worsening to -$1.29B in 2025. Gross margins stayed favorable at 66.5%, but EBIT and net margins were deeply negative. The latest year showed revenue growth slowing slightly while margins deteriorated.
Figma, Inc.
Figma’s revenue grew sharply by 48.4% from 2023 to 2024, reaching $749M. Despite high gross margins of 88.3%, the company recorded a net loss of -$732M in 2024, significantly worsening from the prior year. EBIT and net margins were highly negative, with operating expenses growing faster than revenue, indicating increasing losses in the most recent year.
Which one has the stronger fundamentals?
Snowflake demonstrates stronger fundamentals with robust revenue growth over multiple years and stable, though negative, margins. Figma, despite rapid revenue growth, faces steep losses and worsening margins, with operating expenses outpacing revenue growth. Snowflake’s balanced favorable and unfavorable indicators contrast with Figma’s predominantly unfavorable income statement metrics.
Financial Ratios Comparison
The table below compares key financial ratios for Snowflake Inc. (SNOW) and Figma, Inc. (FIG) based on their most recent fiscal year data, providing insights into profitability, liquidity, leverage, and efficiency.
| Ratios | Snowflake Inc. (2025) | Figma, Inc. (2024) |
|---|---|---|
| ROE | -42.86% | -55.29% |
| ROIC | -25.24% | -59.68% |
| P/E | -47.0 | -70.7 |
| P/B | 20.13 | 39.10 |
| Current Ratio | 1.75 | 3.66 |
| Quick Ratio | 1.75 | 3.66 |
| D/E (Debt-to-Equity) | 0.90 | 0.02 |
| Debt-to-Assets | 29.72% | 1.60% |
| Interest Coverage | -527.7 | 0 |
| Asset Turnover | 0.40 | 0.42 |
| Fixed Asset Turnover | 5.53 | 17.09 |
| Payout Ratio | 0 | 0 |
| Dividend Yield | 0 | 0 |
Interpretation of the Ratios
Snowflake Inc.
Snowflake’s ratios show mixed strength with favorable current and quick ratios at 1.75, indicating solid liquidity, but weak profitability metrics such as a -42.86% ROE and -35.45% net margin raise concerns. The high price-to-book ratio of 20.13 also signals possible overvaluation. Snowflake does not pay dividends, aligning with its focus on reinvestment and growth.
Figma, Inc.
Figma exhibits a strong balance sheet with a 3.66 quick ratio and low debt-to-assets at 1.6%, but profitability remains poor, highlighted by a -55.29% ROE and -97.74% net margin. The firm also has a high price-to-book ratio of 39.1, suggesting market premium. Figma does not distribute dividends, likely prioritizing growth and R&D investments.
Which one has the best ratios?
Comparing the two, Snowflake has a more favorable liquidity profile and a slightly better global ratio opinion of “slightly unfavorable” versus Figma’s “unfavorable.” However, both companies face significant profitability challenges and lack dividend payouts, reflecting risk factors linked to their growth-oriented strategies.
Strategic Positioning
This section compares the strategic positioning of Snowflake Inc. and Figma, Inc., focusing on market position, key segments, and exposure to technological disruption:
Snowflake Inc.
- Leading cloud-based data platform with strong presence in multiple industries; faces competitive pressure in tech sector.
- Revenue mainly from Product offerings including data cloud services; Professional Services contribute less to total revenue.
- Operates in a technology sector prone to innovation; platform-based model may face disruption from new cloud data solutions and AI trends.
Figma, Inc.
- Browser-based design software provider targeting collaborative UI/UX teams; operates in competitive software market.
- Focused on design collaboration tools including prototypes, presentations, and AI-driven design features; no reported revenue segmentation.
- Relies on innovative browser-based design and AI tools; subject to disruption from evolving design technologies and software integration advances.
Snowflake Inc. vs Figma, Inc. Positioning
Snowflake shows a diversified product portfolio centered on cloud data platforms, while Figma concentrates on UI/UX design collaboration tools. Snowflake’s broad industry application contrasts with Figma’s specialized design market focus, each with inherent competitive pressures and innovation risks.
Which has the best competitive advantage?
Both companies exhibit a very unfavorable moat status due to declining ROIC below WACC, indicating value destruction and decreasing profitability, thus neither currently demonstrates a sustainable competitive advantage based on MOAT evaluation.
Stock Comparison
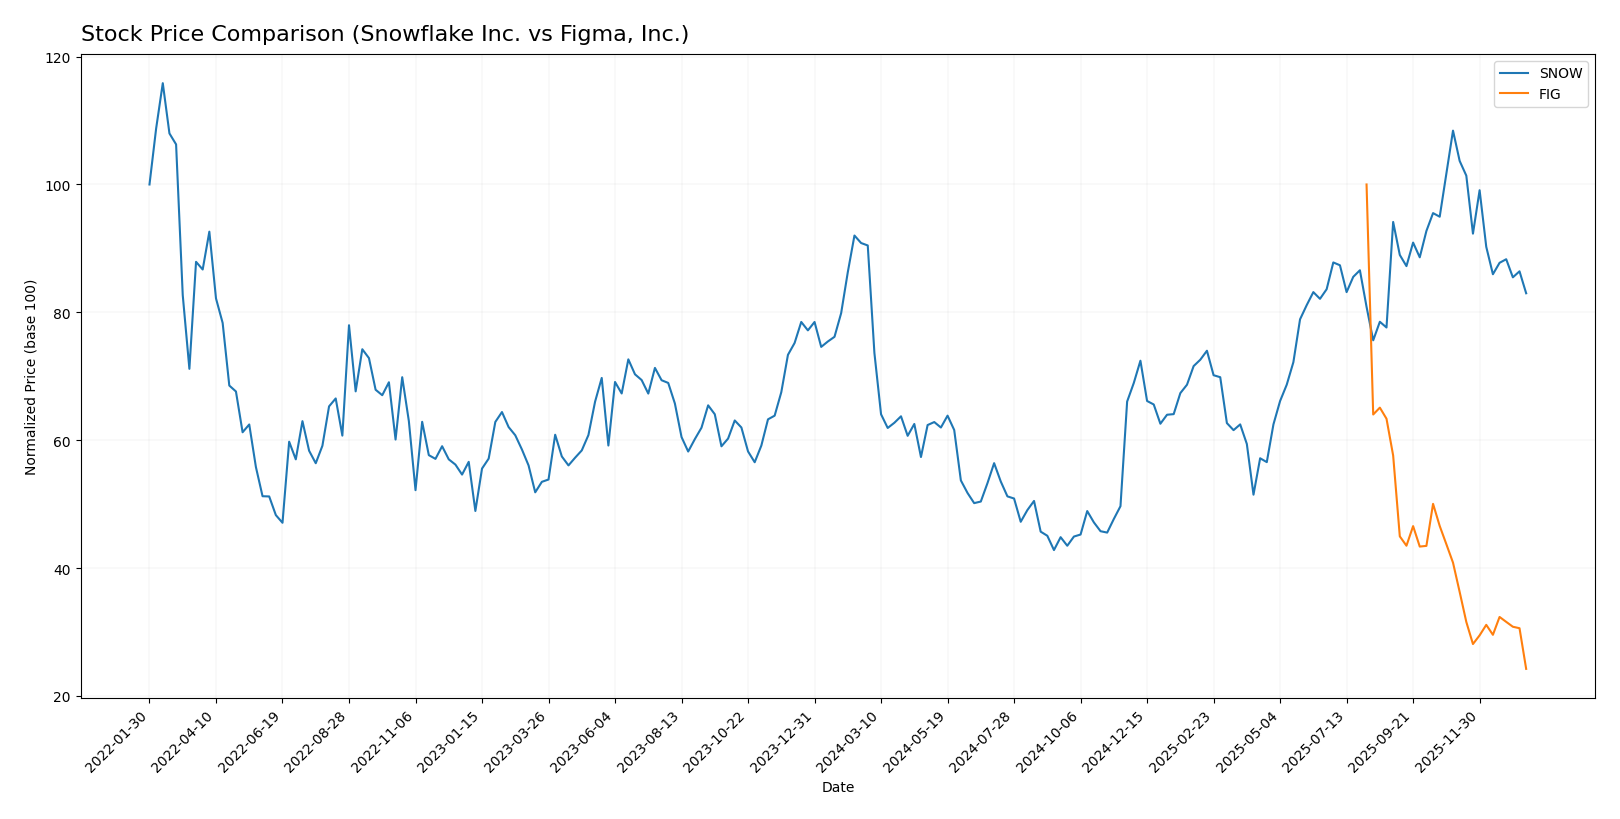
The stock price charts of Snowflake Inc. (SNOW) and Figma, Inc. (FIG) over the past year reveal significant bearish trends, marked by notable price declines and shifts in trading volume dynamics.
Trend Analysis
Snowflake Inc. (SNOW) experienced an 8.27% price decline over the past year, indicating a bearish trend with deceleration in price movement. The stock showed high volatility, with a standard deviation of 42.6, reaching a high of 274.88 and a low of 108.56.
Figma, Inc. (FIG) recorded a 75.76% price drop over the same period, reflecting a strong bearish trend with accelerating price decline. Volatility was lower compared to SNOW, at a standard deviation of 19.95, with prices ranging between 122.0 and 29.57.
Comparing both stocks, FIG delivered the lowest market performance with a much steeper decline, while SNOW’s losses were less severe but still firmly bearish.
Target Prices
Analysts provide a clear target price consensus for Snowflake Inc. and Figma, Inc., indicating potential upside from current prices.
| Company | Target High | Target Low | Consensus |
|---|---|---|---|
| Snowflake Inc. | 325 | 237 | 281.86 |
| Figma, Inc. | 52 | 38 | 43.6 |
The consensus target prices suggest Snowflake could rise roughly 34% from its current 210.38 USD, while Figma shows potential upside of about 48% from 29.57 USD, reflecting positive analyst expectations for both stocks.
Analyst Opinions Comparison
This section compares analysts’ ratings and grades for Snowflake Inc. and Figma, Inc.:
Rating Comparison
Snowflake Inc. Rating
- Rating: C- with a “Very Favorable” status
- Discounted Cash Flow Score: 3, considered Moderate
- ROE Score: 1, considered Very Unfavorable
- ROA Score: 1, considered Very Unfavorable
- Debt To Equity Score: 1, considered Very Unfavorable
- Overall Score: 1, considered Very Unfavorable
Figma, Inc. Rating
- Rating: C+ with a “Very Favorable” status
- Discounted Cash Flow Score: 4, considered Favorable
- ROE Score: 1, considered Very Unfavorable
- ROA Score: 1, considered Very Unfavorable
- Debt To Equity Score: 4, considered Favorable
- Overall Score: 2, considered Moderate
Which one is the best rated?
Based strictly on the provided data, Figma holds a better overall rating and higher scores in discounted cash flow and debt-to-equity metrics compared to Snowflake. However, both share similarly low scores in return on equity and assets.
Scores Comparison
Here is the comparison of the Altman Z-Score and Piotroski Score for Snowflake Inc. and Figma, Inc.:
Snowflake Inc. Scores
- Altman Z-Score: 5.36, indicating a safe zone with low bankruptcy risk.
- Piotroski Score: 4, assessed as average financial strength.
Figma, Inc. Scores
- Altman Z-Score: 14.34, indicating a safe zone with very low bankruptcy risk.
- Piotroski Score: 4, assessed as average financial strength.
Which company has the best scores?
Figma has a significantly higher Altman Z-Score than Snowflake, both in the safe zone, indicating stronger bankruptcy safety. Both companies share the same average Piotroski Score, reflecting similar financial strength in that measure.
Grades Comparison
The following is a comparison of the latest available analyst grades for Snowflake Inc. and Figma, Inc.:
Snowflake Inc. Grades
Here is a summary of recent analyst grades assigned to Snowflake Inc.:
| Grading Company | Action | New Grade | Date |
|---|---|---|---|
| Barclays | Downgrade | Equal Weight | 2026-01-12 |
| Argus Research | Upgrade | Buy | 2026-01-08 |
| Citigroup | Maintain | Buy | 2025-12-08 |
| Wells Fargo | Maintain | Overweight | 2025-12-04 |
| Keybanc | Maintain | Overweight | 2025-12-04 |
| Piper Sandler | Maintain | Overweight | 2025-12-04 |
| Morgan Stanley | Maintain | Overweight | 2025-12-04 |
| Wedbush | Maintain | Outperform | 2025-12-04 |
| Deutsche Bank | Maintain | Buy | 2025-12-04 |
| Cantor Fitzgerald | Maintain | Overweight | 2025-12-04 |
Overall, Snowflake’s grades show a strong buy and overweight consensus with minor recent downgrades.
Figma, Inc. Grades
Below are recent analyst grades for Figma, Inc.:
| Grading Company | Action | New Grade | Date |
|---|---|---|---|
| Morgan Stanley | Maintain | Equal Weight | 2026-01-15 |
| Wells Fargo | Upgrade | Overweight | 2026-01-08 |
| RBC Capital | Maintain | Sector Perform | 2026-01-05 |
| Goldman Sachs | Maintain | Neutral | 2025-11-07 |
| JP Morgan | Maintain | Neutral | 2025-11-06 |
| Piper Sandler | Maintain | Overweight | 2025-11-06 |
| Wells Fargo | Maintain | Equal Weight | 2025-11-05 |
| Wells Fargo | Maintain | Equal Weight | 2025-09-04 |
| Morgan Stanley | Maintain | Equal Weight | 2025-09-04 |
| RBC Capital | Maintain | Sector Perform | 2025-09-04 |
Figma’s grades reflect a mix of equal weight, sector perform, and neutral ratings with a recent upgrade from Wells Fargo.
Which company has the best grades?
Snowflake Inc. holds the stronger consensus with 38 buys and only 10 holds, compared to Figma’s 2 buys and 4 holds. This suggests Snowflake is viewed more favorably by analysts, potentially influencing investor confidence and portfolio positioning.
Strengths and Weaknesses
Below is a comparative overview of key strengths and weaknesses for Snowflake Inc. and Figma, Inc. based on their latest financial and strategic data.
| Criterion | Snowflake Inc. (SNOW) | Figma, Inc. (FIG) |
|---|---|---|
| Diversification | Moderate: Revenue mainly from products (3.46B USD in 2025) with smaller services segment | Low: Limited product diversification data available; primarily software |
| Profitability | Weak: Negative net margin (-35.45%) and declining ROIC (-25.24%), value destroying | Weak: Even larger losses with net margin (-97.74%) and ROIC (-59.68%), value destroying |
| Innovation | Moderate: Strong fixed asset turnover (5.53) indicating efficient use of assets | High: Very high fixed asset turnover (17.09) but profitability remains negative |
| Global presence | Strong: Well-established global footprint and growing product revenue | Moderate: Smaller scale with less global diversification reported |
| Market Share | Growing but challenged: Rapid revenue growth but profitability issues | Emerging player: Still developing market share, facing financial challenges |
Key takeaways: Both companies face profitability challenges with negative ROIC and declining returns, indicating value destruction. Snowflake benefits from stronger diversification and global presence, while Figma shows high asset efficiency but suffers from steep losses and limited diversification. Investors should weigh growth potential against financial risks carefully.
Risk Analysis
Below is a comparative table summarizing key risks for Snowflake Inc. and Figma, Inc. based on the most recent data.
| Metric | Snowflake Inc. (SNOW) | Figma, Inc. (FIG) |
|---|---|---|
| Market Risk | Beta 1.14 – moderate volatility | Beta -3.80 – highly volatile and unpredictable |
| Debt level | Debt-to-Equity 0.9 – moderate debt | Debt-to-Equity 0.02 – very low debt |
| Regulatory Risk | Moderate – US tech regulations | Moderate – US tech and privacy regulations |
| Operational Risk | Medium – scale and integration of cloud services | Medium – reliance on browser-based tech and rapid growth |
| Environmental Risk | Low – primarily software business | Low – primarily software business |
| Geopolitical Risk | Moderate – global data privacy laws impact | Moderate – global data privacy laws impact |
The most impactful risks arise from market volatility and operational challenges in scaling and integrating complex cloud platforms for Snowflake, while Figma faces significant market risk due to high beta and operational risk related to rapid product expansion. Both companies have low environmental risks but must navigate evolving regulatory landscapes and geopolitical tensions affecting data privacy.
Which Stock to Choose?
Snowflake Inc. (SNOW) shows strong revenue growth of 29.2% in 2025 with favorable gross margin but suffers from negative profitability and declining returns, reflected in a very unfavorable moat rating and a slightly unfavorable global ratios evaluation. Its debt levels are moderate, and the overall rating is very favorable despite some unfavorable financial scores.
Figma, Inc. (FIG) experienced higher revenue growth of 48.4% in 2024 but faces severe profitability challenges with a net margin of -97.7% and a very unfavorable moat rating indicating value destruction. Financial ratios are mostly unfavorable; however, FIG has low debt and a very favorable rating score, albeit with moderate overall financial health.
Investors seeking growth might find SNOW’s improving income dynamics and moderate financial risk more appealing, while those prioritizing balance sheet strength and lower debt might view FIG’s profile as fitting; both stocks exhibit bearish price trends and significant risks requiring cautious assessment.
Disclaimer: Investment carries a risk of loss of initial capital. The past performance is not a reliable indicator of future results. Be sure to understand risks before making an investment decision.
Go Further
I encourage you to read the complete analyses of Snowflake Inc. and Figma, Inc. to enhance your investment decisions: