In the fast-evolving software application sector, Shopify Inc. and Figma, Inc. stand out as transformative players driving innovation and digital collaboration. Shopify empowers merchants with a comprehensive commerce platform, while Figma revolutionizes design with its cloud-based interface tools. Both companies compete in overlapping technology spaces, making their strategies and growth prospects highly relevant to investors. This article will help you decide which company offers the most compelling investment opportunity in 2026.
Table of contents
Companies Overview
I will begin the comparison between Shopify Inc. and Figma, Inc. by providing an overview of these two companies and their main differences.
Shopify Inc. Overview
Shopify Inc. is a commerce company headquartered in Ottawa, Canada, offering a comprehensive commerce platform that enables merchants to manage and sell products through multiple sales channels globally. Its platform supports web and mobile storefronts, physical retail, social media, and other marketplaces, while also providing merchant solutions such as payments, shipping, and working capital. Founded in 2004, Shopify serves a broad range of merchants with tools to optimize inventory, orders, and customer relationships.
Figma, Inc. Overview
Figma, Inc., based in San Francisco, USA, develops a browser-based collaborative design tool tailored for user interface creation and product development teams. Its offerings include Figma Design, Dev Mode, FigJam, and AI-powered Figma Make, enabling streamlined prototyping, design inspection, and presentation. Founded in 2012, Figma focuses on enhancing team collaboration and creativity through its integrated design ecosystem within the technology sector.
Key similarities and differences
Both Shopify and Figma operate in the software application industry, leveraging cloud-based platforms to serve global users. Shopify concentrates on e-commerce facilitation and merchant services, while Figma specializes in collaborative design and product development tools. Shopify has a significantly larger market capitalization and workforce compared to Figma, reflecting its broader commercial scope, whereas Figma emphasizes innovative design technology with a smaller, more focused team.
Income Statement Comparison
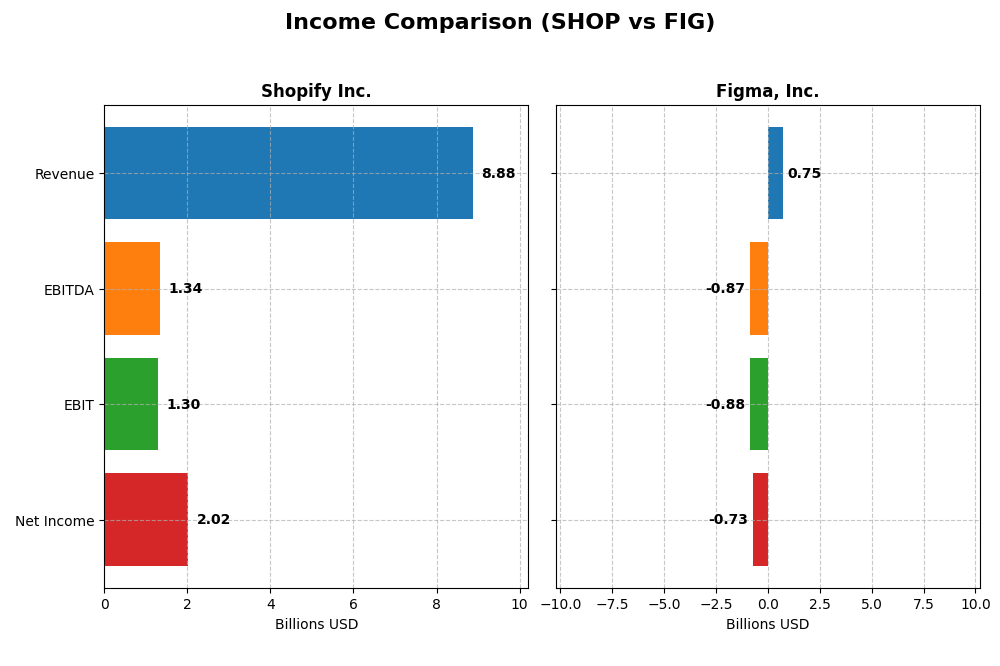
The table below compares key income statement metrics for Shopify Inc. and Figma, Inc. for their most recent fiscal year, highlighting differences in scale and profitability.
| Metric | Shopify Inc. (SHOP) | Figma, Inc. (FIG) |
|---|---|---|
| Market Cap | 205B | 15B |
| Revenue | 8.88B | 749M |
| EBITDA | 1.34B | -870M |
| EBIT | 1.30B | -877M |
| Net Income | 2.02B | -732M |
| EPS | 1.56 | -3.11 |
| Fiscal Year | 2024 | 2024 |
Income Statement Interpretations
Shopify Inc.
Shopify’s revenue and net income showed strong growth from 2020 to 2024, with revenue more than doubling to 8.88B and net income surging to 2.02B in 2024. Margins improved notably, with a gross margin above 50% and net margin expanding to 22.74%. The latest year’s performance highlights significant margin and earnings growth, reflecting operational efficiency and increased profitability.
Figma, Inc.
Figma’s revenue increased sharply by 48.36% to 749M in 2024, but the company reported a net loss of 732M, reflecting ongoing investment phases. Despite a high gross margin of 88.32%, operating and net margins remained negative and worsened year-over-year. The recent year shows strong top-line growth but continued challenges in controlling operating expenses and profitability.
Which one has the stronger fundamentals?
Shopify demonstrates stronger fundamentals with consistent revenue and net income growth, favorable margins, and positive earnings trends over five years. Conversely, Figma’s rapid revenue growth is overshadowed by persistent net losses and unfavorable margins. Shopify’s stable profitability and margin expansions contrast with Figma’s ongoing operating deficits and negative net margin trajectory.
Financial Ratios Comparison
The table below presents a side-by-side comparison of key financial ratios for Shopify Inc. and Figma, Inc. based on their most recent fiscal year data from 2024.
| Ratios | Shopify Inc. (SHOP) | Figma, Inc. (FIG) |
|---|---|---|
| ROE | 17.5% | -55.3% |
| ROIC | 7.5% | -59.7% |
| P/E | 68.2 | -70.7 |
| P/B | 11.9 | 39.1 |
| Current Ratio | 3.71 | 3.66 |
| Quick Ratio | 3.70 | 3.66 |
| D/E | 0.097 | 0.022 |
| Debt-to-Assets | 8.1% | 1.6% |
| Interest Coverage | 0 | 0 |
| Asset Turnover | 0.64 | 0.42 |
| Fixed Asset Turnover | 63.4 | 17.1 |
| Payout Ratio | 0 | 0 |
| Dividend Yield | 0 | 0 |
Interpretation of the Ratios
Shopify Inc.
Shopify displays a mix of strong and weak ratios. Its net margin of 22.74% and ROE of 17.47% are favorable, indicating profitability and efficient equity use, while a high P/E of 68.18 and P/B of 11.91 are less attractive. The company’s current ratio of 3.71 is marked unfavorable despite a favorable quick ratio. Shopify does not pay dividends, focusing on reinvestment and growth without share buybacks.
Figma, Inc.
Figma’s ratios reveal challenges with a negative net margin of -97.74% and ROE of -55.29%, reflecting losses and weak profitability. However, its low debt-to-assets of 1.6% and debt-to-equity of 0.02 are favorable, showing low leverage. The company also lacks dividends, likely due to ongoing reinvestment and a high-growth phase, with no share buyback activity reported.
Which one has the best ratios?
Shopify presents a slightly favorable overall ratio profile, balancing profitability and solid equity returns despite some valuation concerns. Figma’s ratios are mostly unfavorable, burdened by significant losses and weak returns, though it maintains low leverage. Based on these evaluations, Shopify has the more robust ratio set for fiscal year 2024.
Strategic Positioning
This section compares the strategic positioning of Shopify Inc. and Figma, Inc. regarding Market position, Key segments, and Exposure to technological disruption:
Shopify Inc.
- Large market cap of 204B in commerce software, facing high competitive pressure globally.
- Key segments include merchant solutions and subscription services driving commerce platform growth.
- Exposure to technological disruption through evolving e-commerce and payment processing tech.
Figma, Inc.
- Smaller market cap of 14.8B, operating in UI design software with significant competitive risks.
- Focuses on collaborative UI design tools, prototyping, and AI-driven product development tools.
- Faces disruption risks in fast-evolving design software and AI integration in product workflows.
Shopify Inc. vs Figma, Inc. Positioning
Shopify exhibits a diversified commerce platform strategy across multiple regions and service categories, while Figma concentrates on design collaboration software with emerging AI tools. Shopify’s scale supports broad market reach; Figma’s focus targets niche design productivity.
Which has the best competitive advantage?
Both companies are currently shedding value relative to their costs of capital. Shopify shows improving profitability trends, whereas Figma’s profitability is declining, indicating Shopify holds a less unfavorable competitive advantage based on MOAT evaluation.
Stock Comparison
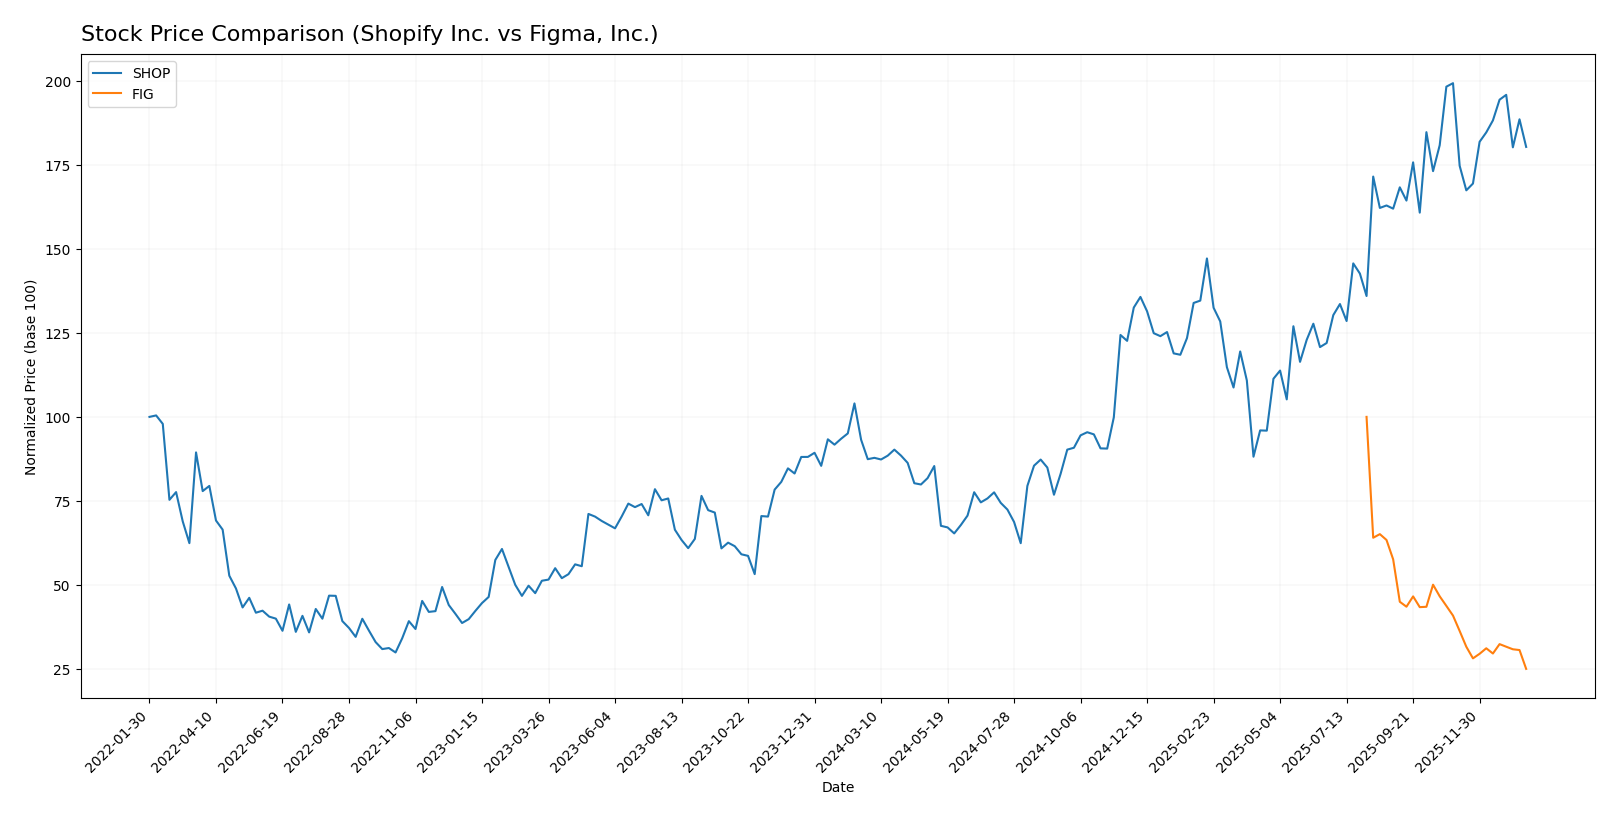
The stock price movements of Shopify Inc. and Figma, Inc. over the past year reveal contrasting dynamics, with Shopify showing strong gains despite recent deceleration, while Figma experiences a sustained decline with accelerating losses.
Trend Analysis
Shopify Inc. exhibits a bullish trend over the past 12 months with a 106.34% price increase, though the upward momentum is decelerating. The stock’s volatility is relatively high with a standard deviation of 33.7, peaking at 173.86 and bottoming at 54.43.
Figma, Inc. has faced a bearish trend with a 75.01% decline in price over the same period, marked by accelerating downward movement. Its volatility is moderate at 19.9 standard deviation, with the highest price at 122.0 and the lowest at 30.49.
Comparatively, Shopify has delivered the highest market performance with a strong positive return, whereas Figma’s stock shows significant depreciation and weaker investor demand.
Target Prices
Analysts provide a clear consensus on target prices for Shopify Inc. and Figma, Inc., indicating potential upside from current levels.
| Company | Target High | Target Low | Consensus |
|---|---|---|---|
| Shopify Inc. | 200 | 140 | 186.24 |
| Figma, Inc. | 52 | 38 | 43.6 |
Shopify’s consensus target of 186.24 suggests a moderate upside from its current price of 157.15 USD, while Figma’s consensus at 43.6 indicates analysts expect the stock to rise above its current 30.47 USD price.
Analyst Opinions Comparison
This section compares analysts’ ratings and grades for Shopify Inc. and Figma, Inc.:
Rating Comparison
Shopify Inc. Rating
- Rating: B, considered very favorable by analysts.
- Discounted Cash Flow Score: Moderate at 3.
- Return on Equity Score: Favorable at 4.
- Return on Assets Score: Very favorable at 5.
- Debt To Equity Score: Moderate at 3.
- Overall Score: Moderate at 3.
Figma, Inc. Rating
- Rating: C+, also considered very favorable.
- Discounted Cash Flow Score: Favorable at 4.
- Return on Equity Score: Very unfavorable at 1.
- Return on Assets Score: Very unfavorable at 1.
- Debt To Equity Score: Favorable at 4.
- Overall Score: Moderate at 2.
Which one is the best rated?
Based strictly on the provided data, Shopify Inc. holds a higher overall rating (B vs. C+) and stronger profitability metrics (ROE and ROA) compared to Figma, Inc., which shows better debt management but lower profitability scores.
Scores Comparison
Here is a comparison of the Altman Z-Score and Piotroski Score for Shopify Inc. and Figma, Inc.:
SHOP Scores
- Altman Z-Score of 50.42, indicating a strong safe zone rating
- Piotroski Score of 6, reflecting average financial strength
FIG Scores
- Altman Z-Score of 14.34, also in the safe zone but lower than SHOP
- Piotroski Score of 4, indicating average financial strength
Which company has the best scores?
Based on the provided data, Shopify has a significantly higher Altman Z-Score, indicating stronger financial stability. Both companies have average Piotroski Scores, but Shopify’s score is higher, suggesting relatively better financial health.
Grades Comparison
Here is the detailed comparison of recent grades and rating trends for Shopify Inc. and Figma, Inc.:
Shopify Inc. Grades
The following table summarizes recent grades assigned to Shopify Inc. by reputable grading companies.
| Grading Company | Action | New Grade | Date |
|---|---|---|---|
| Scotiabank | Upgrade | Sector Outperform | 2026-01-08 |
| Wolfe Research | Downgrade | Peer Perform | 2026-01-06 |
| Wells Fargo | Maintain | Overweight | 2025-12-17 |
| Truist Securities | Maintain | Hold | 2025-11-05 |
| CIBC | Maintain | Outperform | 2025-11-05 |
| Cantor Fitzgerald | Maintain | Neutral | 2025-11-05 |
| DA Davidson | Maintain | Buy | 2025-11-05 |
| Scotiabank | Maintain | Sector Perform | 2025-11-05 |
| Needham | Maintain | Buy | 2025-11-05 |
| JP Morgan | Maintain | Overweight | 2025-11-05 |
Shopify’s grades show a mixture of “Buy,” “Overweight,” and “Outperform,” with one recent upgrade and one downgrade, indicating a generally positive but cautious sentiment.
Figma, Inc. Grades
Below is the summary of recent grading activity for Figma, Inc. from recognized grading firms.
| Grading Company | Action | New Grade | Date |
|---|---|---|---|
| Morgan Stanley | Maintain | Equal Weight | 2026-01-15 |
| Wells Fargo | Upgrade | Overweight | 2026-01-08 |
| RBC Capital | Maintain | Sector Perform | 2026-01-05 |
| Goldman Sachs | Maintain | Neutral | 2025-11-07 |
| JP Morgan | Maintain | Neutral | 2025-11-06 |
| Piper Sandler | Maintain | Overweight | 2025-11-06 |
| Wells Fargo | Maintain | Equal Weight | 2025-11-05 |
| Wells Fargo | Maintain | Equal Weight | 2025-09-04 |
| Morgan Stanley | Maintain | Equal Weight | 2025-09-04 |
| RBC Capital | Maintain | Sector Perform | 2025-09-04 |
Figma’s ratings mostly hover around “Equal Weight,” “Neutral,” and “Sector Perform,” with a recent upgrade to “Overweight” by Wells Fargo, reflecting moderate confidence.
Which company has the best grades?
Shopify Inc. has received more frequent “Buy” and “Outperform” grades, while Figma, Inc.’s grades are predominantly “Hold” or “Equal Weight.” This suggests investors may perceive Shopify as having stronger growth potential, which could influence portfolio positioning toward Shopify for more aggressive return expectations.
Strengths and Weaknesses
Below is a comparison table highlighting the key strengths and weaknesses of Shopify Inc. (SHOP) and Figma, Inc. (FIG) based on their recent financial and strategic data.
| Criterion | Shopify Inc. (SHOP) | Figma, Inc. (FIG) |
|---|---|---|
| Diversification | Moderate, with significant revenue from Merchant and Subscription Solutions | Limited, focused on design software platform |
| Profitability | Positive net margin (22.74%), favorable ROE (17.47%), but ROIC below WACC (7.55% vs 17.1%) | Negative net margin (-97.74%), negative ROE (-55.29%), ROIC well below WACC |
| Innovation | Strong continuous innovation in e-commerce solutions and platform capabilities | High innovation in collaborative design tools but struggling to monetize effectively |
| Global presence | Established global footprint in e-commerce markets | Growing presence, mostly digital and SaaS-based |
| Market Share | Significant in e-commerce platform market, growing merchant base | Niche in design software, gaining market but with profitability challenges |
Shopify demonstrates solid profitability metrics and strong market presence with a diversified business model, though it currently destroys value from a capital efficiency perspective. Figma, while innovative and growing its user base, faces major profitability and capital efficiency issues, reflecting higher risk for investors.
Risk Analysis
Below is a comparative table highlighting key risk factors for Shopify Inc. (SHOP) and Figma, Inc. (FIG) based on the most recent 2024 data:
| Metric | Shopify Inc. (SHOP) | Figma, Inc. (FIG) |
|---|---|---|
| Market Risk | High beta (2.84) indicates strong sensitivity to market swings | Negative beta (-3.80) suggests inverse relation but high volatility |
| Debt level | Low debt-to-equity ratio (0.1), low debt to assets (8.09%) | Very low debt level (0.02 D/E), minimal debt-to-assets (1.6%) |
| Regulatory Risk | Moderate, operates globally with exposure to multiple jurisdictions | Moderate, US-focused but early-stage IPO exposure |
| Operational Risk | Large scale with 8,100 employees, risk of execution complexity | Smaller scale (1,646 employees), risk tied to rapid growth execution |
| Environmental Risk | Moderate; technology sector with limited direct environmental impact | Moderate; similar sector profile, limited direct environmental impact |
| Geopolitical Risk | Exposure due to global operations including emerging markets | Primarily US operations, less geopolitical exposure |
The most impactful and likely risks are Shopify’s market risk due to its high beta, which can amplify price swings, and Figma’s operational risk as a newer public company with negative profitability and volatility. Shopify’s low debt levels reduce financial risk, whereas Figma’s negative margins and unfavorable profitability ratios highlight business model and execution risks.
Which Stock to Choose?
Shopify Inc. (SHOP) shows strong income growth with a 25.78% revenue increase in 2024 and favorable profitability, including a 22.74% net margin. Financial ratios are slightly favorable overall, with solid returns on equity (17.47%) and assets, low debt levels, and a “B” rating reflecting very favorable strength despite some valuation concerns.
Figma, Inc. (FIG) reports high gross margin (88.32%) but unfavorable net and EBIT margins, with negative returns on equity and invested capital. Its financial ratios are mostly unfavorable, reflecting value destruction and a “C+” rating indicating moderate overall strength, alongside a declining profitability trend and bearish stock price movement.
For investors prioritizing growth and improving profitability, Shopify’s favorable income and ratio trends might appear more attractive. Conversely, those focused on innovation or willing to accept higher risk could interpret Figma’s profile as a developing opportunity despite current value erosion and financial challenges.
Disclaimer: Investment carries a risk of loss of initial capital. The past performance is not a reliable indicator of future results. Be sure to understand risks before making an investment decision.
Go Further
I encourage you to read the complete analyses of Shopify Inc. and Figma, Inc. to enhance your investment decisions: