In the dynamic world of software applications, Salesforce, Inc. (CRM) and Figma, Inc. (FIG) stand out as influential players driving innovation. Both headquartered in San Francisco, they serve overlapping markets with powerful tools—Salesforce in customer relationship management and enterprise solutions, Figma in collaborative design and product development. This article will explore their strengths and strategies to help you decide which company merits a spot in your investment portfolio.
Table of contents
Companies Overview
I will begin the comparison between Salesforce and Figma by providing an overview of these two companies and their main differences.
Salesforce Overview
Salesforce, Inc. focuses on customer relationship management technology that connects companies and customers globally. Its Customer 360 platform enables collaboration to deliver unified customer experiences. Salesforce offers services such as sales data management, personalized customer support, marketing automation, commerce solutions, analytics with Tableau, and integration via MuleSoft. Founded in 1999 and based in San Francisco, it employs over 76K people and serves various industries including financial services and healthcare.
Figma Overview
Figma, Inc. develops a browser-based collaborative design tool aimed at design and development teams. Its offerings include Figma Design for UI creation, Dev Mode for code inspection, FigJam for idea alignment, and AI-powered Figma Make for prototyping. Founded in 2012 and headquartered in San Francisco, it has about 1.6K employees. Figma’s platform focuses on streamlining product development and creative collaboration through cloud-based applications.
Key similarities and differences
Both Salesforce and Figma operate in the software application industry from San Francisco, focusing on cloud-based platforms that enhance collaboration and productivity. Salesforce targets a broad enterprise market with CRM, analytics, marketing, and integration services, while Figma specializes in design and prototyping tools for creative teams. Salesforce’s scale and product diversity contrast with Figma’s niche focus and smaller workforce.
Income Statement Comparison
The table below presents a side-by-side comparison of key income statement metrics for Salesforce, Inc. and Figma, Inc. based on their most recent fiscal year data.
| Metric | Salesforce, Inc. (CRM) | Figma, Inc. (FIG) |
|---|---|---|
| Market Cap | 218.2B | 15.1B |
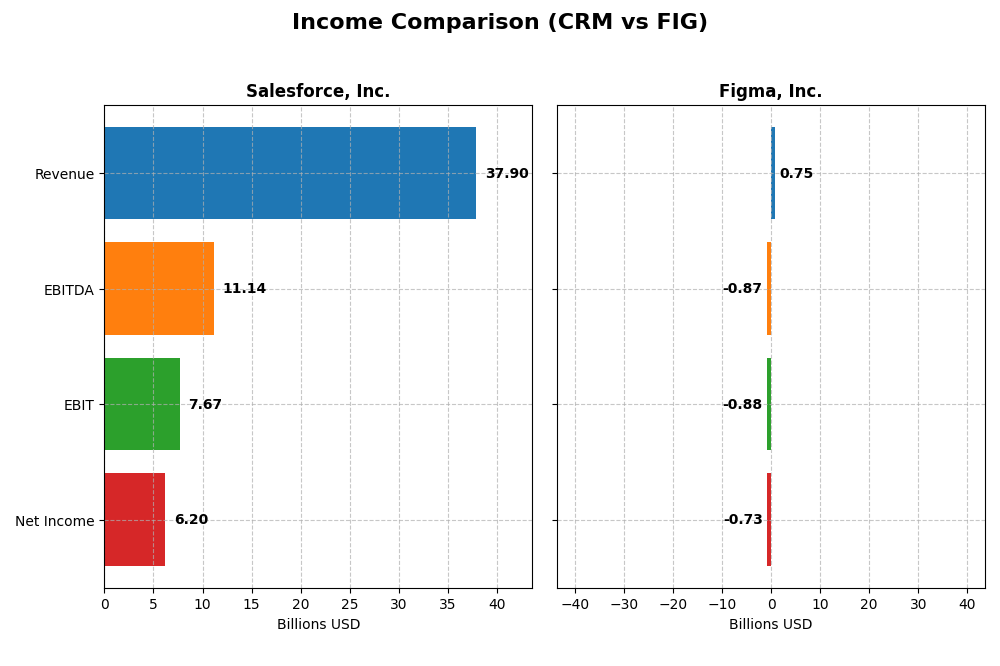
| Revenue | 37.9B | 749M |
| EBITDA | 11.1B | -870M |
| EBIT | 7.7B | -877M |
| Net Income | 6.2B | -732M |
| EPS | 6.44 | -3.11 |
| Fiscal Year | 2025 | 2024 |
Income Statement Interpretations
Salesforce, Inc.
Salesforce’s revenue and net income showed strong growth from 2021 to 2025, with revenue increasing from $21.3B to $37.9B and net income rising from $4.07B to $6.2B. Margins remained generally favorable, with a gross margin of 77.19% and a net margin of 16.35% in 2025. The latest year saw an 8.72% revenue growth and a 37.82% increase in net margin, indicating improved profitability.
Figma, Inc.
Figma experienced a significant revenue jump from $505M in 2023 to $749M in 2024, a 48.36% increase. However, net income declined sharply to a loss of $732M in 2024 from a profit of $286M the previous year. Despite a high gross margin of 88.32%, the company’s EBIT margin was deeply negative at -117.15%, reflecting substantial operating losses and deteriorating net margins.
Which one has the stronger fundamentals?
Salesforce displays stronger fundamentals with consistent revenue and net income growth, favorable margins, and positive earnings per share trends. In contrast, Figma’s rapid revenue growth is overshadowed by significant operating losses and negative net income trends. Salesforce’s robust profitability metrics and margin stability suggest a more solid income statement foundation compared to Figma’s current challenges.
Financial Ratios Comparison
The table below presents a side-by-side comparison of key financial ratios for Salesforce, Inc. and Figma, Inc. based on their most recent fiscal year data.
| Ratios | Salesforce, Inc. (CRM) | Figma, Inc. (FIG) |
|---|---|---|
| ROE | 10.13% | -55.29% |
| ROIC | 7.95% | -59.68% |
| P/E | 53.04 | -70.71 |
| P/B | 5.37 | 39.10 |
| Current Ratio | 1.06 | 3.66 |
| Quick Ratio | 1.06 | 3.66 |
| D/E | 0.19 | 0.02 |
| Debt-to-Assets | 11.07% | 1.60% |
| Interest Coverage | 26.49 | 0 |
| Asset Turnover | 0.37 | 0.42 |
| Fixed Asset Turnover | 7.03 | 17.09 |
| Payout ratio | 24.80% | 0 |
| Dividend yield | 0.47% | 0 |
Interpretation of the Ratios
Salesforce, Inc.
Salesforce exhibits a mixed ratio profile with strong debt management and interest coverage, yet unfavorable price multiples like P/E of 53.04 and P/B of 5.37. Asset turnover remains weak, signaling potential inefficiency. The company pays dividends with a low yield of 0.47%, reflecting modest shareholder returns amid a slightly favorable overall ratio outlook.
Figma, Inc.
Figma shows predominantly unfavorable profitability ratios including a negative net margin of -97.74% and return on equity of -55.29%, indicating operational challenges. Its liquidity and leverage ratios are favorable, with a high quick ratio of 3.66 and low debt. Figma does not pay dividends, likely due to its reinvestment focus during a high growth phase.
Which one has the best ratios?
Salesforce holds a slightly favorable ratio profile with balanced leverage, coverage, and moderate profitability, despite valuation concerns. Figma faces significant profitability weaknesses and no dividend payouts, resulting in an overall unfavorable ratio evaluation. Salesforce’s ratios suggest a relatively stronger financial position compared to Figma’s current metrics.
Strategic Positioning
This section compares the strategic positioning of Salesforce and Figma, focusing on market position, key segments, and exposure to technological disruption:
Salesforce, Inc.
- Leading CRM technology provider with broad competitive pressure in enterprise software market.
- Diverse segments including Sales, Service, Marketing, Commerce, Integration, Analytics, and Platform services.
- Moderate exposure to disruption with established platform integrating analytics, AI, and collaboration tools.
Figma, Inc.
- Emerging browser-based design tool with niche focus on collaborative UI design teams.
- Concentrated on design collaboration, prototyping, and AI-powered product development tools.
- High exposure to disruption relying on AI tools and browser-based innovation in design workflows.
Salesforce vs Figma Positioning
Salesforce demonstrates a diversified business model across multiple cloud services and industries, supporting broad revenue streams. Figma, by contrast, concentrates on UI/UX design collaboration with innovative AI features but operates in a narrower segment with less scale.
Which has the best competitive advantage?
Both companies are currently shedding value as ROIC is below WACC; Salesforce shows improving profitability, whereas Figma faces declining returns, indicating Salesforce holds a relatively stronger economic moat despite challenges.
Stock Comparison
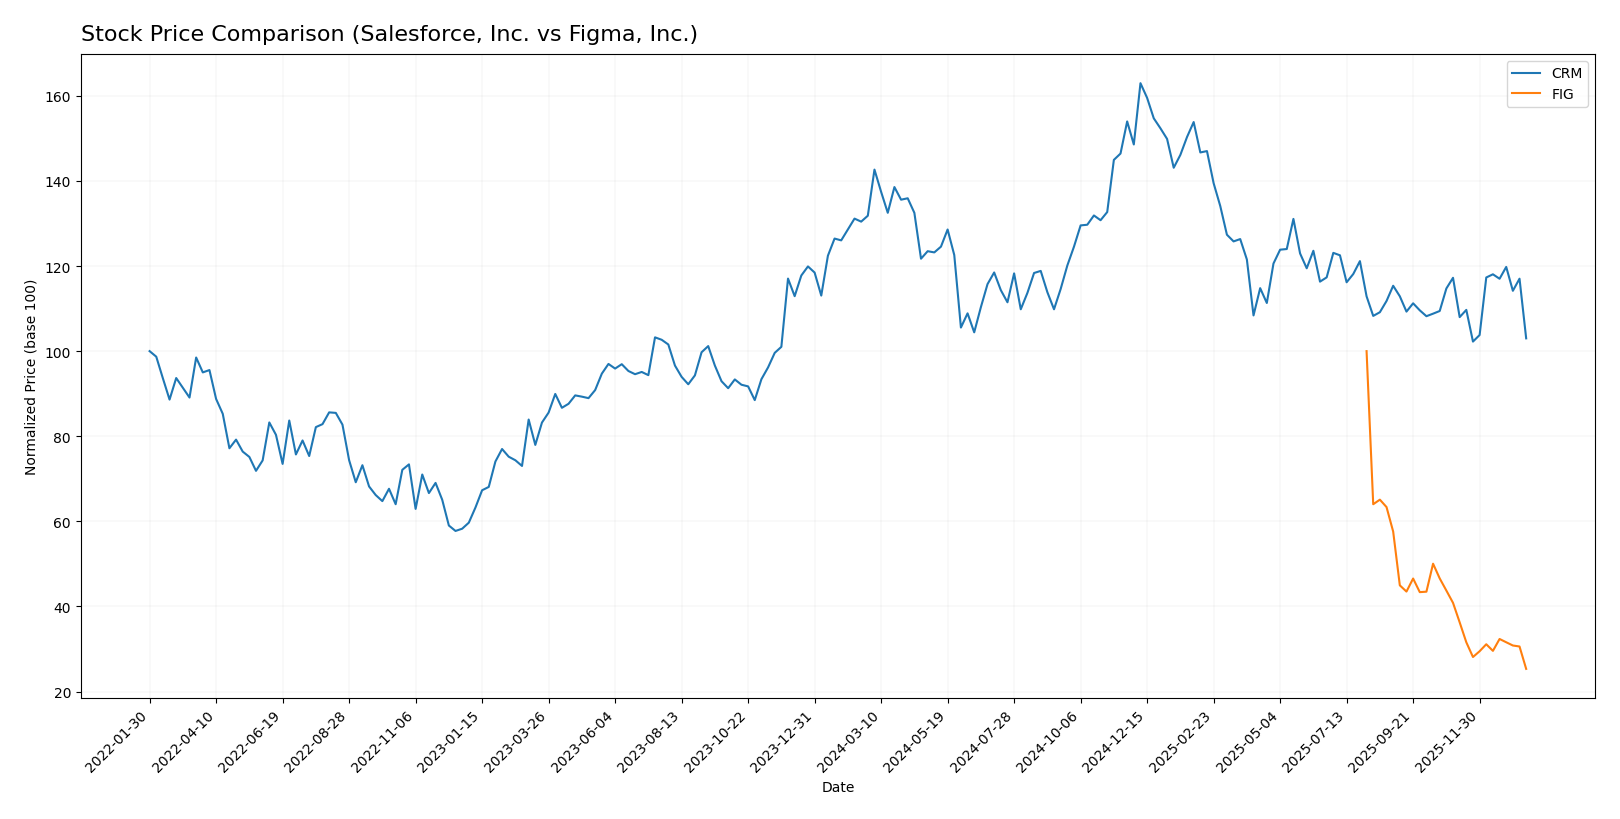
The stock price performance of Salesforce, Inc. (CRM) and Figma, Inc. (FIG) over the past 12 months reveals significant declines with accelerating bearish trends, marked by notable price drops and contrasting volume dynamics.
Trend Analysis
Salesforce, Inc. (CRM) showed a 21.86% decrease in stock price over the past year, indicating a bearish trend with accelerating downward momentum and a high volatility level (std deviation 31.79). Recent months show a milder 12.14% decline with slight upward slope.
Figma, Inc. (FIG) experienced a sharper 74.66% price drop over the same period, confirming an accelerating bearish trend with moderate volatility (std deviation 19.89). The recent trend worsened with a 37.98% fall and a negative slope.
Comparing both, Salesforce’s stock outperformed Figma’s in market performance, as CRM’s overall loss was significantly smaller than FIG’s steep decline over the past year.
Target Prices
The current analyst consensus presents optimistic target prices for both Salesforce, Inc. and Figma, Inc.
| Company | Target High | Target Low | Consensus |
|---|---|---|---|
| Salesforce, Inc. | 400 | 250 | 324.17 |
| Figma, Inc. | 52 | 38 | 43.6 |
Analysts expect Salesforce’s stock price to rise significantly from its current 228.28 USD, while Figma’s consensus target also indicates potential upside from its current 30.99 USD.
Analyst Opinions Comparison
This section compares analysts’ ratings and grades for Salesforce, Inc. and Figma, Inc.:
Rating Comparison
Salesforce, Inc. Rating
- Rating: B+, assessed as Very Favorable
- Discounted Cash Flow Score: 4, favorable rating
- ROE Score: 4, favorable rating
- ROA Score: 4, favorable rating
- Debt To Equity Score: 3, moderate rating
- Overall Score: 3, moderate rating
Figma, Inc. Rating
- Rating: C+, assessed as Very Favorable
- Discounted Cash Flow Score: 4, favorable rating
- ROE Score: 1, very unfavorable rating
- ROA Score: 1, very unfavorable rating
- Debt To Equity Score: 4, favorable rating
- Overall Score: 2, moderate rating
Which one is the best rated?
Salesforce has stronger ratings overall with higher ROE, ROA, and overall scores, while Figma only matches Salesforce in discounted cash flow and has a better debt-to-equity score. Salesforce is clearly better rated based on this data.
Scores Comparison
Here is a comparison of Salesforce and Figma scores based on the Altman Z-Score and Piotroski Score:
Salesforce Scores
- Altman Z-Score: 5.26, indicating a safe zone with low bankruptcy risk.
- Piotroski Score: 7, reflecting strong financial health and value.
Figma Scores
- Altman Z-Score: 14.34, indicating a safe zone and very low bankruptcy risk.
- Piotroski Score: 4, reflecting average financial strength and value.
Which company has the best scores?
Figma shows a much higher Altman Z-Score, indicating stronger bankruptcy safety. Salesforce has a higher Piotroski Score, suggesting better overall financial strength. Each company leads in different score categories.
Grades Comparison
The following grades comparison summarizes the latest analyst ratings and consensus for Salesforce, Inc. and Figma, Inc.:
Salesforce, Inc. Grades
This table presents recent grades from reputable financial institutions for Salesforce, Inc.:
| Grading Company | Action | New Grade | Date |
|---|---|---|---|
| Barclays | Maintain | Overweight | 2026-01-12 |
| RBC Capital | Maintain | Sector Perform | 2026-01-05 |
| Morgan Stanley | Maintain | Overweight | 2025-12-09 |
| Citigroup | Maintain | Neutral | 2025-12-08 |
| DA Davidson | Maintain | Neutral | 2025-12-05 |
| Citizens | Maintain | Market Outperform | 2025-12-04 |
| Deutsche Bank | Maintain | Buy | 2025-12-04 |
| Wedbush | Maintain | Outperform | 2025-12-04 |
| Northland Capital Markets | Maintain | Market Perform | 2025-12-04 |
| Canaccord Genuity | Maintain | Buy | 2025-12-04 |
Salesforce shows a consistent trend of positive to neutral grades, predominantly in the “Buy” to “Overweight” range, indicating stable analyst confidence.
Figma, Inc. Grades
This table presents recent grades from reputable financial institutions for Figma, Inc.:
| Grading Company | Action | New Grade | Date |
|---|---|---|---|
| Morgan Stanley | Maintain | Equal Weight | 2026-01-15 |
| Wells Fargo | Upgrade | Overweight | 2026-01-08 |
| RBC Capital | Maintain | Sector Perform | 2026-01-05 |
| Goldman Sachs | Maintain | Neutral | 2025-11-07 |
| JP Morgan | Maintain | Neutral | 2025-11-06 |
| Piper Sandler | Maintain | Overweight | 2025-11-06 |
| Wells Fargo | Maintain | Equal Weight | 2025-11-05 |
| Wells Fargo | Maintain | Equal Weight | 2025-09-04 |
| Morgan Stanley | Maintain | Equal Weight | 2025-09-04 |
| RBC Capital | Maintain | Sector Perform | 2025-09-04 |
Figma’s grades cluster mainly around “Equal Weight” and “Sector Perform,” with one recent upgrade to “Overweight,” reflecting a more cautious but gradually improving outlook.
Which company has the best grades?
Salesforce, Inc. has received stronger and more consistent buy-side grades compared to Figma, Inc., which mainly holds neutral or moderate ratings. This suggests Salesforce is viewed more favorably by analysts, potentially implying higher confidence among investors in its near-term prospects.
Strengths and Weaknesses
Below is a comparison of Salesforce, Inc. (CRM) and Figma, Inc. (FIG) based on key investment criteria, reflecting their most recent financial and strategic data.
| Criterion | Salesforce, Inc. (CRM) | Figma, Inc. (FIG) |
|---|---|---|
| Diversification | Highly diversified product portfolio including Sales Cloud (8.3B), Service Cloud (9.1B), Marketing and Commerce Cloud (5.3B), and others | Limited diversification; primarily focused on design collaboration software |
| Profitability | Positive net margin of 16.35%, ROIC at 7.95% (neutral), but ROIC below WACC indicating value destruction | Strongly negative net margin (-97.74%) and ROIC (-59.68%), shedding value with declining profitability |
| Innovation | Continuous product expansion and integration capabilities; steady growth in ROIC trend | Early-stage innovation with high growth potential but currently unprofitable and declining ROIC |
| Global presence | Extensive global footprint with multiple business units generating billions in revenue | Smaller scale with limited international market penetration |
| Market Share | Leader in cloud CRM market with broad customer base | Growing presence in design software market but still niche compared to CRM giants |
Key takeaways: Salesforce demonstrates strength in diversification and steady growth in profitability despite current value destruction, indicating long-term potential. Figma, while innovative and promising, faces significant profitability challenges and a very unfavorable moat, signaling higher risk for investors.
Risk Analysis
Below is a comparative risk table for Salesforce, Inc. (CRM) and Figma, Inc. (FIG) based on the most recent data from 2025 and 2024 respectively:
| Metric | Salesforce, Inc. (CRM) | Figma, Inc. (FIG) |
|---|---|---|
| Market Risk | Moderate beta of 1.27; exposure to tech sector volatility | High negative beta of -3.80; very volatile stock performance |
| Debt Level | Low debt-to-equity ratio (0.19), favorable leverage | Very low debt-to-equity (0.02), minimal financial risk |
| Regulatory Risk | Moderate, given global operations and data privacy laws | Moderate, emerging tech with evolving regulations |
| Operational Risk | Large global workforce (76K employees); complexity in integration | Smaller scale (1.6K employees), but rapid growth poses operational scaling risks |
| Environmental Risk | Moderate due to corporate sustainability programs | Low, but increasing scrutiny as a tech company |
| Geopolitical Risk | US-based, exposed to international market tensions | US-based, similar exposure but smaller global footprint |
Salesforce faces moderate market and operational risks due to its large scale and sector volatility, but with strong debt management. Figma shows higher market risk due to extreme beta and weaker profitability metrics, despite low debt. Operational scaling and profitability are key risks for Figma moving forward.
Which Stock to Choose?
Salesforce, Inc. (CRM) has shown favorable income evolution with 8.72% revenue growth in the past year and a strong 78.31% over five years. Its profitability remains solid with a 16.35% net margin and a slightly favorable global ratios evaluation. Debt levels are low, supported by a favorable debt-to-equity ratio of 0.19, and the company holds a very favorable B+ rating.
Figma, Inc. (FIG) experienced a mixed income evolution with a 48.36% revenue increase but significant net margin losses and an unfavorable global ratios evaluation. While maintaining a low debt-to-equity ratio of 0.02, its profitability metrics are notably negative, reflected in a very unfavorable return on equity and a C+ rating that is moderate overall.
Which stock is most favorable for an investor might depend on risk tolerance and investment strategy: those focused on stable profitability and quality might find Salesforce’s slightly favorable ratios and very favorable rating more reassuring, whereas investors seeking high growth potential despite current losses may view Figma’s strong revenue growth and low debt as opportunities, although with higher risk.
Disclaimer: Investment carries a risk of loss of initial capital. The past performance is not a reliable indicator of future results. Be sure to understand risks before making an investment decision.
Go Further
I encourage you to read the complete analyses of Salesforce, Inc. and Figma, Inc. to enhance your investment decisions: