In the rapidly evolving software industry, PTC Inc. and Figma, Inc. stand out as innovators with overlapping market focuses on application software and digital collaboration tools. PTC, a seasoned player, drives digital transformation with robust industrial and product lifecycle solutions, while Figma, a newer entrant, revolutionizes design collaboration with cloud-based tools. This article will help you determine which company offers the most compelling investment opportunity in 2026.
Table of contents
Companies Overview
I will begin the comparison between PTC Inc. and Figma, Inc. by providing an overview of these two companies and their main differences.
PTC Overview
PTC Inc. is a technology company specializing in software and services with a global presence across the Americas, Europe, and Asia Pacific. Its mission focuses on enabling enterprises to digitally transform their operations through innovative platforms like ThingWorx and Vuforia, as well as product development tools such as Onshape and Creo. Founded in 1985 and headquartered in Boston, Massachusetts, PTC operates with over 7,500 employees and serves various industries through its comprehensive software portfolio.
Figma Overview
Figma, Inc. is a software company that develops a browser-based design tool aimed at helping design and development teams collaborate efficiently on user interface projects. Its product suite includes Figma Design, Dev Mode, FigJam, and AI-enhanced tools like Figma Make, designed to streamline product development and prototyping. Incorporated in 2012 and based in San Francisco, California, Figma employs around 1,650 people and went public in mid-2025, positioning itself as a leader in collaborative design software.
Key similarities and differences
Both PTC and Figma operate in the Software – Application industry, focusing on tools that support product design and development workflows. However, PTC offers a broader range of enterprise software solutions including product lifecycle management and augmented reality, targeting large-scale industrial transformation. In contrast, Figma concentrates on user interface design and team collaboration with a cloud-native, browser-based platform. Their business models reflect these focuses, with PTC emphasizing scalable enterprise solutions and Figma prioritizing collaborative, accessible design tools.
Income Statement Comparison
The table below compares key income statement metrics for PTC Inc. and Figma, Inc. for their most recent fiscal years, providing a snapshot of their financial performance.

| Metric | PTC Inc. (2025) | Figma, Inc. (2024) |
|---|---|---|
| Market Cap | 19.9B | 14.4B |
| Revenue | 2.74B | 749M |
| EBITDA | 1.13B | -870M |
| EBIT | 997M | -877M |
| Net Income | 734M | -732M |
| EPS | 6.18 | -3.11 |
| Fiscal Year | 2025 | 2024 |
Income Statement Interpretations
PTC Inc.
PTC Inc. demonstrated consistent revenue growth from $1.81B in 2021 to $2.74B in 2025, with net income rising from $477M to $734M. Margins remained robust, with gross margin at 83.76% and net margin at 26.8% in 2025. The recent year showed strong improvements in profitability, including a 19.18% revenue increase and a 63.66% net margin growth, signaling solid operational efficiency.
Figma, Inc.
Figma’s revenue increased sharply from $505M in 2023 to $749M in 2024, a 48.36% rise, yet net income turned negative, dropping to a net loss of $732M in 2024 from a profit of $286M in 2023. Despite a high gross margin of 88.32%, EBIT and net margins were deeply negative, reflecting heavy operating expenses and losses. The recent year highlighted significant profitability challenges amid rapid growth.
Which one has the stronger fundamentals?
PTC exhibits stronger fundamentals with favorable margin stability, consistent revenue and net income growth, and efficient cost management. In contrast, Figma shows strong top-line growth but suffers from large net losses and unfavorable margin trends. PTC’s positive earnings trajectory and margin improvements outweigh Figma’s current profitability struggles, indicating more solid income statement fundamentals.
Financial Ratios Comparison
The following table presents a side-by-side comparison of key financial ratios for PTC Inc. and Figma, Inc., based on their most recent full fiscal year data.
| Ratios | PTC Inc. (2025) | Figma, Inc. (2024) |
|---|---|---|
| ROE | 19.18% | -55.29% |
| ROIC | 14.43% | -59.68% |
| P/E | 33.19 | -70.71 |
| P/B | 6.37 | 39.10 |
| Current Ratio | 1.12 | 3.66 |
| Quick Ratio | 1.12 | 3.66 |
| D/E | 0.36 | 0.02 |
| Debt-to-Assets | 20.70% | 1.60% |
| Interest Coverage | 12.76 | 0 |
| Asset Turnover | 0.41 | 0.42 |
| Fixed Asset Turnover | 15.58 | 17.09 |
| Payout Ratio | 0 | 0 |
| Dividend Yield | 0% | 0% |
Interpretation of the Ratios
PTC Inc.
PTC displays generally strong financial ratios with favorable net margin at 26.8%, ROE at 19.18%, and ROIC at 14.43%, indicating solid profitability and efficient capital use. Some concerns include unfavorable valuations, with a PE of 33.19 and PB at 6.37. The company does not pay dividends, likely prioritizing reinvestment and growth, as indicated by zero dividend yield and no payout risk.
Figma, Inc.
Figma’s ratios reveal significant weaknesses, including a deeply negative net margin of -97.74%, ROE of -55.29%, and ROIC of -59.68%, signaling ongoing losses and inefficient capital deployment. Despite a low debt ratio and favorable WACC, its valuation metrics and interest coverage are unfavorable. Figma pays no dividends, reflecting its high-growth phase and continued reinvestment in R&D and expansion.
Which one has the best ratios?
Comparing both, PTC’s ratios are predominantly favorable, highlighting profitability, solid returns, and prudent leverage, despite some valuation concerns. Figma exhibits mostly unfavorable ratios with substantial losses and negative returns, consistent with a high-growth startup profile. Overall, PTC has the stronger and more stable ratio profile based on the available data.
Strategic Positioning
This section compares the strategic positioning of PTC and Figma, including market position, key segments, and exposure to technological disruption:
PTC
- Established software company with $19.9B market cap, facing moderate competitive pressure in application software.
- Diverse software and services segments: licenses, technology services, support, and cloud services driving revenue growth.
- Offers ThingWorx IoT platform, AR visualization, SaaS product development, and lifecycle management software.
Figma
- Newer entrant with $14.4B market cap, experiencing high competitive pressure in collaborative design tools.
- Focused on browser-based UI design tools and AI-driven prototyping with a narrow product portfolio.
- Provides collaborative design, prototyping, presentation, and AI tools primarily for design teams.
PTC vs Figma Positioning
PTC’s diversified software portfolio spans multiple segments, offering stability and scalability, whereas Figma’s concentrated focus on collaborative design tools targets a specialized market but may limit diversification. PTC benefits from broader product applications, Figma from innovation in design collaboration.
Which has the best competitive advantage?
PTC demonstrates a very favorable moat with growing ROIC above WACC, indicating durable competitive advantage and value creation. Figma shows a very unfavorable moat, with declining ROIC and value destruction, suggesting weaker competitive positioning.
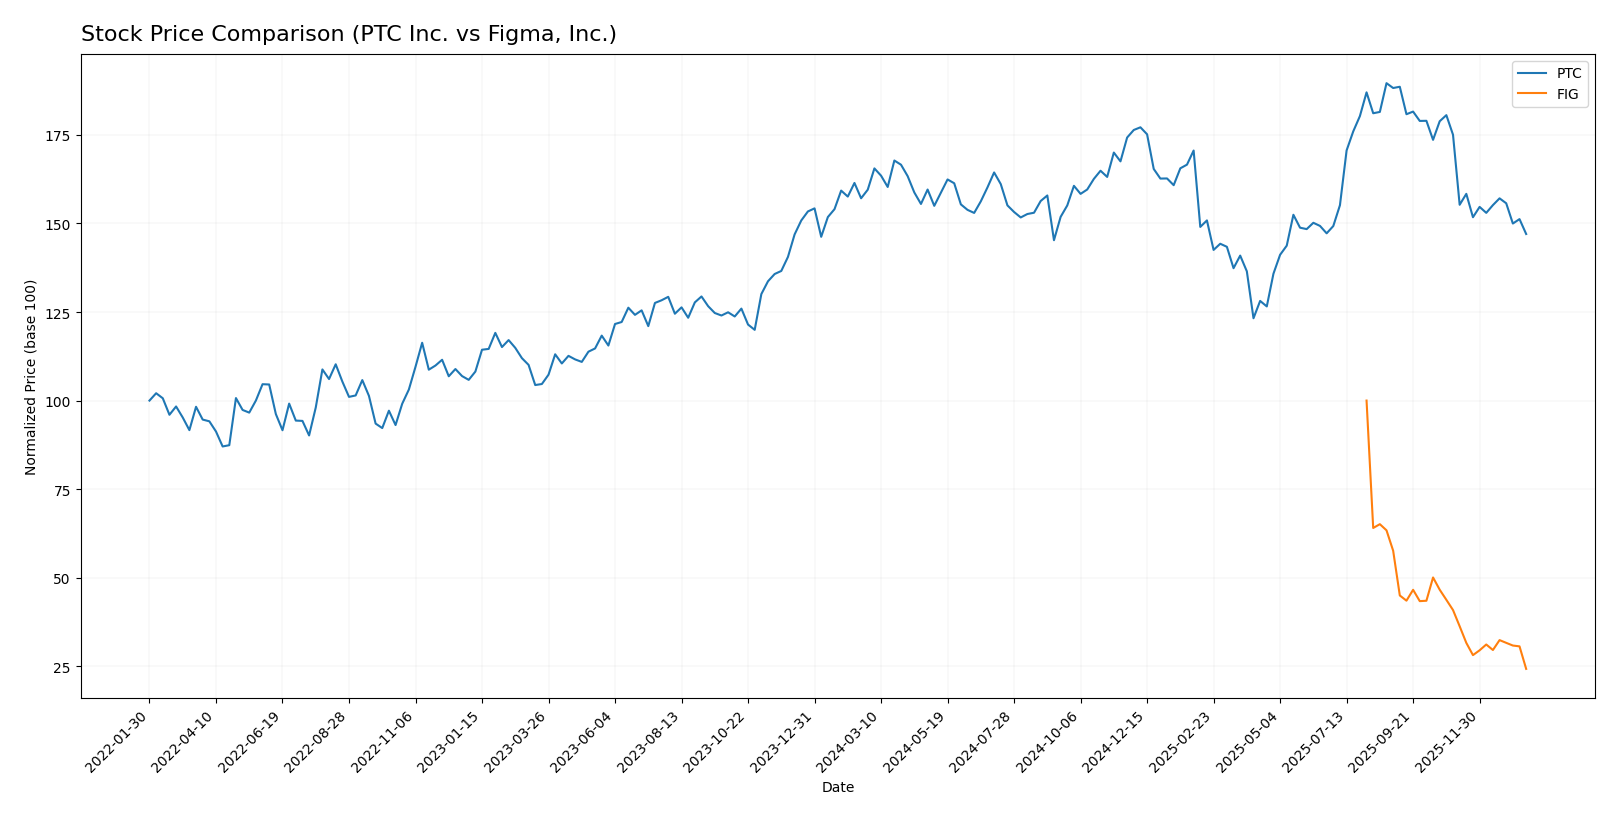
Stock Comparison
The stock price movements of PTC Inc. and Figma, Inc. over the past year reveal clear bearish trends, with notable differences in volatility, acceleration, and trading volumes that reflect distinct market dynamics.
Trend Analysis
PTC Inc.’s stock shows a bearish trend with a -7.84% price change over the past 12 months, accompanied by deceleration and moderate volatility (std. deviation 15.47). The stock peaked at 215.05 and bottomed at 139.77.
Figma, Inc. experienced a more severe bearish trend, with a -75.76% price drop over the same period. This decline accelerated, showing higher volatility (std. deviation 19.95), reaching a high of 122.0 and a low of 29.57.
Comparing both stocks, PTC has outperformed Figma, delivering a less severe decline and lower volatility, indicating a comparatively stronger market performance over the past year.
Target Prices
Analysts present a clear target price consensus for both PTC Inc. and Figma, Inc., reflecting varied but optimistic outlooks.
| Company | Target High | Target Low | Consensus |
|---|---|---|---|
| PTC Inc. | 255 | 120 | 213.25 |
| Figma, Inc. | 52 | 38 | 43.6 |
The consensus targets for PTC Inc. and Figma, Inc. suggest significant upside potential compared to their current prices of $166.75 and $29.57, respectively, indicating positive analyst expectations despite market fluctuations.
Analyst Opinions Comparison
This section compares analysts’ ratings and grades for PTC Inc. and Figma, Inc.:
Rating Comparison
PTC Rating
- Rating: B+ indicating a very favorable overall rating.
- Discounted Cash Flow Score: 4, showing a favorable valuation based on cash flow.
- ROE Score: 4, reflecting efficient profit generation from equity.
- ROA Score: 5, very favorable use of assets to generate earnings.
- Debt To Equity Score: 2, moderate financial risk with some leverage.
- Overall Score: 3, moderate overall financial standing.
FIG Rating
- Rating: C+ indicating a very favorable overall rating.
- Discounted Cash Flow Score: 4, also favorable for cash flow valuation.
- ROE Score: 1, indicating very unfavorable efficiency in generating profit.
- ROA Score: 1, very unfavorable asset utilization.
- Debt To Equity Score: 4, favorable financial stability with low leverage.
- Overall Score: 2, moderate but lower overall financial standing than PTC.
Which one is the best rated?
Based strictly on the provided data, PTC holds a higher rating (B+) and better overall score (3) compared to FIG’s C+ and overall score of 2. PTC excels notably in ROE and ROA, while FIG shows better debt to equity management.
Scores Comparison
Here is a comparison of the Altman Z-Score and Piotroski Score for both companies:
PTC Scores
- Altman Z-Score: 5.67, indicating a safe zone with low bankruptcy risk.
- Piotroski Score: 8, classified as very strong financial health.
FIG Scores
- Altman Z-Score: 14.34, indicating a safe zone with very low bankruptcy risk.
- Piotroski Score: 4, classified as average financial health.
Which company has the best scores?
Based on the provided data, FIG has a significantly higher Altman Z-Score, indicating lower bankruptcy risk, while PTC has a stronger Piotroski Score, showing better financial strength. Each company leads in a different score category.
Grades Comparison
The following presents a comparison of recent grades assigned to PTC Inc. and Figma, Inc.:
PTC Inc. Grades
This table shows recent grades from recognized grading companies for PTC Inc.:
| Grading Company | Action | New Grade | Date |
|---|---|---|---|
| Piper Sandler | Maintain | Neutral | 2025-11-07 |
| Rosenblatt | Maintain | Buy | 2025-11-06 |
| Rosenblatt | Maintain | Buy | 2025-10-30 |
| Oppenheimer | Maintain | Outperform | 2025-07-31 |
| Rosenblatt | Maintain | Buy | 2025-07-31 |
| Barclays | Maintain | Overweight | 2025-07-31 |
| Stifel | Maintain | Buy | 2025-07-31 |
| Keybanc | Maintain | Overweight | 2025-07-31 |
| RBC Capital | Maintain | Outperform | 2025-07-31 |
| Piper Sandler | Maintain | Neutral | 2025-07-31 |
PTC Inc.’s grades consistently reflect a positive outlook, predominantly with Buy, Outperform, and Overweight ratings maintained across multiple firms.
Figma, Inc. Grades
This table shows recent grades from recognized grading companies for Figma, Inc.:
| Grading Company | Action | New Grade | Date |
|---|---|---|---|
| Morgan Stanley | Maintain | Equal Weight | 2026-01-15 |
| Wells Fargo | Upgrade | Overweight | 2026-01-08 |
| RBC Capital | Maintain | Sector Perform | 2026-01-05 |
| Goldman Sachs | Maintain | Neutral | 2025-11-07 |
| JP Morgan | Maintain | Neutral | 2025-11-06 |
| Piper Sandler | Maintain | Overweight | 2025-11-06 |
| Wells Fargo | Maintain | Equal Weight | 2025-11-05 |
| Wells Fargo | Maintain | Equal Weight | 2025-09-04 |
| Morgan Stanley | Maintain | Equal Weight | 2025-09-04 |
| RBC Capital | Maintain | Sector Perform | 2025-09-04 |
Figma, Inc.’s grades present a moderate stance, mostly ranging between Equal Weight, Neutral, and Sector Perform ratings, with one recent upgrade to Overweight.
Which company has the best grades?
PTC Inc. has received generally stronger grades, dominated by Buy and Outperform ratings, whereas Figma, Inc. mostly holds neutral to moderate ratings. This suggests PTC is viewed more favorably by analysts, potentially influencing investor sentiment towards higher confidence in PTC’s prospects.
Strengths and Weaknesses
Here is a comparative overview of key strengths and weaknesses for PTC Inc. and Figma, Inc. based on the most recent data and financial evaluations.
| Criterion | PTC Inc. | Figma, Inc. |
|---|---|---|
| Diversification | Strong revenue mix: License (1.16B), Support & Cloud Services (1.47B), Technology Service (107M) | Limited diversification, primarily focused on design software |
| Profitability | High net margin (26.8%), ROIC 14.43%, favorable profitability ratios | Negative net margin (-97.7%), ROIC -59.7%, shedding value |
| Innovation | Durable competitive advantage with growing ROIC (+42.4%) | Declining ROIC (-1013.9%), value destruction indicates challenges in innovation efficiency |
| Global presence | Established global footprint across multiple sectors | Smaller, likely more regional or niche presence |
| Market Share | Solid market position with increasing profitability | Struggling to gain or sustain market share due to financial losses |
PTC’s strengths lie in its diversified revenue streams, strong profitability, and durable competitive advantage, making it a value creator. Conversely, Figma faces significant profitability challenges and declining returns, signaling caution for investors despite its innovative market niche.
Risk Analysis
Below is a comparative table outlining key risks for PTC Inc. and Figma, Inc. as of the most recent data available:
| Metric | PTC Inc. | Figma, Inc. |
|---|---|---|
| Market Risk | Moderate (Beta 1.01) | High volatility (Beta -3.80) |
| Debt level | Low (D/E 0.36) | Very low (D/E 0.02) |
| Regulatory Risk | Moderate | Moderate |
| Operational Risk | Moderate | High (new IPO, scaling challenges) |
| Environmental Risk | Low | Low |
| Geopolitical Risk | Moderate (global operations) | Moderate (US-centric) |
PTC shows moderate market and operational risks with a solid debt profile, while Figma faces higher market volatility and operational risks due to its young IPO status and negative profitability. Regulatory and geopolitical risks remain moderate for both. Investors should watch Figma’s path to profitability and PTC’s market valuation metrics.
Which Stock to Choose?
PTC Inc. shows a favorable income evolution with strong revenue and net income growth, supported by excellent profitability margins. Its financial ratios reveal a robust balance sheet, manageable debt, and a very favorable global rating of B+. The company demonstrates a durable competitive advantage with a very favorable moat and strong scores indicating financial stability.
Figma, Inc. presents a mixed financial picture: while revenue growth is significant, it suffers from negative profitability and value destruction as reflected in unfavorable income statement metrics. Its financial ratios are mostly unfavorable, despite low debt levels and a very unfavorable moat. The company holds a moderate overall rating of C+ with average financial strength scores.
For investors prioritizing value creation and financial stability, PTC might appear more favorable given its strong profitability, positive rating, and durable competitive advantage. Conversely, investors focused on high growth potential and willing to tolerate higher risk could interpret Figma’s rapid revenue expansion as attractive despite current profitability challenges.
Disclaimer: Investment carries a risk of loss of initial capital. The past performance is not a reliable indicator of future results. Be sure to understand risks before making an investment decision.
Go Further
I encourage you to read the complete analyses of PTC Inc. and Figma, Inc. to enhance your investment decisions: