In the dynamic world of technology, Figma, Inc. and Perfect Corp. stand out as innovators in software applications, each reshaping their respective niches. Figma leads in collaborative design tools for product development, while Perfect Corp. pioneers AI and AR solutions in beauty and fashion tech. Both companies demonstrate strong innovation strategies and operate within overlapping market spaces. This analysis will help you decide which company presents the most compelling investment opportunity in 2026.
Table of contents
Companies Overview
I will begin the comparison between Figma and Perfect Corp. by providing an overview of these two companies and their main differences.
Figma Overview
Figma, Inc. develops a browser-based tool for designing user interfaces that supports design and development teams in building products. Its offerings include collaborative design, prototyping, design system management, and AI-powered design tools. Headquartered in San Francisco, Figma operates in the software application industry with a market cap of 14.4B USD and employs approximately 1,646 people.
Perfect Corp. Overview
Perfect Corp. delivers SaaS artificial intelligence and augmented reality solutions for the beauty and fashion tech sectors. Its products include virtual try-on technologies and AI-based analysis tools across multiple categories such as makeup, hair, and accessories. Founded in 2015 and based in New Taipei City, Taiwan, Perfect Corp. has a market cap of 179M USD and 342 employees in the software application industry.
Key similarities and differences
Both companies operate in the software application sector and focus on innovative AI-driven solutions to enhance user experience. Figma emphasizes collaborative design tools for UI and product development, targeting design teams, while Perfect Corp. specializes in AR and AI applications for beauty and fashion tech consumers. Market capitalization and employee size differ significantly, reflecting their distinct scales and market focuses.
Income Statement Comparison
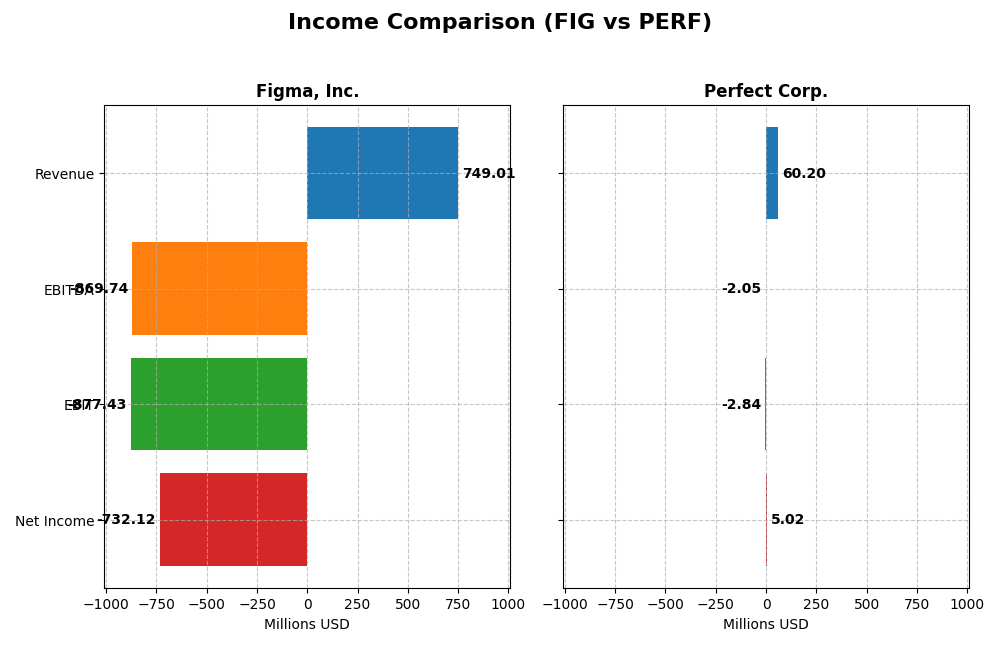
The table below presents a side-by-side comparison of key income statement metrics for Figma, Inc. and Perfect Corp. for the fiscal year 2024.
| Metric | Figma, Inc. (FIG) | Perfect Corp. (PERF) |
|---|---|---|
| Market Cap | 14.4B | 179M |
| Revenue | 749M | 60.2M |
| EBITDA | -870M | -2.0M |
| EBIT | -877M | -2.8M |
| Net Income | -732M | 5.0M |
| EPS | -3.11 | 0.05 |
| Fiscal Year | 2024 | 2024 |
Income Statement Interpretations
Figma, Inc.
Figma’s revenue grew significantly by 48.36% from 2023 to 2024, reaching $749M, but net income swung from a positive $286M in 2023 to a net loss of $732M in 2024. Gross margin remains strong at 88.32%, yet the net margin dropped sharply to -97.74%. The latest year saw unfavorable growth in earnings and margins despite top-line expansion, reflecting increased operating expenses.
Perfect Corp.
Perfect Corp. demonstrated steady revenue growth, increasing 12.52% year-over-year to $60.2M in 2024, with net income slightly declining to $5M. Gross margin held favorably at 77.98%, and net margin improved to 8.34%. Over the longer term, the company shows favorable trends in revenue and net income growth, although EBIT margin remains slightly negative at -4.72%.
Which one has the stronger fundamentals?
Perfect Corp. exhibits stronger fundamentals with predominantly favorable income statement growth and margin improvements, including positive net margin and consistent revenue growth. In contrast, Figma shows a sharper revenue increase but suffers from significant net losses and margin deterioration. Overall, Perfect Corp.’s financials present a more balanced and favorable income profile.
Financial Ratios Comparison
Below is a comparison of key financial ratios for Figma, Inc. (FIG) and Perfect Corp. (PERF) based on their latest fiscal year 2024 data.
| Ratios | Figma, Inc. (FIG) | Perfect Corp. (PERF) |
|---|---|---|
| ROE | -55.3% | 3.42% |
| ROIC | -59.7% | -2.10% |
| P/E | -70.7 | 56.6 |
| P/B | 39.1 | 1.93 |
| Current Ratio | 3.66 | 5.52 |
| Quick Ratio | 3.66 | 5.52 |
| D/E (Debt-to-Equity) | 0.022 | 0.0035 |
| Debt-to-Assets | 1.60% | 0.28% |
| Interest Coverage | 0 | -449 |
| Asset Turnover | 0.42 | 0.33 |
| Fixed Asset Turnover | 17.1 | 57.9 |
| Payout Ratio | 0% | 0% |
| Dividend Yield | 0% | 0% |
Interpretation of the Ratios
Figma, Inc.
Figma shows several unfavorable ratios, including a negative net margin of -97.74% and a return on equity (ROE) of -55.29%, indicating weak profitability and returns. Despite a strong quick ratio of 3.66 and low debt levels, concerns arise from poor interest coverage and high price-to-book ratio at 39.1. The company does not pay dividends, likely due to its negative profitability and focus on reinvestment.
Perfect Corp.
Perfect Corp. exhibits a mixed ratio profile, with a positive net margin of 8.34% but a low ROE of 3.42% and negative return on invested capital (ROIC) at -2.1%, reflecting moderate profitability challenges. Its current ratio is high at 5.52, signaling liquidity strength, but interest coverage is strongly negative. The company also pays no dividends, possibly prioritizing growth and R&D investments.
Which one has the best ratios?
Between the two, Figma’s ratios are more unfavorable overall, with deeper negative profitability and returns despite better leverage metrics. Perfect Corp. has a slightly unfavorable profile but demonstrates relatively better net margin and liquidity ratios. Both companies have zero dividend yields, reflecting reinvestment strategies or growth phase priorities.
Strategic Positioning
This section compares the strategic positioning of Figma, Inc. and Perfect Corp. across market position, key segments, and exposure to technological disruption:
Figma, Inc.
- Leading browser-based UI design tool with significant NYSE market cap and competitive volatility.
- Focused on collaborative design tools and AI-powered prototyping for product development teams.
- Positioned in software applications with digital design innovation but exposed to fast-evolving tech changes.
Perfect Corp.
- Smaller market cap SaaS AI and AR beauty/fashion tech provider with stable beta.
- Concentrated on AI and AR virtual try-on solutions in beauty and fashion segments.
- Invests in AI/AR tech for virtual try-ons, facing ongoing technological innovation pressures.
Figma, Inc. vs Perfect Corp. Positioning
Figma has a diversified product suite targeting design and development teams, while Perfect Corp. concentrates on AI and AR applications in beauty/fashion. Figma benefits from scale and market breadth; Perfect Corp. focuses on niche innovation but with a smaller footprint.
Which has the best competitive advantage?
Neither company currently achieves ROIC above WACC; Figma’s value destruction is very unfavorable, whereas Perfect Corp. shows improving profitability but still sheds value, indicating a slight disadvantage in sustaining a competitive moat.
Stock Comparison
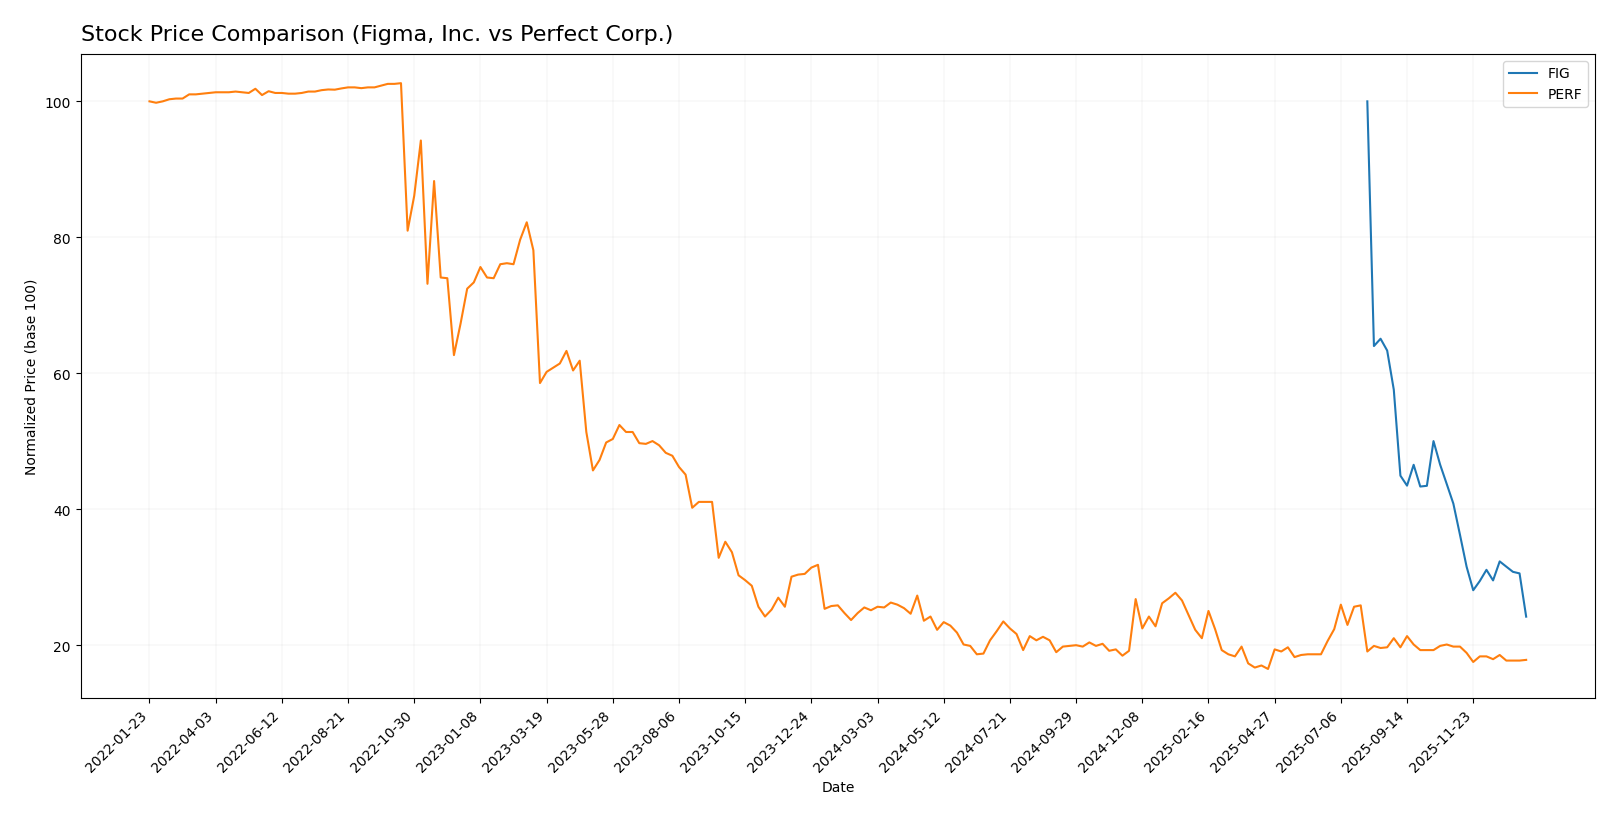
The stock price movements of Figma, Inc. and Perfect Corp. over the past 12 months reveal significant declines with differing volatility and trading volume dynamics.
Trend Analysis
Figma, Inc. (FIG) experienced a bearish trend with a 75.76% price decline over the past year, showing accelerating downtrend momentum and high volatility (std dev 19.95). The stock hit a high of 122.0 and a low of 29.57.
Perfect Corp. (PERF) also followed a bearish trend with a 28.98% price drop during the same period, but with decelerating downward momentum and very low volatility (std dev 0.27). The highest price was 2.7 and the lowest 1.61.
Comparatively, Perfect Corp. delivered a less severe market performance decline than Figma, Inc., indicating a smaller loss in value despite both stocks trending downward.
Target Prices
The current analyst consensus reveals moderate upside potential for both Figma, Inc. and Perfect Corp.
| Company | Target High | Target Low | Consensus |
|---|---|---|---|
| Figma, Inc. | 52 | 38 | 43.6 |
| Perfect Corp. | 7 | 7 | 7 |
Analysts expect Figma’s stock to rise significantly from its current price of $29.57 toward a consensus target of $43.6, indicating confidence in growth. Perfect Corp.’s target price at $7 also suggests a strong potential increase from its current $1.74 market price.
Analyst Opinions Comparison
This section compares analysts’ ratings and grades for Figma, Inc. and Perfect Corp.:
Rating Comparison
Figma, Inc. Rating
- Rating: C+ indicating a very favorable status overall.
- Discounted Cash Flow Score: 4, showing favorable valuation.
- ROE Score: 1, reflecting very unfavorable profitability.
- ROA Score: 1, indicating very unfavorable asset use.
- Debt To Equity Score: 4, considered favorable financial risk.
- Overall Score: 2, rated as moderate overall strength.
Perfect Corp. Rating
- Rating: A- indicating a very favorable status overall.
- Discounted Cash Flow Score: 5, indicating very favorable valuation.
- ROE Score: 2, showing moderate profitability.
- ROA Score: 3, indicating moderate asset utilization.
- Debt To Equity Score: 4, also favorable in terms of financial risk.
- Overall Score: 4, rated as favorable overall strength.
Which one is the best rated?
Perfect Corp. is better rated, with a higher overall score (4 vs. 2) and stronger ratings in discounted cash flow, ROE, and ROA scores compared to Figma, which has weaker profitability and asset utilization scores.
Scores Comparison
Here is a comparison of the Altman Z-Score and Piotroski Score for Figma, Inc. and Perfect Corp.:
FIG Scores
- Altman Z-Score: 14.34, indicating a safe zone with very low bankruptcy risk.
- Piotroski Score: 4, reflecting average financial strength.
PERF Scores
- Altman Z-Score: 1.31, in the distress zone indicating high bankruptcy risk.
- Piotroski Score: 6, reflecting average financial strength.
Which company has the best scores?
Based on the provided data, FIG shows a significantly stronger Altman Z-Score, placing it in a safe zone, while PERF is in distress. Both have average Piotroski Scores, but FIG’s overall financial stability appears stronger.
Grades Comparison
Here is the comparison of the latest available grades for Figma, Inc. and Perfect Corp.:
Figma, Inc. Grades
The table below shows recent grade updates from recognized financial institutions for Figma, Inc.
| Grading Company | Action | New Grade | Date |
|---|---|---|---|
| Morgan Stanley | Maintain | Equal Weight | 2026-01-15 |
| Wells Fargo | Upgrade | Overweight | 2026-01-08 |
| RBC Capital | Maintain | Sector Perform | 2026-01-05 |
| Goldman Sachs | Maintain | Neutral | 2025-11-07 |
| JP Morgan | Maintain | Neutral | 2025-11-06 |
| Piper Sandler | Maintain | Overweight | 2025-11-06 |
| Wells Fargo | Maintain | Equal Weight | 2025-11-05 |
| Wells Fargo | Maintain | Equal Weight | 2025-09-04 |
| Morgan Stanley | Maintain | Equal Weight | 2025-09-04 |
| RBC Capital | Maintain | Sector Perform | 2025-09-04 |
Overall, Figma’s grades largely reflect a neutral to slightly positive outlook, with multiple equal weight and sector perform ratings alongside some overweight upgrades.
Perfect Corp. Grades
The table below shows recent grade updates from recognized financial institutions for Perfect Corp.
| Grading Company | Action | New Grade | Date |
|---|---|---|---|
| Piper Sandler | Maintain | Neutral | 2024-02-29 |
| Goldman Sachs | Maintain | Neutral | 2023-10-26 |
| Piper Sandler | Maintain | Neutral | 2023-10-25 |
| Piper Sandler | Maintain | Neutral | 2023-07-26 |
| Piper Sandler | Maintain | Neutral | 2023-07-25 |
| Piper Sandler | Maintain | Neutral | 2023-04-27 |
| Oppenheimer | Downgrade | Perform | 2023-04-20 |
| Oppenheimer | Downgrade | Perform | 2023-04-19 |
| Oppenheimer | Downgrade | Perform | 2023-04-18 |
| Piper Sandler | Maintain | Neutral | 2023-03-08 |
Perfect Corp.’s grades are consistently neutral, with a notable downgrade from outperform to perform by Oppenheimer in April 2023.
Which company has the best grades?
Figma, Inc. has received relatively better grades with several overweight and sector perform ratings, while Perfect Corp. maintains mostly neutral grades with a recent downgrade. This suggests Figma may be perceived with slightly more confidence, potentially influencing investor interest and portfolio positioning.
Strengths and Weaknesses
Below is a comparative table highlighting the key strengths and weaknesses of Figma, Inc. (FIG) and Perfect Corp. (PERF) based on their latest financial and strategic evaluations.
| Criterion | Figma, Inc. (FIG) | Perfect Corp. (PERF) |
|---|---|---|
| Diversification | Limited product segmentation; focus on design software | Limited product segmentation; focused on beauty tech solutions |
| Profitability | Very unfavorable: negative net margin (-97.74%), ROIC -59.68% | Slightly unfavorable: positive net margin (8.34%), ROIC -2.1% but improving |
| Innovation | Moderate innovation but declining profitability signals risk | Improving innovation reflected in growing ROIC trend |
| Global presence | Strong global presence but inefficient capital use | Global presence with efficient capital use improving over time |
| Market Share | Facing challenges with value destruction | Maintaining and growing market share with increasing profitability |
Key takeaways: Figma is currently struggling with significant value destruction and declining profitability despite a strong market presence. Perfect Corp., while also shedding value, shows improving profitability trends and better financial health, suggesting a more promising path forward. Investors should weigh risks carefully, favoring Perfect Corp. for growth potential amid cautious monitoring.
Risk Analysis
Below is a comparative table of key risks for Figma, Inc. (FIG) and Perfect Corp. (PERF) based on the latest 2024 data:
| Metric | Figma, Inc. (FIG) | Perfect Corp. (PERF) |
|---|---|---|
| Market Risk | High volatility, beta -3.80 indicates unusual price swings | Moderate volatility, beta 0.45 suggests relative stability |
| Debt level | Very low debt (D/E 0.02), low debt-to-assets 1.6% | Virtually no debt, D/E 0.0, debt-to-assets 0.28% |
| Regulatory Risk | US tech industry, potential data privacy and IP regulations | Taiwanese HQ, exposure to cross-border tech regulations |
| Operational Risk | Negative net margin (-97.7%), negative ROE (-55.3%) reflects operational inefficiencies | Slightly positive margin (8.3%), but negative ROIC (-2.1%) indicates some inefficiencies |
| Environmental Risk | Minimal direct environmental impact as a software company | Similar low environmental footprint, focused on SaaS AI tech |
| Geopolitical Risk | US-based, subject to US-China tech tensions | Taiwan-based, higher geopolitical risk due to regional tensions |
The most impactful and likely risks differ between the two. Figma faces major operational risk with steep losses and volatile stock behavior, which could unsettle investors. Perfect Corp.’s main concern is geopolitical risk given Taiwan’s sensitive position, alongside moderate operational challenges. Both companies maintain low debt levels, reducing financial risk but demanding scrutiny on profitability and market conditions.
Which Stock to Choose?
Figma, Inc. (FIG) shows strong revenue growth of 48% in 2024 but suffers from sharply negative profitability with a net margin of -97.74% and declining returns on equity and invested capital. Its debt levels are low, and the company holds a moderate rating of C+ despite an unfavorable overall income statement and ratio evaluation.
Perfect Corp. (PERF) reports more moderate revenue growth at 12.5% in 2024 but maintains a positive net margin of 8.34% and improving earnings per share. Debt is minimal with a strong current ratio, and the company holds a higher rating of A- supported by a favorable income statement and slightly unfavorable ratio evaluation.
Investors seeking growth could find FIG’s rapid revenue expansion appealing despite its poor profitability and value destruction signals, whereas those prioritizing financial stability and improving profitability might see PERF as more favorable given its stronger ratings and income quality metrics.
Disclaimer: Investment carries a risk of loss of initial capital. The past performance is not a reliable indicator of future results. Be sure to understand risks before making an investment decision.
Go Further
I encourage you to read the complete analyses of Figma, Inc. and Perfect Corp. to enhance your investment decisions: