In the dynamic world of software applications, Figma, Inc. and Pegasystems Inc. stand out as innovative players shaping how businesses design and automate processes. Both companies operate within the software application industry, with overlapping markets in enterprise solutions and a strong focus on digital transformation. This article will guide you through a comparative analysis to help determine which company presents the most compelling investment opportunity today.
Table of contents
Companies Overview
I will begin the comparison between Figma and Pegasystems by providing an overview of these two companies and their main differences.
Figma Overview
Figma, Inc. develops browser-based design tools aimed at helping design and development teams create user interfaces and prototypes collaboratively. The company offers several products including Figma Design for design systems, Dev Mode for translating designs into code, and AI-driven tools like Figma Make. Incorporated in 2012 and headquartered in San Francisco, Figma positions itself as an innovative player in application software with a market cap of $14.4B.
Pegasystems Overview
Pegasystems Inc. focuses on enterprise software solutions, providing platforms such as Pega Platform and Pega Infinity that unify customer engagement and digital process automation. Its suite includes customer service and sales automation applications, cloud infrastructure, and training services. Founded in 1983 and based in Waltham, Massachusetts, Pegasystems serves multiple sectors globally with a market cap of $8.9B.
Key similarities and differences
Both companies operate in the software application industry, emphasizing tools that enhance business processes and customer experience. Figma specializes in collaborative design and prototyping tools primarily for creative teams, while Pegasystems targets enterprise clients with broader digital automation and customer engagement platforms. The contrast is marked by Figma’s focus on design innovation versus Pegasystems’ comprehensive enterprise software ecosystem.
Income Statement Comparison
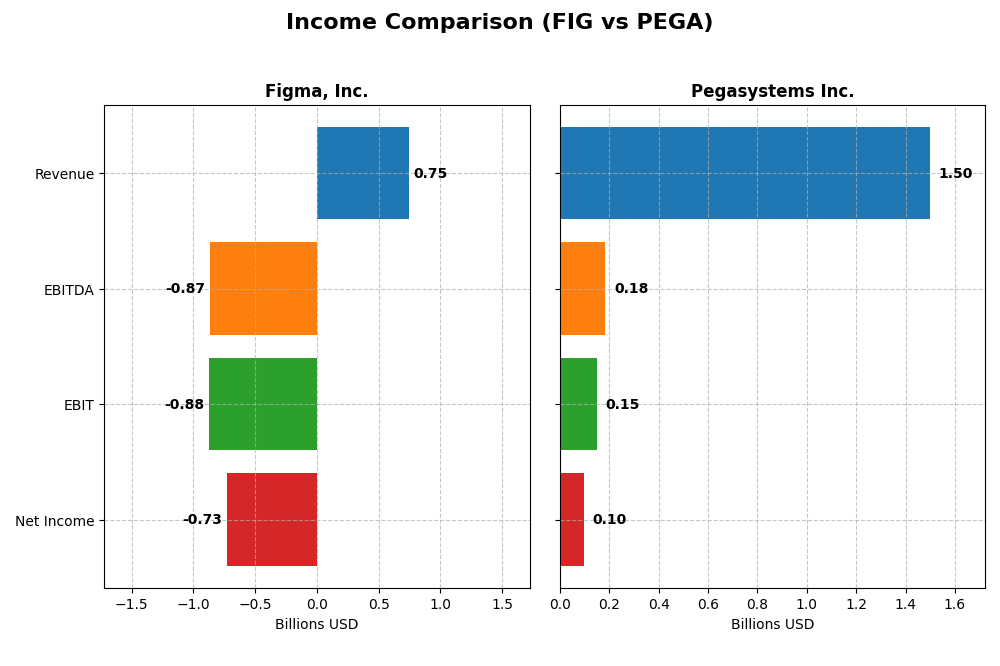
Below is a factual comparison of the most recent income statement metrics for Figma, Inc. and Pegasystems Inc., reflecting their fiscal year 2024 performance.
| Metric | Figma, Inc. (FIG) | Pegasystems Inc. (PEGA) |
|---|---|---|
| Market Cap | 14.4B | 8.9B |
| Revenue | 749M | 1.50B |
| EBITDA | -870M | 185M |
| EBIT | -877M | 149M |
| Net Income | -732M | 99M |
| EPS | -3.11 | 0.58 |
| Fiscal Year | 2024 | 2024 |
Income Statement Interpretations
Figma, Inc.
Figma’s revenue increased by 48.36% from 2023 to 2024, reaching $749M, with a gross margin of 88.32%, which remains favorable. However, net income declined sharply to a loss of $732M in 2024, reversing the previous year’s $286M profit. Margins deteriorated significantly, notably with net margin falling to -97.74%, indicating worsening profitability despite strong top-line growth.
Pegasystems Inc.
Pegasystems showed steady revenue growth of 4.51% in 2024, reaching nearly $1.5B, with a gross margin of 73.91%. Net income improved to $99M from $68M in 2023, and net margin rose to 6.63%, signaling enhanced profitability. EBIT and EPS growth were favorable, and operating expenses grew moderately, supporting stable margin expansion and financial health over the period.
Which one has the stronger fundamentals?
Pegasystems exhibits stronger fundamentals with consistent revenue growth, positive net income, and improving margins, reflecting operational efficiency and profitability. In contrast, Figma, despite rapid revenue expansion, faces significant net losses and deteriorating margins, indicating higher financial risk and less favorable income statement dynamics overall.
Financial Ratios Comparison
The table below presents key financial ratios for Figma, Inc. and Pegasystems Inc. based on their most recent fiscal year data, enabling straightforward ratio-based comparison.
| Ratios | Figma, Inc. (FIG) 2024 | Pegasystems Inc. (PEGA) 2024 |
|---|---|---|
| ROE | -55.3% | 16.9% |
| ROIC | -59.7% | 7.4% |
| P/E | -70.7 | 80.1 |
| P/B | 39.1 | 13.6 |
| Current Ratio | 3.66 | 1.23 |
| Quick Ratio | 3.66 | 1.23 |
| D/E (Debt-to-Equity) | 0.02 | 0.94 |
| Debt-to-Assets | 1.6% | 31.1% |
| Interest Coverage | 0 | 18.1 |
| Asset Turnover | 0.42 | 0.85 |
| Fixed Asset Turnover | 17.1 | 14.4 |
| Payout ratio | 0 | 10.3% |
| Dividend yield | 0 | 0.13% |
Interpretation of the Ratios
Figma, Inc.
Figma’s financial ratios reveal several weaknesses, including negative net margin (-97.74%) and return on equity (-55.29%), indicating persistent losses and inefficiency in generating shareholder value. Its high price-to-book ratio (39.1) and current ratio (3.66) may raise concerns about valuation and liquidity management. The company does not pay dividends, likely due to negative earnings and a focus on reinvestment and growth.
Pegasystems Inc.
Pegasystems shows a mix of neutral to favorable ratios, with a positive return on equity (16.94%) and interest coverage (21.87), suggesting profitability and good debt servicing capacity. However, its high price-to-earnings (80.12) and price-to-book (13.57) ratios may indicate overvaluation risks. Pegasystems pays a small dividend, with a yield of 0.13%, reflecting modest shareholder returns alongside cautious capital management.
Which one has the best ratios?
Pegasystems exhibits a more balanced and slightly favorable ratio profile compared to Figma, which faces significant profitability and valuation challenges. Although Pegasystems has some unfavorable valuation metrics, its positive returns and dividend payments provide a steadier financial outlook, whereas Figma’s negative returns and lack of dividends highlight greater financial stress and growth-phase characteristics.
Strategic Positioning
This section compares the strategic positioning of Figma, Inc. and Pegasystems Inc., including market position, key segments, and exposure to technological disruption:
Figma, Inc.
- Smaller market cap at 14.4B with significant trading volume; faces competitive pressure in software design tools.
- Focuses on collaborative browser-based UI design tools and AI-driven prototyping solutions.
- Operates in a technology-driven sector with innovative AI tools; disruption risk tied to software evolution.
Pegasystems Inc.
- Market cap of 8.9B; established player in enterprise software with moderate competitive pressure.
- Diverse segments: Pega Cloud (1.13B), consulting, maintenance, subscription licenses, and perpetual licenses.
- Faces disruption from cloud adoption and automation, offering cloud platforms and intelligent automation software.
Figma, Inc. vs Pegasystems Inc. Positioning
Figma’s strategy centers on a concentrated product suite focused on UI design and collaboration, leveraging AI innovation. Pegasystems pursues diversification across cloud, consulting, and licensing, supporting broader enterprise software needs but with higher operational complexity.
Which has the best competitive advantage?
Neither company currently shows a favorable MOAT. Figma’s moat is very unfavorable with declining profitability, while Pegasystems is slightly unfavorable but improving, indicating Pegasystems may have a marginally stronger competitive position based on ROIC trends.
Stock Comparison
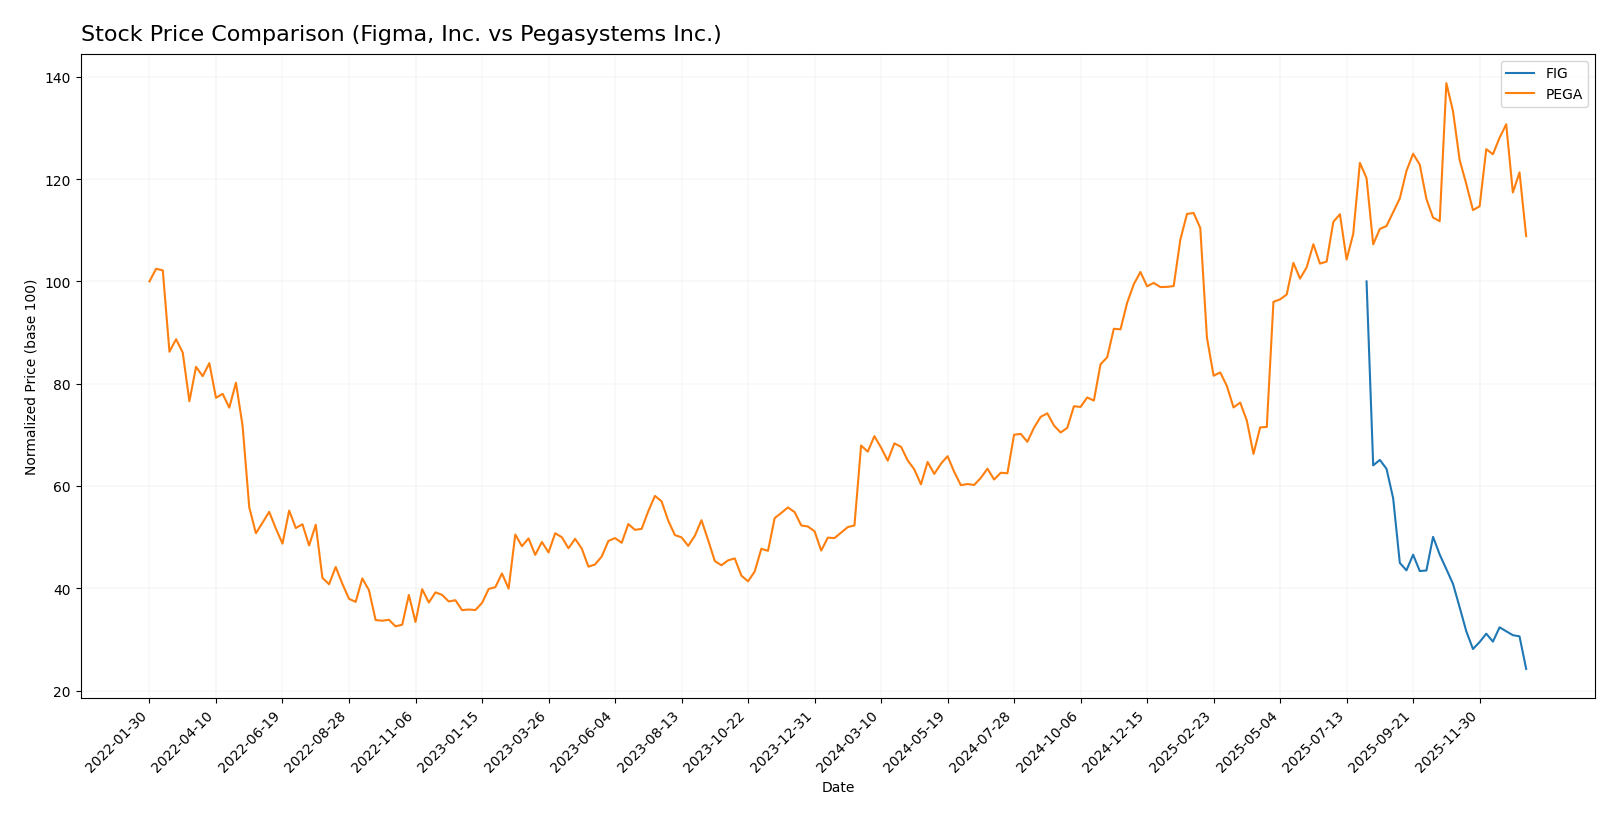
The stock price movements over the past year reveal a stark contrast between Figma, Inc. and Pegasystems Inc., with FIG exhibiting a strong bearish acceleration while PEGA shows a decelerating bullish trend.
Trend Analysis
Figma, Inc. (FIG) experienced a significant bearish trend over the last 12 months with a price decline of 75.76%, showing accelerating downward momentum and a high volatility level with a standard deviation of 19.95.
Pegasystems Inc. (PEGA) recorded a bullish trend with a 63.18% price increase over the same period, although the trend is decelerating and volatility is moderate at a 10.77 standard deviation.
Comparing their stock trends, Pegasystems delivered the highest market performance with a strong positive gain, whereas Figma faced a steep downturn in share value.
Target Prices
Analysts present a clear consensus on target prices for Figma, Inc. and Pegasystems Inc., reflecting optimistic expectations.
| Company | Target High | Target Low | Consensus |
|---|---|---|---|
| Figma, Inc. | 52 | 38 | 43.6 |
| Pegasystems Inc. | 80 | 67 | 74 |
The consensus targets for both companies are substantially above their current trading prices, indicating analyst confidence in future price appreciation. Figma’s consensus target is about 48% higher than its current price of 29.57, while Pegasystems’ consensus target exceeds its current price of 51.99 by approximately 42%.
Analyst Opinions Comparison
This section compares analysts’ ratings and grades for Figma, Inc. and Pegasystems Inc.:
Rating Comparison
Figma, Inc. Rating
- Rating: C+ with a very favorable status
- Discounted Cash Flow Score: 4, indicating favorable
- ROE Score: 1, very unfavorable performance
- ROA Score: 1, very unfavorable efficiency
- Debt To Equity Score: 4, favorable financial risk
- Overall Score: 2, moderate assessment
Pegasystems Inc. Rating
- Rating: B+ with a very favorable status
- Discounted Cash Flow Score: 3, indicating moderate
- ROE Score: 5, very favorable performance
- ROA Score: 5, very favorable efficiency
- Debt To Equity Score: 3, moderate financial risk
- Overall Score: 3, moderate assessment
Which one is the best rated?
Based strictly on the provided data, Pegasystems Inc. holds a better rating (B+) and higher overall score (3) compared to Figma’s C+ and overall score of 2. Pegasystems also outperforms in ROE and ROA scores, indicating stronger profitability and asset utilization.
Scores Comparison
Here is a comparison of the Altman Z-Score and Piotroski Score for the two companies:
FIG Scores
- Altman Z-Score: 14.34, indicating a safe zone with very low bankruptcy risk.
- Piotroski Score: 4, reflecting average financial strength.
PEGA Scores
- Altman Z-Score: 10.31, also in the safe zone with low bankruptcy risk.
- Piotroski Score: 8, indicating very strong financial health.
Which company has the best scores?
Based strictly on the provided data, FIG has a higher Altman Z-Score, suggesting lower bankruptcy risk, while PEGA has a significantly higher Piotroski Score, reflecting stronger overall financial health.
Grades Comparison
Here is a detailed comparison of the most recent reliable grades for Figma, Inc. and Pegasystems Inc.:
Figma, Inc. Grades
The following table summarizes recent grades issued by reputable financial institutions for Figma, Inc.:
| Grading Company | Action | New Grade | Date |
|---|---|---|---|
| Morgan Stanley | Maintain | Equal Weight | 2026-01-15 |
| Wells Fargo | Upgrade | Overweight | 2026-01-08 |
| RBC Capital | Maintain | Sector Perform | 2026-01-05 |
| Goldman Sachs | Maintain | Neutral | 2025-11-07 |
| JP Morgan | Maintain | Neutral | 2025-11-06 |
| Piper Sandler | Maintain | Overweight | 2025-11-06 |
| Wells Fargo | Maintain | Equal Weight | 2025-11-05 |
| Wells Fargo | Maintain | Equal Weight | 2025-09-04 |
| Morgan Stanley | Maintain | Equal Weight | 2025-09-04 |
| RBC Capital | Maintain | Sector Perform | 2025-09-04 |
Figma, Inc.’s grades mostly range from Equal Weight to Overweight, indicating a cautious to moderately positive outlook.
Pegasystems Inc. Grades
Below are the recent grades provided by recognized grading firms for Pegasystems Inc.:
| Grading Company | Action | New Grade | Date |
|---|---|---|---|
| JP Morgan | Maintain | Overweight | 2025-12-05 |
| Wedbush | Maintain | Outperform | 2025-10-23 |
| RBC Capital | Maintain | Outperform | 2025-10-23 |
| Barclays | Maintain | Equal Weight | 2025-10-23 |
| Rosenblatt | Maintain | Buy | 2025-10-23 |
| DA Davidson | Upgrade | Buy | 2025-10-22 |
| Rosenblatt | Maintain | Buy | 2025-10-15 |
| Rosenblatt | Maintain | Buy | 2025-07-24 |
| DA Davidson | Maintain | Neutral | 2025-07-24 |
| Wedbush | Maintain | Outperform | 2025-07-24 |
Pegasystems Inc. shows a generally stronger consensus with frequent Buy and Outperform ratings.
Which company has the best grades?
Pegasystems Inc. holds the superior grades overall, with more Buy and Outperform ratings compared to Figma, Inc.’s Hold and Equal Weight consensus. This suggests Pegasystems is viewed more favorably by analysts, which could indicate higher expected performance potential for investors.
Strengths and Weaknesses
Below is a comparative overview of key strengths and weaknesses for Figma, Inc. (FIG) and Pegasystems Inc. (PEGA) based on the latest available data.
| Criterion | Figma, Inc. (FIG) | Pegasystems Inc. (PEGA) |
|---|---|---|
| Diversification | Limited product range, focused on design software | Well diversified with Consulting, Maintenance, Cloud, and Subscription services |
| Profitability | Negative profitability, ROIC -59.7%, net margin -97.7% | Slightly profitable with 6.6% net margin and 7.4% ROIC |
| Innovation | Struggling with value creation, declining ROIC trend | Growing ROIC trend, steady innovation in cloud and subscription offerings |
| Global presence | Moderate global reach but limited financial strength | Strong global presence, with over $1.1B revenue in Pega Cloud segment (2024) |
| Market Share | Facing competitive pressure, value destruction | Stable market share with increasing cloud and subscription revenues |
Key takeaways: Figma currently faces significant profitability challenges and declining returns on invested capital, indicating value destruction. Pegasystems shows more balanced financial health with positive ROIC trends and diversified revenue streams, making it a more stable investment option despite some valuation concerns.
Risk Analysis
Below is a comparative table of key risk factors for Figma, Inc. (FIG) and Pegasystems Inc. (PEGA) based on their latest financial and operational data for 2024.
| Metric | Figma, Inc. (FIG) | Pegasystems Inc. (PEGA) |
|---|---|---|
| Market Risk | High volatility, beta at -3.8 indicates unusual sensitivity and negative correlation to the market | Moderate volatility, beta 1.08 aligns with market trends |
| Debt Level | Very low leverage, debt-to-equity 0.02, debt/assets 1.6% (favorable) | Moderate leverage, debt-to-equity 0.94, debt/assets 31.1% (neutral) |
| Regulatory Risk | Moderate, operates primarily in US tech sector, IPO in 2025 increases scrutiny | Moderate, global operations expose to varying regulations |
| Operational Risk | High due to negative net margin (-97.74%) and unfavorable ROE (-55.29%) | Moderate, stable profitability (net margin 6.63%) and favorable ROE (16.94%) |
| Environmental Risk | Low exposure, primarily software development | Low exposure, software-focused with cloud services globally |
| Geopolitical Risk | Limited, US-centered but tech sector sensitive to trade policies | Elevated, diversified global footprint across multiple markets |
The most impactful and likely risks include Figma’s operational risk tied to its high losses and volatile market behavior, which could affect financial stability despite a strong Altman Z-score indicating low bankruptcy risk. Pegasystems shows moderate risk with manageable debt and a strong Piotroski score, but its geopolitical exposure due to global operations warrants caution.
Which Stock to Choose?
Figma, Inc. (FIG) shows strong revenue growth of 48.36% in 2024 but suffers from negative profitability with a net margin of -97.74% and declining returns on equity and invested capital. Its debt levels are low, and liquidity ratios are mixed, with an overall unfavorable financial ratio assessment and a very unfavorable moat rating. The company holds a moderate overall rating (C+) with a safe Altman Z-score but an average Piotroski score, indicating some financial stability concerns.
Pegasystems Inc. (PEGA) presents moderate income growth of 4.51% in 2024 and positive profitability metrics, including a net margin of 6.63% and improving returns on equity and invested capital. Its debt is moderate, supported by a neutral current ratio and a slightly favorable financial ratios evaluation. The company’s moat rating is slightly unfavorable but with a positive ROIC trend. PEGA’s rating is higher (B+) with strong Piotroski and safe Altman Z-scores, reflecting better financial health.
For investors prioritizing growth potential, FIG’s high revenue growth might appear attractive despite its current profitability challenges and unfavorable ratios. Conversely, PEGA could be seen as more favorable for those valuing financial stability and profitability improvements, given its favorable income statement and stronger ratings. The choice might depend on whether an investor prefers a risk-tolerant growth approach or a more cautious quality-focused investment.
Disclaimer: Investment carries a risk of loss of initial capital. The past performance is not a reliable indicator of future results. Be sure to understand risks before making an investment decision.
Go Further
I encourage you to read the complete analyses of Figma, Inc. and Pegasystems Inc. to enhance your investment decisions: