Figma, Inc. and Paycom Software, Inc. are two prominent players in the software application industry, each excelling in distinct but overlapping markets—collaborative design tools and human capital management solutions. Both companies pursue innovation through cloud-based platforms, targeting efficiency and user engagement. This article will analyze their strengths and risks to help you decide which company could be the most compelling addition to your investment portfolio.
Table of contents
Companies Overview
I will begin the comparison between Figma and Paycom by providing an overview of these two companies and their main differences.
Figma Overview
Figma, Inc. is a technology company focused on developing a browser-based design tool that aids teams in creating user interfaces. Its collaborative platform includes various applications like Figma Design for prototyping, Dev Mode for code translation, and AI tools such as Figma Make. Incorporated in 2012 and headquartered in San Francisco, Figma holds a market capitalization of 14.4B USD and employs around 1,646 people.
Paycom Overview
Paycom Software, Inc. operates in the technology sector providing cloud-based human capital management (HCM) solutions as software-as-a-service. Its platform supports small to mid-sized U.S. companies with talent acquisition, payroll, labor management, and compliance tools. Founded in 1998 and based in Oklahoma City, Paycom has a market cap of 8.3B USD and a workforce of 7,306 employees.
Key similarities and differences
Both Figma and Paycom serve the software application industry within the technology sector and trade on the NYSE. Figma specializes in collaborative design tools for product development, while Paycom offers comprehensive HCM solutions focusing on workforce management. Figma is younger with fewer employees and a higher market cap, whereas Paycom has a longer history and larger employee base but a smaller market capitalization.
Income Statement Comparison
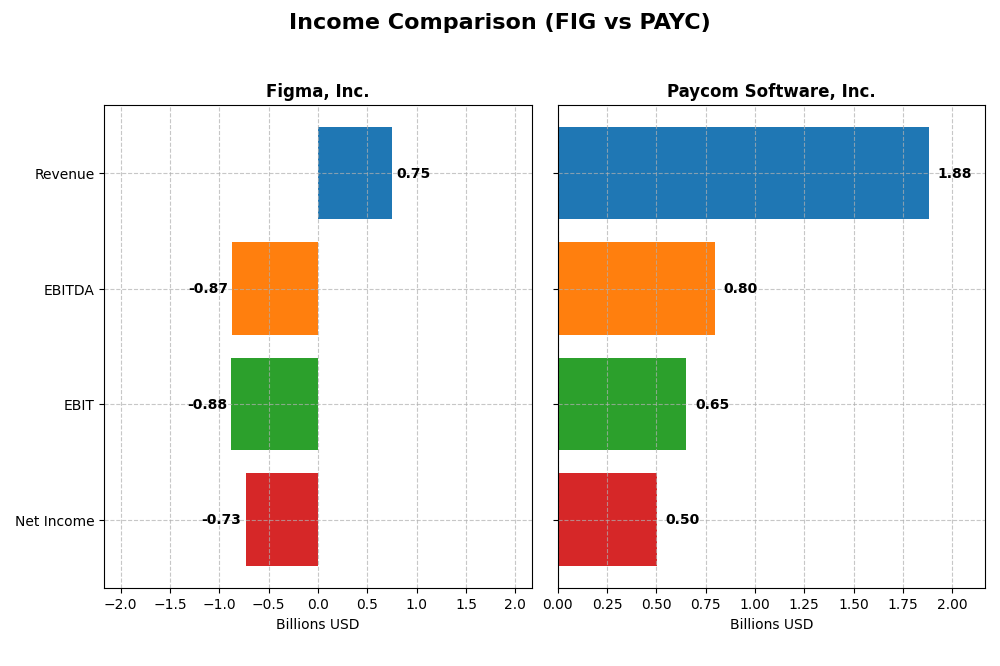
The table below presents a side-by-side comparison of key income statement metrics for Figma, Inc. and Paycom Software, Inc. for the fiscal year 2024.
| Metric | Figma, Inc. (FIG) | Paycom Software, Inc. (PAYC) |
|---|---|---|
| Market Cap | 14.4B | 8.3B |
| Revenue | 749M | 1.88B |
| EBITDA | -870M | 798M |
| EBIT | -877M | 652M |
| Net Income | -732M | 502M |
| EPS | -3.11 | 8.93 |
| Fiscal Year | 2024 | 2024 |
Income Statement Interpretations
Figma, Inc.
Figma’s revenue surged 48.36% from 2023 to 2024, reaching $749M, but net income swung sharply to a $732M loss. Gross margin remained strong at 88.32%, yet EBIT and net margins deteriorated significantly, reflecting higher operational expenses. The recent year showed rapid revenue growth, but profitability weakened considerably, signaling margin pressure.
Paycom Software, Inc.
Paycom demonstrated steady revenue growth, rising 11.19% to $1.88B in 2024, with net income up 32.48% to $502M. Margins improved, with gross margin at 82.23% and EBIT margin at 34.64%, indicating efficient cost management. The latest year reflects solid earnings expansion and margin enhancement, consistent with long-term positive trends since 2020.
Which one has the stronger fundamentals?
Paycom exhibits stronger fundamentals, with consistent revenue and net income growth, favorable margin trends, and positive EPS momentum. Conversely, Figma, despite strong revenue growth, faces substantial net losses and deteriorating profitability metrics. The overall income statement evaluation favors Paycom’s stable and profitable financial profile over Figma’s current challenges.
Financial Ratios Comparison
The table below presents a side-by-side comparison of key financial ratios for Figma, Inc. (FIG) and Paycom Software, Inc. (PAYC) based on their most recent fiscal year data from 2024.
| Ratios | Figma, Inc. (FIG) | Paycom Software, Inc. (PAYC) |
|---|---|---|
| ROE | -55.29% | 31.85% |
| ROIC | -59.68% | 24.86% |
| P/E | -70.71 | 22.95 |
| P/B | 39.10 | 7.31 |
| Current Ratio | 3.66 | 1.10 |
| Quick Ratio | 3.66 | 1.10 |
| D/E (Debt-to-Equity) | 0.022 | 0.053 |
| Debt-to-Assets | 1.60% | 1.42% |
| Interest Coverage | 0 | 186.56 |
| Asset Turnover | 0.42 | 0.32 |
| Fixed Asset Turnover | 17.09 | 2.93 |
| Payout Ratio | 0 | 16.89% |
| Dividend Yield | 0 | 0.74% |
Interpretation of the Ratios
Figma, Inc.
Figma shows a mixed ratio profile with more unfavorable metrics: negative net margin (-97.74%), return on equity (-55.29%), and return on invested capital (-59.68%) signal operational and profitability concerns. However, low debt levels and a favorable quick ratio reflect solid liquidity and low leverage. The company does not pay dividends, likely due to negative earnings and a reinvestment focus during its growth phase.
Paycom Software, Inc.
Paycom’s ratios are generally favorable with strong net margin (26.66%), return on equity (31.85%), and return on invested capital (24.86%) indicating robust profitability. Debt levels remain low, and interest coverage is excellent. Despite paying a modest dividend (yield 0.74%), its payout is supported by solid cash flow, though the price-to-book ratio and asset turnover suggest some valuation and efficiency caution.
Which one has the best ratios?
Paycom exhibits a more favorable overall ratio profile, with stronger profitability and cash flow metrics, alongside manageable debt and dividend payments. Figma’s ratios reflect operational challenges and negative returns, with no dividend distribution. Thus, Paycom’s financial ratios present a comparatively stronger and more balanced position in 2024.
Strategic Positioning
This section compares the strategic positioning of Figma, Inc. and Paycom Software, Inc., focusing on market position, key segments, and exposure to technological disruption:
Figma, Inc.
- Recently IPOed with a $14.4B market cap; operates in competitive software application industry.
- Offers browser-based collaborative design tools serving design and development teams.
- Positioned in software innovation with AI tools but no explicit disruption data provided.
Paycom Software, Inc.
- Established with $8.3B market cap; faces competitive pressure in cloud-based human capital management SaaS.
- Provides cloud HCM SaaS to US small and mid-sized companies with extensive payroll and talent management.
- Utilizes proprietary technologies like Microfence Bluetooth and advanced analytics within HCM solutions.
Figma, Inc. vs Paycom Software, Inc. Positioning
Figma’s strategy centers on a focused, innovative design tool suite for collaboration, while Paycom pursues a diversified HCM SaaS offering with broad functional coverage. Figma benefits from niche specialization; Paycom leverages scale and integration.
Which has the best competitive advantage?
Paycom shows a very favorable economic moat with growing ROIC outperforming WACC, indicating durable value creation. Figma’s very unfavorable moat and declining ROIC suggest it is currently destroying value and lacks a competitive advantage.
Stock Comparison
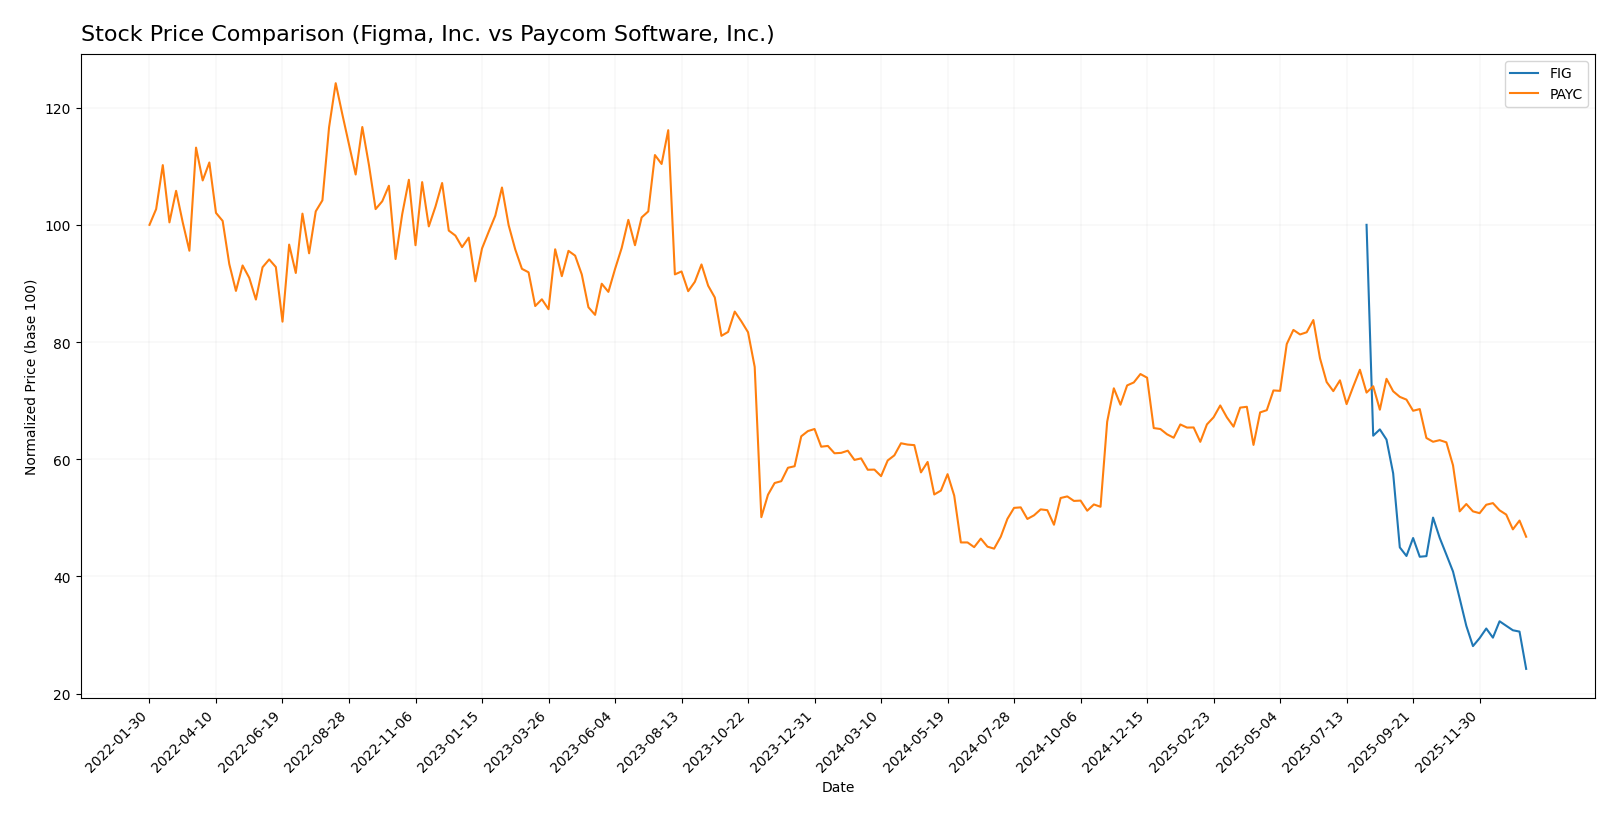
The stock price movements over the past 12 months highlight a strong bearish trend for both Figma, Inc. (FIG) and Paycom Software, Inc. (PAYC), with FIG experiencing a sharper decline and accelerating losses compared to PAYC’s decelerating downtrend.
Trend Analysis
Figma, Inc. (FIG) showed a bearish trend over the past year with a 75.76% price decline and accelerating losses, reaching a low of 29.57 from a high of 122.0, alongside notable volatility (std deviation 19.95).
Paycom Software, Inc. (PAYC) also trended bearish with a 19.64% decrease over the last 12 months, but losses decelerated. The stock fluctuated between 265.71 and 141.96, showing higher volatility (std deviation 31.92).
Comparing these trends, PAYC delivered a less severe market performance decline than FIG, indicating relatively better resilience despite both stocks facing selling pressure.
Target Prices
Analysts present a clear target price consensus for both Figma, Inc. and Paycom Software, Inc.
| Company | Target High | Target Low | Consensus |
|---|---|---|---|
| Figma, Inc. | 52 | 38 | 43.6 |
| Paycom Software, Inc. | 290 | 165 | 215 |
The consensus target prices for Figma and Paycom indicate potential upside compared to their current prices of $29.57 and $148.41, respectively, suggesting positive analyst expectations for future growth.
Analyst Opinions Comparison
This section compares analysts’ ratings and financial scores for Figma, Inc. and Paycom Software, Inc.:
Rating Comparison
FIG Rating
- Rating: C+, classified as Very Favorable overall rating.
- Discounted Cash Flow Score: 4, indicating a Favorable valuation perspective.
- ROE Score: 1, rated Very Unfavorable for profitability efficiency.
- ROA Score: 1, rated Very Unfavorable for asset utilization.
- Debt To Equity Score: 4, considered Favorable for financial stability.
- Overall Score: 2, rated Moderate overall financial standing.
PAYC Rating
- Rating: A, classified as Very Favorable overall rating.
- Discounted Cash Flow Score: 5, indicating a Very Favorable valuation perspective.
- ROE Score: 5, rated Very Favorable for profitability efficiency.
- ROA Score: 5, rated Very Favorable for asset utilization.
- Debt To Equity Score: 4, considered Favorable for financial stability.
- Overall Score: 4, rated Favorable overall financial standing.
Which one is the best rated?
Paycom Software, Inc. holds stronger analyst ratings with an A grade and higher scores across key financial metrics including ROE and ROA, compared to Figma’s C+ rating and lower scores. This indicates Paycom is better rated based on the provided data.
Scores Comparison
The scores comparison between Figma, Inc. and Paycom Software, Inc. is as follows:
FIG Scores
- Altman Z-Score: 14.34, indicating a safe zone.
- Piotroski Score: 4, classified as average.
PAYC Scores
- Altman Z-Score: 3.84, indicating a safe zone.
- Piotroski Score: 5, classified as average.
Which company has the best scores?
Figma has a significantly higher Altman Z-Score, indicating stronger financial stability. Paycom scores slightly better on the Piotroski scale, but both remain average. Overall, FIG shows a stronger bankruptcy risk profile.
Grades Comparison
Here is a comparison of recent grades assigned by reputable financial institutions to Figma, Inc. and Paycom Software, Inc.:
Figma, Inc. Grades
The following table shows the latest analyst grades for Figma, Inc. from major financial firms.
| Grading Company | Action | New Grade | Date |
|---|---|---|---|
| Morgan Stanley | Maintain | Equal Weight | 2026-01-15 |
| Wells Fargo | Upgrade | Overweight | 2026-01-08 |
| RBC Capital | Maintain | Sector Perform | 2026-01-05 |
| Goldman Sachs | Maintain | Neutral | 2025-11-07 |
| JP Morgan | Maintain | Neutral | 2025-11-06 |
| Piper Sandler | Maintain | Overweight | 2025-11-06 |
| Wells Fargo | Maintain | Equal Weight | 2025-11-05 |
| Wells Fargo | Maintain | Equal Weight | 2025-09-04 |
| Morgan Stanley | Maintain | Equal Weight | 2025-09-04 |
| RBC Capital | Maintain | Sector Perform | 2025-09-04 |
Figma’s grades mostly reflect a neutral to moderately positive outlook, with a recent upgrade to Overweight by Wells Fargo and consistent Equal Weight or Sector Perform ratings elsewhere.
Paycom Software, Inc. Grades
Below is a summary of recent analyst grades for Paycom Software, Inc. from recognized financial institutions.
| Grading Company | Action | New Grade | Date |
|---|---|---|---|
| Barclays | Maintain | Equal Weight | 2026-01-12 |
| TD Cowen | Maintain | Buy | 2026-01-08 |
| Citigroup | Maintain | Neutral | 2025-12-23 |
| Keybanc | Maintain | Overweight | 2025-11-06 |
| TD Cowen | Maintain | Buy | 2025-11-06 |
| UBS | Maintain | Buy | 2025-11-06 |
| Jefferies | Maintain | Hold | 2025-11-06 |
| JP Morgan | Maintain | Neutral | 2025-11-06 |
| Mizuho | Maintain | Neutral | 2025-11-06 |
| Barclays | Maintain | Equal Weight | 2025-11-06 |
Paycom’s ratings show a generally positive stance, with multiple Buy and Overweight ratings alongside some Neutral and Hold grades, indicating a cautiously optimistic consensus.
Which company has the best grades?
Both companies have a consensus Hold rating, but Paycom Software, Inc. has a higher number of Buy and Overweight ratings from analysts compared to Figma, Inc. This suggests Paycom may have stronger analyst confidence, potentially influencing investor sentiment positively.
Strengths and Weaknesses
Below is a comparison of key strengths and weaknesses for Figma, Inc. (FIG) and Paycom Software, Inc. (PAYC) based on the most recent financial and operational data.
| Criterion | Figma, Inc. (FIG) | Paycom Software, Inc. (PAYC) |
|---|---|---|
| Diversification | Limited product diversification; core focus on design tools | Strong recurring revenue (1.73B in 2024) with stable segments |
| Profitability | Negative margins (-97.7%), ROIC -59.7%, value destroying | Strong profitability: net margin 26.7%, ROIC 24.9%, value creating |
| Innovation | Innovative design platform but declining efficiency | Consistent innovation in HR software with durable moat |
| Global presence | Growing global user base but still expanding | Established global footprint in HR tech |
| Market Share | Facing competitive pressure, value destruction suggests loss | Increasing market share supported by strong financials |
Key takeaways: Paycom demonstrates strong profitability, a durable competitive advantage, and steady revenue growth, making it a robust investment candidate. Figma, despite innovation, shows declining returns and value destruction, signaling higher risk and caution for investors.
Risk Analysis
Below is a comparative table highlighting the key risks associated with Figma, Inc. (FIG) and Paycom Software, Inc. (PAYC) as of 2026:
| Metric | Figma, Inc. (FIG) | Paycom Software, Inc. (PAYC) |
|---|---|---|
| Market Risk | High volatility, beta -3.80, recent -6.4% price drop | Moderate volatility, beta 0.82, recent -2.9% price drop |
| Debt level | Very low debt (D/E 0.02), strong liquidity | Low debt (D/E 0.05), stable liquidity |
| Regulatory Risk | Moderate, operates in a competitive software sector | Moderate, subject to HR and payroll compliance regulations |
| Operational Risk | Unfavorable profitability metrics, negative net margin (-97.7%) | Favorable profitability, stable operations |
| Environmental Risk | Low direct impact, tech sector | Low direct impact, tech sector |
| Geopolitical Risk | US-based, exposed to global tech trade tensions | US-based, moderate exposure to geopolitical shifts |
The most likely and impactful risk for Figma is its operational and market risk, highlighted by significant negative profitability and high stock price volatility, which may affect investor confidence. Paycom, while more stable operationally, faces moderate market and regulatory risks but benefits from strong financial health and lower volatility.
Which Stock to Choose?
Figma, Inc. (FIG) shows a mixed income evolution with 48% revenue growth but declining profitability, reflected in very unfavorable net margin (-97.74%) and ROE (-55.29%). Its financial ratios are 43% unfavorable, though debt levels remain low and rated favorably. The company’s ROIC is significantly below WACC, indicating value destruction and declining profitability.
Paycom Software, Inc. (PAYC) demonstrates consistent income growth with favorable revenue and net margin increases, supported by strong profitability ratios including a 31.85% ROE. Its financial ratios are mostly favorable (57%) with low debt and solid interest coverage. PAYC’s ROIC exceeds WACC, signaling value creation and a durable competitive advantage.
Investors focused on stable profitability and value creation may find PAYC more favorable given its strong ratings and consistent financial performance, while those interested in growth potential despite current challenges might view FIG’s high revenue growth as a consideration. Overall, PAYC’s robust income and ratio profile could indicate a lower risk profile compared to FIG.
Disclaimer: Investment carries a risk of loss of initial capital. The past performance is not a reliable indicator of future results. Be sure to understand risks before making an investment decision.
Go Further
I encourage you to read the complete analyses of Figma, Inc. and Paycom Software, Inc. to enhance your investment decisions: