In today’s fast-evolving tech landscape, Figma, Inc. and PagerDuty, Inc. stand out as innovative leaders in software applications. Both companies, headquartered in San Francisco, serve critical roles in digital collaboration and operations management, targeting overlapping markets with distinct yet complementary solutions. This comparison aims to shed light on their growth strategies and market potential, helping you decide which stock deserves a place in your investment portfolio.
Table of contents
Companies Overview
I will begin the comparison between Figma and PagerDuty by providing an overview of these two companies and their main differences.
Figma Overview
Figma, Inc. develops a browser-based design tool aimed at helping design and development teams collaborate on user interfaces and product development. Its platform includes various tools for prototyping, illustration, presentations, and AI-assisted design. Founded in 2012 and headquartered in San Francisco, Figma operates in the Software – Application industry and has a market capitalization of approximately 14.4B USD as of 2026.
PagerDuty Overview
PagerDuty, Inc. offers a digital operations management platform that collects and analyzes data from software systems to predict and resolve issues. Serving multiple industries worldwide, PagerDuty leverages machine learning to enhance operational efficiency. Founded in 2009 and also based in San Francisco, the company operates within the same industry segment but has a smaller market cap of around 1.03B USD in 2026.
Key similarities and differences
Both Figma and PagerDuty operate in the Software – Application sector and are headquartered in San Francisco, targeting business customers with technology-driven platforms. However, Figma focuses on design collaboration tools, while PagerDuty specializes in digital operations management through data analytics and machine learning. Their market caps differ significantly, reflecting distinct scales and possibly stages of growth within the software industry.
Income Statement Comparison
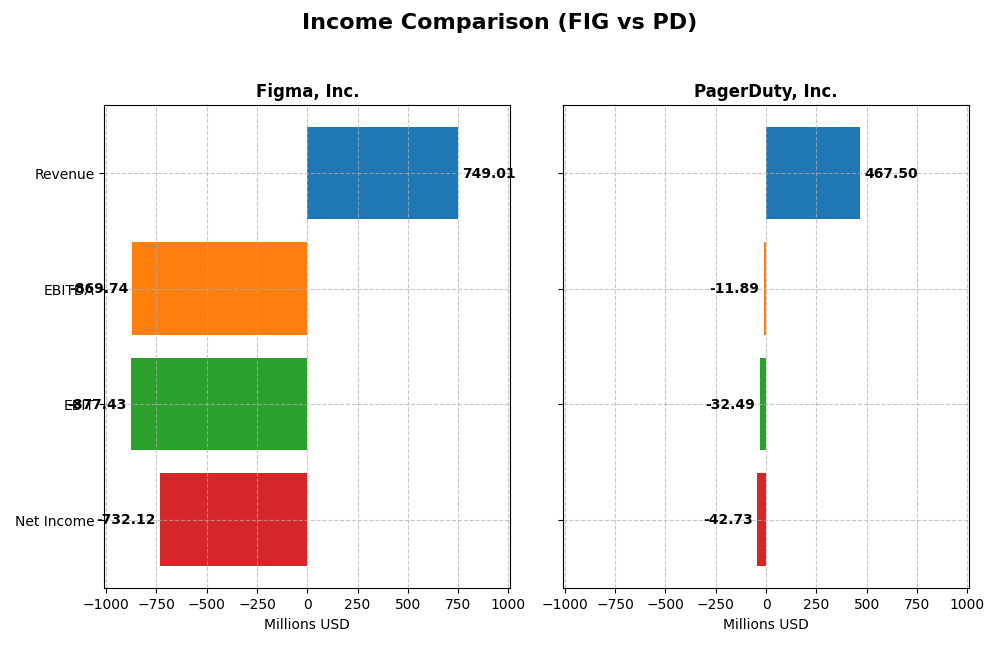
The table below presents a side-by-side comparison of key income statement metrics for Figma, Inc. and PagerDuty, Inc. for their most recent fiscal years.
| Metric | Figma, Inc. (2024) | PagerDuty, Inc. (2025) |
|---|---|---|
| Market Cap | 14.4B | 1.03B |
| Revenue | 749M | 467M |
| EBITDA | -870M | -12M |
| EBIT | -877M | -32M |
| Net Income | -732M | -43M |
| EPS | -3.11 | -0.59 |
| Fiscal Year | 2024 | 2025 |
Income Statement Interpretations
Figma, Inc.
Figma showed a strong revenue increase of 48.36% from 2023 to 2024, with gross margins remaining favorable at 88.32%. However, net income declined sharply to a negative $732M, reflecting a net margin of -97.74%. The latest year saw operating expenses grow in line with revenue, but significant losses persisted, indicating worsening profitability despite top-line growth.
PagerDuty, Inc.
PagerDuty’s revenue grew steadily by 8.54% from 2024 to 2025 and by nearly 119% over five years, with gross margins stable at 82.96%. The net income loss narrowed to -$42.7M in 2025, improving net margin to -9.14%. Operating expenses grew more moderately than revenue, supporting better EBIT and net margin improvements, signaling gradual progress towards profitability.
Which one has the stronger fundamentals?
PagerDuty demonstrates stronger fundamentals, with consistent revenue growth, improving net margins, and a favorable income statement evaluation of 85.71%. Figma, despite rapid revenue growth, suffers large losses and unfavorable margin trends, with 64.29% of income statement metrics rated unfavorable. PagerDuty’s more balanced growth and margin improvements suggest a more stable financial footing.
Financial Ratios Comparison
The table below presents the most recent financial ratios for Figma, Inc. (FIG) and PagerDuty, Inc. (PD) based on their fiscal year 2024 and 2025 data respectively, offering a snapshot of their financial health and operational efficiency.
| Ratios | Figma, Inc. (FIG) FY 2024 | PagerDuty, Inc. (PD) FY 2025 |
|---|---|---|
| ROE | -55.3% | -32.9% |
| ROIC | -59.7% | -9.7% |
| P/E | -70.7 | -39.9 |
| P/B | 39.1 | 13.1 |
| Current Ratio | 3.66 | 1.87 |
| Quick Ratio | 3.66 | 1.87 |
| D/E (Debt-to-Equity) | 0.022 | 3.57 |
| Debt-to-Assets | 1.6% | 50.0% |
| Interest Coverage | 0 | -6.46 |
| Asset Turnover | 0.42 | 0.50 |
| Fixed Asset Turnover | 17.1 | 16.6 |
| Payout Ratio | 0 | 0 |
| Dividend Yield | 0 | 0 |
Interpretation of the Ratios
Figma, Inc.
Figma shows a mixed ratio profile with significant weaknesses in profitability, including negative net margin (-97.74%) and return on equity (-55.29%), indicating operational challenges. Its liquidity appears strong with a high quick ratio (3.66), but the elevated price-to-book ratio (39.1) suggests overvaluation risks. Figma does not pay dividends, likely reinvesting earnings to fuel growth and innovation given its negative profitability metrics.
PagerDuty, Inc.
PagerDuty’s ratios reveal consistent profitability struggles, with negative net margin (-9.14%) and return on equity (-32.92%), alongside a high debt load (debt-to-assets at 50%). Its liquidity ratios are favorable, though interest coverage is negative (-3.51), raising solvency concerns. PagerDuty also does not distribute dividends, which aligns with its reinvestment strategy during a high-growth or restructuring phase.
Which one has the best ratios?
Both companies face profitability challenges and unfavorable global ratio evaluations. Figma benefits from stronger liquidity and lower leverage, but PagerDuty shows a slightly more moderate debt-to-equity stance despite solvency issues. Neither company pays dividends, reflecting reinvestment priorities. Overall, both have significant risks, with no clear dominance in ratio strength.
Strategic Positioning
This section compares the strategic positioning of Figma and PagerDuty, focusing on market position, key segments, and exposure to technological disruption:
Figma, Inc.
- Market leader in collaborative design tools facing high competition in software applications.
- Focuses on browser-based UI design tools serving design and development teams globally.
- Positioned in software design innovation with emerging AI tools; potential disruption from evolving design technologies.
PagerDuty, Inc.
- Competes in digital operations management with moderate competitive pressure.
- Provides machine learning-driven digital operations across multiple industries internationally.
- Uses advanced machine learning for operations management; exposed to rapid tech evolution in AI and data processing.
Figma vs PagerDuty Positioning
Figma concentrates on design collaboration with a specialized product suite, offering depth in UI tools, whereas PagerDuty adopts a diversified approach across various industries with a focus on digital operations and machine learning. Figma’s narrow focus may limit market breadth but enhances product specialization, while PagerDuty’s broader segments could dilute focus but increase market reach.
Which has the best competitive advantage?
Both companies currently shed value as their ROIC is below WACC. PagerDuty shows a slightly improving profitability trend, suggesting a modestly stronger competitive advantage compared to Figma’s significant decline, which indicates a very unfavorable moat position.
Stock Comparison
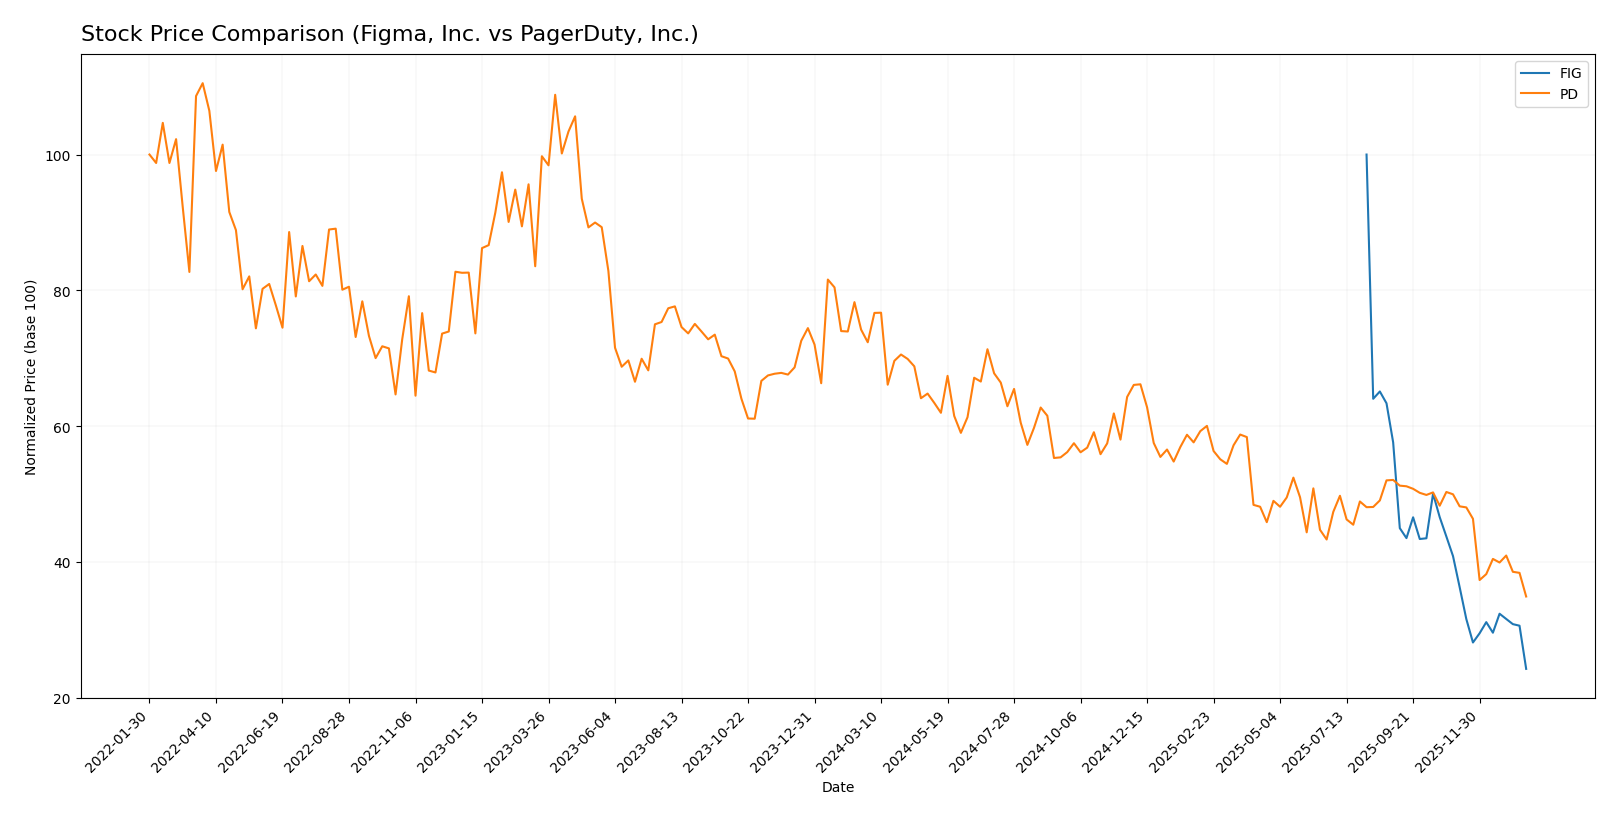
The stock price movements of Figma, Inc. (FIG) and PagerDuty, Inc. (PD) over the past year reveal significant declines with distinct trading volume dynamics and trend accelerations, highlighting contrasting investor behaviors.
Trend Analysis
Figma, Inc. (FIG) experienced a bearish trend over the past 12 months with a steep price drop of -75.76%, showing acceleration and high volatility (std deviation 19.95). The stock hit a high of 122.0 and a low of 29.57.
PagerDuty, Inc. (PD) also showed a bearish trend with a -51.76% price decline over the same period, but with deceleration and lower volatility (std deviation 2.92). Its price ranged between 24.66 and 11.22.
Comparing both, FIG’s stock delivered the largest market loss, declining more sharply than PD over the past year, despite both stocks trending downward.
Target Prices
Analysts present a clear consensus on target prices for Figma, Inc. and PagerDuty, Inc.
| Company | Target High | Target Low | Consensus |
|---|---|---|---|
| Figma, Inc. | 52 | 38 | 43.6 |
| PagerDuty, Inc. | 19 | 15 | 16.2 |
The consensus target prices suggest significant upside potential for both stocks compared to their current prices of $29.57 for Figma and $11.22 for PagerDuty. Analysts generally expect moderate to strong appreciation.
Analyst Opinions Comparison
This section compares analysts’ ratings and grades for Figma, Inc. and PagerDuty, Inc.:
Rating Comparison
Figma, Inc. Rating
- Rating: C+ indicating a very favorable overall evaluation.
- Discounted Cash Flow Score: 4, a favorable valuation metric.
- ROE Score: 1, very unfavorable efficiency in equity use.
- ROA Score: 1, very unfavorable asset utilization.
- Debt To Equity Score: 4, favorable financial risk profile.
- Overall Score: 2, moderate financial standing.
PagerDuty, Inc. Rating
- Rating: A- reflecting a very favorable overall evaluation.
- Discounted Cash Flow Score: 5, very favorable valuation metric.
- ROE Score: 5, very favorable equity efficiency.
- ROA Score: 5, very favorable asset utilization.
- Debt To Equity Score: 1, very unfavorable financial risk.
- Overall Score: 4, favorable financial standing.
Which one is the best rated?
Based strictly on the provided data, PagerDuty holds higher ratings and stronger scores in discounted cash flow, ROE, ROA, and overall metrics, despite a weaker debt-to-equity score compared to Figma.
Scores Comparison
Here is a comparison of the Altman Z-Score and Piotroski Score for Figma, Inc. and PagerDuty, Inc.:
FIG Scores
- Altman Z-Score: 14.34, indicates a safe zone with low bankruptcy risk.
- Piotroski Score: 4, assessed as average financial strength.
PD Scores
- Altman Z-Score: 1.26, falls in the distress zone, high bankruptcy risk.
- Piotroski Score: 7, considered strong financial health.
Which company has the best scores?
Based on the data, FIG shows a significantly higher Altman Z-Score indicating financial safety, while PD has a stronger Piotroski Score. FIG scores better in bankruptcy risk, PD in financial strength.
Grades Comparison
Here is the comparison of recent grades and ratings for Figma, Inc. and PagerDuty, Inc.:
Figma, Inc. Grades
The following table summarizes recent grades from notable financial institutions for Figma, Inc.:
| Grading Company | Action | New Grade | Date |
|---|---|---|---|
| Morgan Stanley | Maintain | Equal Weight | 2026-01-15 |
| Wells Fargo | Upgrade | Overweight | 2026-01-08 |
| RBC Capital | Maintain | Sector Perform | 2026-01-05 |
| Goldman Sachs | Maintain | Neutral | 2025-11-07 |
| JP Morgan | Maintain | Neutral | 2025-11-06 |
| Piper Sandler | Maintain | Overweight | 2025-11-06 |
| Wells Fargo | Maintain | Equal Weight | 2025-11-05 |
| Wells Fargo | Maintain | Equal Weight | 2025-09-04 |
| Morgan Stanley | Maintain | Equal Weight | 2025-09-04 |
| RBC Capital | Maintain | Sector Perform | 2025-09-04 |
Figma’s grades mostly remain stable, with a mix of Equal Weight, Neutral, and Sector Perform ratings, and a recent upgrade to Overweight by Wells Fargo.
PagerDuty, Inc. Grades
The following table presents recent grades from recognized rating agencies for PagerDuty, Inc.:
| Grading Company | Action | New Grade | Date |
|---|---|---|---|
| Truist Securities | Maintain | Buy | 2026-01-07 |
| RBC Capital | Downgrade | Sector Perform | 2026-01-05 |
| TD Cowen | Maintain | Buy | 2025-11-26 |
| Craig-Hallum | Downgrade | Hold | 2025-11-26 |
| Morgan Stanley | Maintain | Equal Weight | 2025-11-26 |
| RBC Capital | Maintain | Outperform | 2025-11-26 |
| Truist Securities | Maintain | Buy | 2025-11-19 |
| Baird | Maintain | Neutral | 2025-09-04 |
| RBC Capital | Maintain | Outperform | 2025-09-04 |
| Canaccord Genuity | Maintain | Buy | 2025-09-04 |
PagerDuty shows a wider range of grades including Buy, Hold, Neutral, and Outperform ratings with some recent downgrades but overall a positive bias.
Which company has the best grades?
PagerDuty, Inc. has received a broader and generally more positive range of grades, including multiple Buy and Outperform ratings, compared to Figma, Inc., which mostly has neutral to equal weight grades. This suggests PagerDuty might be viewed more favorably by analysts, potentially impacting investor sentiment and portfolio decisions.
Strengths and Weaknesses
Below is a comparative table highlighting the key strengths and weaknesses of Figma, Inc. (FIG) and PagerDuty, Inc. (PD) based on their recent financial and operational data.
| Criterion | Figma, Inc. (FIG) | PagerDuty, Inc. (PD) |
|---|---|---|
| Diversification | Limited product segmentation; focused on design tools | Limited product segmentation; focused on incident management software |
| Profitability | Negative net margin (-97.74%) and ROIC (-59.68%), shedding value | Negative net margin (-9.14%) and ROIC (-9.66%), but improving profitability trend |
| Innovation | High fixed asset turnover (17.09), showing efficient asset use | High fixed asset turnover (16.61), indicating efficient use of assets |
| Global presence | Not explicitly detailed; likely expanding but with challenges | Not explicitly detailed; steady growth with global ambitions |
| Market Share | Facing steep profitability decline, risk to maintain market share | Slightly unfavorable moat but growing ROIC suggests potential to stabilize market position |
Key takeaways: Both companies struggle with profitability and are currently value destroyers, but PagerDuty shows a slightly improving profitability trend. Efficiency in asset use is a shared strength, while limited diversification presents a risk for both. Caution is advised with a focus on risk management.
Risk Analysis
Below is a comparative risk table for Figma, Inc. (FIG) and PagerDuty, Inc. (PD) based on the latest available data for 2025-2026.
| Metric | Figma, Inc. (FIG) | PagerDuty, Inc. (PD) |
|---|---|---|
| Market Risk | High volatility, beta -3.8; share price down 6.4% recently | Moderate volatility, beta 0.63; share price down 5.0% recently |
| Debt Level | Very low debt (D/E 0.02), low debt to assets 1.6% | High debt (D/E 3.57), debt to assets 50% |
| Regulatory Risk | Moderate, US-based software sector | Moderate, operating internationally including Japan |
| Operational Risk | Negative margins and returns (net margin -97.7%, ROE -55.3%) | Negative margins but improving (net margin -9.1%, ROE -32.9%) |
| Environmental Risk | Low, software industry with limited physical footprint | Low, digital operations platform with limited environmental impact |
| Geopolitical Risk | Low, US-focused with no major geopolitical exposure | Moderate, international operations add some geopolitical uncertainty |
In synthesis, Figma faces significant operational and market volatility risks, reflected in its negative profitability and highly volatile beta, despite strong balance sheet health with minimal debt. PagerDuty shows improving operational metrics but carries higher financial risk due to its elevated debt levels and some geopolitical exposure from international markets. The most impactful risks are Figma’s market and operational instability and PagerDuty’s debt burden combined with moderate geopolitical uncertainties. Caution and close monitoring of profitability trends and debt servicing capacity are advised for both stocks.
Which Stock to Choose?
Figma, Inc. (FIG) shows a 48% revenue growth in 2024 but suffers from severe profitability issues with negative net margin and ROE of -55%. Debt levels are low, and liquidity ratios are mixed; however, overall financial ratios and the income statement trend are unfavorable, with a very unfavorable economic moat and a moderate rating of C+.
PagerDuty, Inc. (PD) presents steady revenue growth of 8.5% in 2025 with improving profitability indicators, despite a negative net margin of -9.14% and ROE of -33%. Debt is significantly higher than FIG’s, impacting financial risk, yet income statement evaluations are favorable, the economic moat is slightly unfavorable but improving, and the company holds a strong A- rating.
Investors seeking growth potential might perceive PagerDuty’s improving profitability and favorable income trends as more promising, while risk-averse investors may note Figma’s low debt but unfavorable profitability and financial ratios as cautionary. The choice could depend on the investor’s risk tolerance and preference for financial stability versus growth momentum.
Disclaimer: Investment carries a risk of loss of initial capital. The past performance is not a reliable indicator of future results. Be sure to understand risks before making an investment decision.
Go Further
I encourage you to read the complete analyses of Figma, Inc. and PagerDuty, Inc. to enhance your investment decisions: