In the dynamic world of software applications, Figma, Inc. and monday.com Ltd. stand out as innovative leaders transforming how teams collaborate and manage projects. Both companies operate within the technology sector, offering cloud-based solutions that enhance productivity and creativity, yet they differ in focus and market approach. This comparison will help investors identify which company presents the most compelling opportunity for their portfolio in 2026.
Table of contents
Companies Overview
I will begin the comparison between Figma and monday.com by providing an overview of these two companies and their main differences.
Figma Overview
Figma, Inc. develops a browser-based design tool focused on user interface creation that supports collaboration across design and development teams. Its product suite includes Figma Design for prototyping, Dev Mode for code inspection, and FigJam for team ideation. Founded in 2012 and headquartered in San Francisco, Figma positions itself as an innovator in collaborative digital design with a market cap of approximately 14.4B USD.
monday.com Overview
monday.com Ltd. offers a cloud-based visual work operating system enabling users to build customizable software applications and work management tools. Its solutions target marketing, CRM, project management, and software development sectors globally. Founded in 2012 and based in Tel Aviv, Israel, monday.com has a market cap near 6.5B USD and serves diverse organizations through modular, scalable workflow software.
Key similarities and differences
Both Figma and monday.com operate in the software application industry with a focus on enhancing productivity and collaboration via cloud-based platforms. While Figma centers on design and prototyping tools for creative teams, monday.com provides a broader work management OS adaptable to multiple business functions. The companies differ in market capitalization, geographic headquarters, and specific user bases, reflecting distinct niches within the technology sector.
Income Statement Comparison
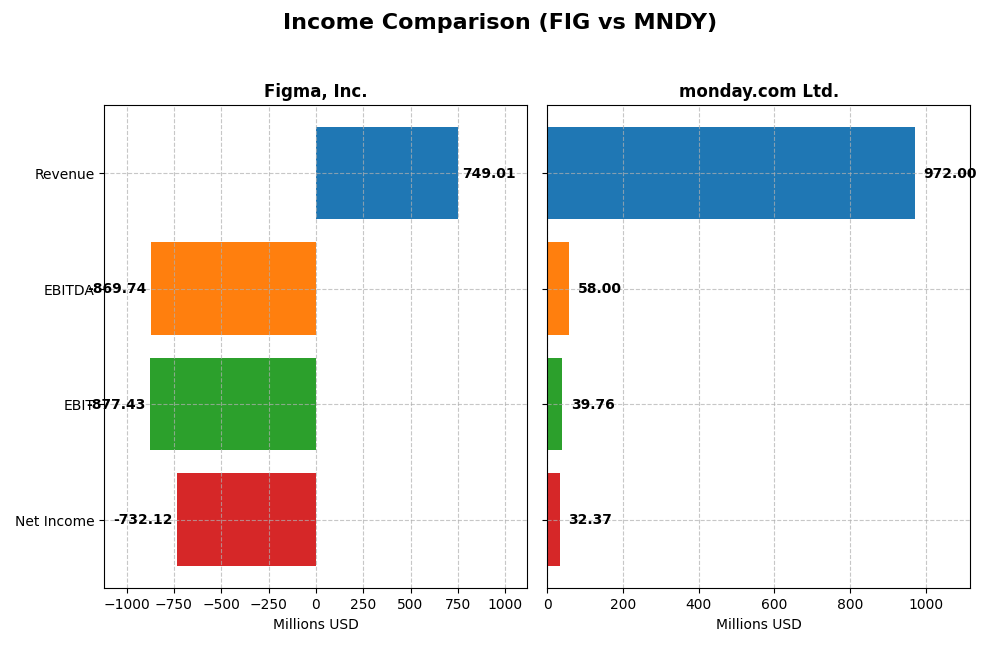
The table below presents a side-by-side comparison of the key income statement metrics for Figma, Inc. and monday.com Ltd. for the fiscal year 2024.
| Metric | Figma, Inc. (FIG) | monday.com Ltd. (MNDY) |
|---|---|---|
| Market Cap | 14.4B | 6.5B |
| Revenue | 749M | 972M |
| EBITDA | -870M | 58M |
| EBIT | -877M | 40M |
| Net Income | -732M | 32M |
| EPS | -3.11 | 0.65 |
| Fiscal Year | 2024 | 2024 |
Income Statement Interpretations
Figma, Inc.
Figma’s revenue grew significantly by 48.36% from 2023 to 2024, reaching $749M, while net income swung from a $286M profit in 2023 to a $732M loss in 2024. Gross margin remained strong at 88.32%, but operating and net margins deteriorated sharply, reflecting increased expenses and a negative EBIT margin of -117.15%. The latest year showed revenue growth but substantial margin erosion.
monday.com Ltd.
monday.com demonstrated robust revenue growth over 2020-2024, with 33.21% growth in 2024 alone, reaching $972M. Net income improved dramatically from a loss of $1.37B in 2020 to a $32M profit in 2024. Margins showed improvement, with a stable gross margin of 89.33%, a positive EBIT margin of 4.09%, and a net margin of 3.33%. The latest year marked continued margin expansion and profitability gains.
Which one has the stronger fundamentals?
monday.com presents stronger fundamentals with consistent revenue growth, improving profitability, and favorable margin trends over the period. Figma, despite solid revenue increases, suffered significant net income declines and margin contractions, indicating operational challenges. Overall, monday.com’s income statement reflects more favorable growth and margin stability compared to Figma’s unfavorable margin deterioration.
Financial Ratios Comparison
The table below presents a side-by-side comparison of key financial ratios for Figma, Inc. and monday.com Ltd. based on their most recent fiscal year data, 2024.
| Ratios | Figma, Inc. (FIG) | monday.com Ltd. (MNDY) |
|---|---|---|
| ROE | -55.3% | 3.14% |
| ROIC | -59.7% | -1.73% |
| P/E | -70.7 | 363 |
| P/B | 39.1 | 11.4 |
| Current Ratio | 3.66 | 2.66 |
| Quick Ratio | 3.66 | 2.66 |
| D/E | 0.022 | 0.103 |
| Debt-to-Assets | 1.6% | 6.3% |
| Interest Coverage | 0 | 0 |
| Asset Turnover | 0.42 | 0.58 |
| Fixed Asset Turnover | 17.1 | 7.13 |
| Payout Ratio | 0 | 0 |
| Dividend Yield | 0 | 0 |
Interpretation of the Ratios
Figma, Inc.
Figma’s ratios reveal significant weaknesses, with negative returns on equity (-55.29%) and invested capital (-59.68%), and an unfavorable net margin of -97.74%. The company shows a high price-to-book ratio (39.1) and a weak current ratio (3.66) despite a strong quick ratio. Figma does not pay dividends, likely prioritizing growth and reinvestment in its browser-based design software solutions.
monday.com Ltd.
monday.com presents a mixed picture with modestly positive net margin (3.33%) and return on equity (3.14%), though returns on invested capital remain negative (-1.73%). The company enjoys favorable liquidity ratios and interest coverage, but valuation multiples such as P/E (363) and P/B (11.41) are elevated. monday.com also does not pay dividends, emphasizing reinvestment and expansion in its work management platform.
Which one has the best ratios?
Neither company boasts a fully favorable ratio profile; Figma’s ratios are largely unfavorable, reflecting operational and profitability challenges. monday.com exhibits a more balanced ratio set with an overall neutral view, supported by better liquidity and coverage metrics. Thus, monday.com holds a comparatively stronger ratio position, although both face notable financial risks.
Strategic Positioning
This section compares the strategic positioning of Figma, Inc. and monday.com Ltd., focusing on market position, key segments, and exposure to technological disruption:
Figma, Inc.
- Recently IPOed with a $14.4B market cap, facing intense software application competition.
- Focuses on browser-based collaborative design tools for UI/UX and product development teams.
- Exposure to disruption through AI-powered design and integrated development workflow enhancements.
monday.com Ltd.
- Established with $6.5B market cap, competing in cloud-based work OS market globally.
- Provides cloud-based visual work OS and modular applications for work management across sectors.
- Exposure to disruption via modular, customizable cloud software adapting to diverse business needs.
Figma, Inc. vs monday.com Ltd. Positioning
Figma concentrates on collaborative design and prototyping tools with innovative AI integration, while monday.com offers a diversified cloud work OS platform serving multiple business functions, reflecting differing market scopes and product focuses.
Which has the best competitive advantage?
Both companies are shedding value with ROIC below WACC; however, monday.com shows improving profitability trends, whereas Figma’s profitability is declining, indicating a slightly stronger competitive advantage for monday.com based on recent MOAT evaluations.
Stock Comparison
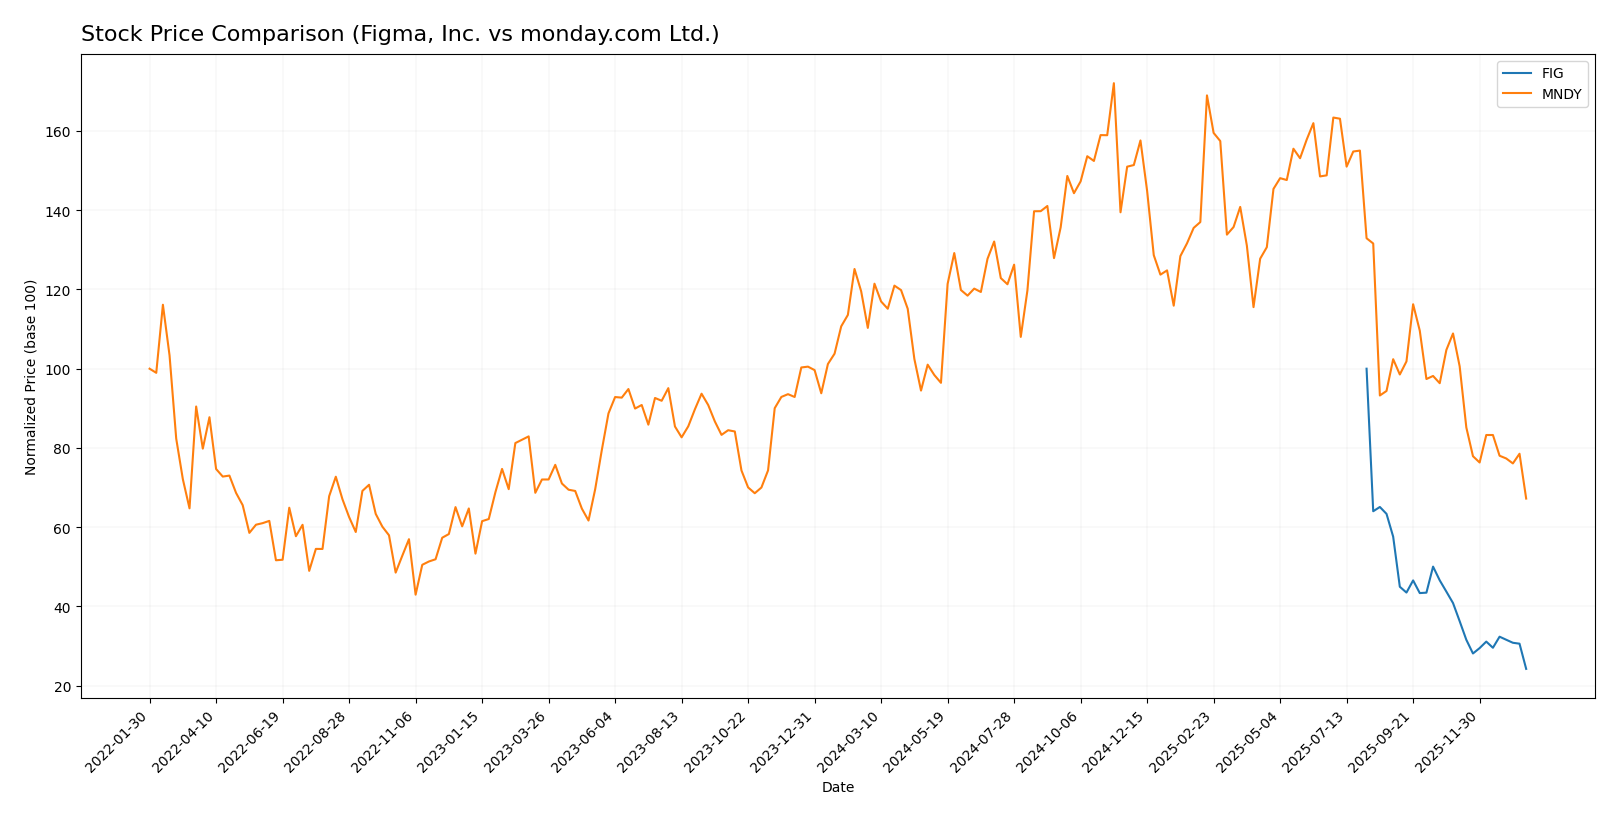
The stock prices of Figma, Inc. (FIG) and monday.com Ltd. (MNDY) have shown significant declines over the past year, reflecting bearish trading dynamics with distinct volatility patterns and volume trends.
Trend Analysis
Figma, Inc. (FIG) experienced a steep bearish trend with a -75.76% price change over the past 12 months, marked by accelerating decline and a high volatility level (std deviation 19.95). The recent trend continued downward by -40.67%.
monday.com Ltd. (MNDY) also displayed a bearish trend with a -39.06% price change over the past year. However, the decline showed deceleration despite higher volatility (std deviation 47.32). The recent drop was -38.27%, with pronounced negative slope.
Comparing the two, FIG’s stock suffered a larger decline and a more accelerated downward trend, resulting in the lowest market performance between the companies over the analyzed period.
Target Prices
Analyst consensus indicates a positive outlook for both Figma, Inc. and monday.com Ltd., with target prices significantly above current market prices.
| Company | Target High | Target Low | Consensus |
|---|---|---|---|
| Figma, Inc. | 52 | 38 | 43.6 |
| monday.com Ltd. | 330 | 194 | 264.42 |
For Figma, Inc., the consensus target price of 43.6 suggests a potential upside from the current price of 29.57. monday.com Ltd.’s target consensus at 264.42 also indicates strong growth prospects compared to its current price of 126.7.
Analyst Opinions Comparison
This section compares analysts’ ratings and financial grades for Figma, Inc. (FIG) and monday.com Ltd. (MNDY):
Rating Comparison
FIG Rating
- Rating: C+ with a status of Very Favorable
- Discounted Cash Flow Score: 4, indicating a Favorable rating
- ROE Score: 1, rated Very Unfavorable
- ROA Score: 1, rated Very Unfavorable
- Debt To Equity Score: 4, rated Favorable
- Overall Score: 2, rated Moderate
MNDY Rating
- Rating: B- with a status of Very Favorable
- Discounted Cash Flow Score: 4, indicating a Favorable rating
- ROE Score: 3, rated Moderate
- ROA Score: 3, rated Moderate
- Debt To Equity Score: 3, rated Moderate
- Overall Score: 3, rated Moderate
Which one is the best rated?
Based strictly on the provided data, MNDY holds a higher overall rating (B-) and better ROE and ROA scores than FIG. While both share a favorable DCF score, MNDY’s more balanced financial scores yield a moderately stronger rating overall.
Scores Comparison
Here is a comparison of the Altman Z-Score and Piotroski Score for Figma, Inc. and monday.com Ltd.:
FIG Scores
- Altman Z-Score: 14.3, indicating a strong safe zone.
- Piotroski Score: 4, reflecting average financial health.
MNDY Scores
- Altman Z-Score: 6.3, also in the safe zone but lower.
- Piotroski Score: 5, slightly better average financial health.
Which company has the best scores?
Both companies are in the Altman Z-Score safe zone, with FIG’s score substantially higher. MNDY has a marginally better Piotroski Score, indicating slightly stronger financial health by that metric.
Grades Comparison
Here is a comparison of the latest grades from reputable financial institutions for Figma, Inc. and monday.com Ltd.:
Figma, Inc. Grades
This table summarizes recent grades given by major financial firms to Figma, Inc.:
| Grading Company | Action | New Grade | Date |
|---|---|---|---|
| Morgan Stanley | Maintain | Equal Weight | 2026-01-15 |
| Wells Fargo | Upgrade | Overweight | 2026-01-08 |
| RBC Capital | Maintain | Sector Perform | 2026-01-05 |
| Goldman Sachs | Maintain | Neutral | 2025-11-07 |
| JP Morgan | Maintain | Neutral | 2025-11-06 |
| Piper Sandler | Maintain | Overweight | 2025-11-06 |
| Wells Fargo | Maintain | Equal Weight | 2025-11-05 |
| Wells Fargo | Maintain | Equal Weight | 2025-09-04 |
| Morgan Stanley | Maintain | Equal Weight | 2025-09-04 |
| RBC Capital | Maintain | Sector Perform | 2025-09-04 |
Figma’s grades predominantly reflect a neutral to hold stance, with a slight upgrade from Wells Fargo.
monday.com Ltd. Grades
The following table shows recent grades assigned by established grading companies to monday.com Ltd.:
| Grading Company | Action | New Grade | Date |
|---|---|---|---|
| BTIG | Maintain | Buy | 2026-01-15 |
| Barclays | Maintain | Overweight | 2026-01-12 |
| Jefferies | Maintain | Buy | 2026-01-05 |
| Citigroup | Maintain | Buy | 2025-12-23 |
| Tigress Financial | Maintain | Buy | 2025-12-11 |
| Baird | Maintain | Outperform | 2025-11-11 |
| Wells Fargo | Maintain | Overweight | 2025-11-11 |
| DA Davidson | Maintain | Buy | 2025-11-11 |
| Morgan Stanley | Maintain | Overweight | 2025-11-11 |
| Piper Sandler | Maintain | Overweight | 2025-11-11 |
monday.com consistently receives buy and overweight ratings, indicating a positive outlook from analysts.
Which company has the best grades?
monday.com Ltd. has received notably stronger grades with a majority of buy and outperform recommendations, suggesting higher analyst confidence compared to Figma, Inc., which mostly holds neutral or equal weight ratings. This difference may influence investors seeking more assertive endorsements.
Strengths and Weaknesses
Below is a comparison of key strengths and weaknesses for Figma, Inc. (FIG) and monday.com Ltd. (MNDY) based on the most recent financial and strategic data.
| Criterion | Figma, Inc. (FIG) | monday.com Ltd. (MNDY) |
|---|---|---|
| Diversification | Limited product segmentation, risk of narrow focus | Also limited product lines but with expanding features |
| Profitability | Negative net margin (-97.74%), high value destruction (ROIC -59.68%) | Slight positive net margin (3.33%), but ROIC slightly negative (-1.73%) |
| Innovation | High fixed asset turnover (17.09) indicates efficient asset use | Moderate fixed asset turnover (7.13), with growing ROIC trend |
| Global presence | Strong cash position (high quick ratio 3.66), but shrinking profitability | Healthy liquidity (quick ratio 2.66) and improving profitability trend |
| Market Share | High price-to-book (39.1) suggesting overvaluation risk | High P/E (362.98) reflecting growth expectations but valuation concerns |
Key takeaways: Figma currently shows significant value destruction with poor profitability and declining returns on capital, indicating caution. Monday.com, while also facing profitability challenges, demonstrates improving capital efficiency and a more balanced financial position, making it a comparatively less risky choice for investors seeking growth potential.
Risk Analysis
Below is a comparative table summarizing key risk factors for Figma, Inc. (FIG) and monday.com Ltd. (MNDY) based on the most recent 2024 data:
| Metric | Figma, Inc. (FIG) | monday.com Ltd. (MNDY) |
|---|---|---|
| Market Risk | High volatility, beta -3.8 (contrarian movement) | Moderate volatility, beta 1.25 |
| Debt level | Very low debt-to-equity 0.02, low debt-to-assets 1.6% | Low debt-to-equity 0.10, debt-to-assets 6.3% |
| Regulatory Risk | Moderate, US tech regulations | Moderate, international with exposure to Israel and global markets |
| Operational Risk | New IPO (2025), unprofitable with negative margins and ROE | Established IPO (2021), marginal profitability, moderate efficiency |
| Environmental Risk | Low direct environmental impact typical of software sector | Low direct environmental impact, similar sector risks |
| Geopolitical Risk | US-based, relatively stable geopolitical environment | Exposure to geopolitical tensions in Middle East region |
In synthesis, the most likely and impactful risks for Figma center on market volatility and operational losses as it navigates growth post-IPO with negative profitability metrics. For monday.com, geopolitical exposure and moderate market risk are key, though its financials are more stable but still show modest profitability. Both companies have low debt, mitigating financial risk, but high valuations and weak earnings require cautious risk management.
Which Stock to Choose?
Figma, Inc. (FIG) shows strong revenue growth of 48.36% in 2024 but suffers from unfavorable profitability metrics, including a -97.74% net margin and a declining return on invested capital (ROIC) well below its WACC. Its financial ratios are mixed, with 42.86% favorable but 57.14% unfavorable, reflecting weak operational efficiency and profitability despite low debt levels and a solid liquidity position. FIG holds a C+ rating with moderate overall scores, indicating financial challenges.
monday.com Ltd. (MNDY) exhibits favorable income growth with a 33.21% revenue increase and improving profitability metrics, including a positive net margin of 3.33% and growing ROIC, though still below WACC. Its financial ratios are balanced, with 42.86% favorable, 42.86% unfavorable, and 14.29% neutral, showing moderate operational efficiency and sound liquidity with manageable debt. MNDY has a B- rating and moderate overall financial scores.
Investors prioritizing growth potential might find Figma’s rapid revenue expansion appealing despite its profitability and value challenges, while those favoring improving profitability and balanced financial health might see monday.com as a more stable option given its growing ROIC and neutral rating. The choice could depend on one’s risk tolerance and investment strategy, weighing FIG’s value destruction against MNDY’s moderate financial improvement.
Disclaimer: Investment carries a risk of loss of initial capital. The past performance is not a reliable indicator of future results. Be sure to understand risks before making an investment decision.
Go Further
I encourage you to read the complete analyses of Figma, Inc. and monday.com Ltd. to enhance your investment decisions: