Home > Comparison > Technology > FIG vs MTCH
The strategic rivalry between Figma, Inc. and Match Group, Inc. shapes the evolving landscape of technology software applications. Figma operates as an innovative, collaborative design platform, emphasizing product development efficiency. In contrast, Match Group leads as a diversified dating service provider with a broad brand portfolio. This head-to-head pits cutting-edge design tools against established consumer engagement models. This analysis aims to identify which business model delivers superior risk-adjusted returns for a diversified technology portfolio.

Table of contents
Companies Overview
Figma and Match Group dominate distinct niches in the software application market with strong user engagement platforms.
Figma, Inc.: Collaborative Design Innovator
Figma leads in browser-based UI design tools that unite design and development teams. Its revenue stems from subscription fees for Figma Design, Dev Mode, FigJam, and AI-powered prototyping tools. In 2026, Figma emphasizes enhancing real-time collaboration and integrating AI to streamline product development cycles.
Match Group, Inc.: Global Dating Platform Leader
Match Group operates the world’s largest online dating portfolio, including Tinder and Match. It generates revenue primarily through premium subscriptions and advertising across its brands. The company focuses on expanding user engagement and monetization through personalized experiences and data-driven matchmaking.
Strategic Collision: Similarities & Divergences
Both companies excel in software applications centered on user interaction but diverge in ecosystem openness: Figma fosters open, collaborative platforms, while Match Group focuses on proprietary dating brands. Their primary battleground is user retention and monetization. Figma appeals to creators with innovation; Match Group targets consumers with scale and network effects, defining distinct risk and growth profiles.
Income Statement Comparison
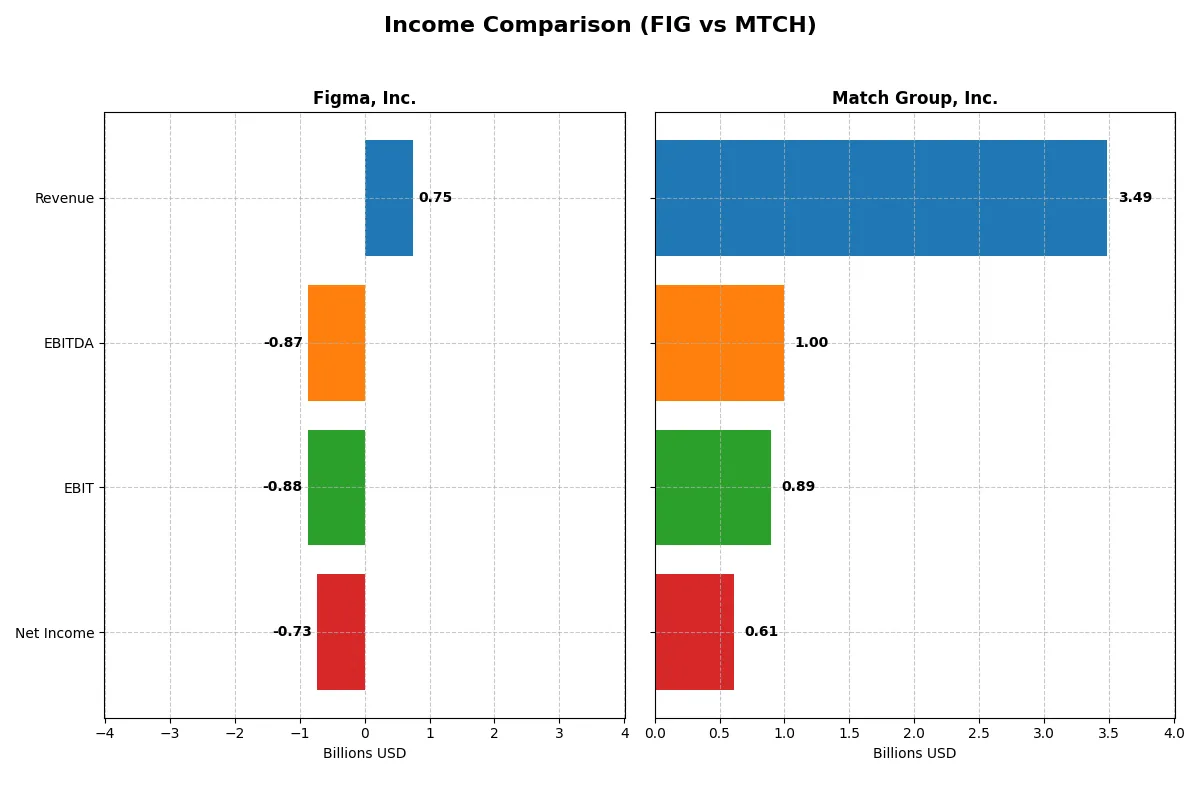
This data dissects the core profitability and scalability of both corporate engines to reveal who dominates the bottom line:
| Metric | Figma, Inc. (FIG) | Match Group, Inc. (MTCH) |
|---|---|---|
| Revenue | 749M | 3.49B |
| Cost of Revenue | 88M | 991M |
| Operating Expenses | 1.54B | 1.66B |
| Gross Profit | 661M | 2.49B |
| EBITDA | -870M | 952M |
| EBIT | -877M | 864M |
| Interest Expense | 0 | 160M |
| Net Income | -732M | 551M |
| EPS | -3.11 | 2.12 |
| Fiscal Year | 2024 | 2024 |
Income Statement Analysis: The Bottom-Line Duel
This income statement comparison reveals how efficiently each company converts revenue into profit and manages expenses to drive shareholder value.
Figma, Inc. Analysis
Figma’s revenue surged 48% to $749M in 2024, but net income plunged to a $732M loss. Its gross margin remains impressive at 88%, yet operating and net margins turned sharply negative due to skyrocketing expenses. The recent year highlights worsening profitability despite strong top-line momentum, signaling efficiency challenges.
Match Group, Inc. Analysis
Match Group’s revenue grew modestly by 0.2% to $3.49B in 2025, with net income rising to $613M. Its gross margin holds at a solid 73%, while EBIT and net margins improved to 25.6% and 17.6%, respectively. The company demonstrates consistent profitability and expense control, reflecting steady operational efficiency and margin expansion over time.
Margin Power vs. Revenue Scale
Match Group clearly outperforms Figma in profitability and margin stability despite slower revenue growth. Figma’s strong gross margin is undermined by heavy operating losses. For investors, Match Group’s balanced growth and positive earnings profile present a fundamentally more attractive and lower-risk opportunity.
Financial Ratios Comparison
These vital ratios act as a diagnostic tool to expose the underlying fiscal health, valuation premiums, and capital efficiency of the companies analyzed:
| Ratios | Figma, Inc. (FIG) | Match Group, Inc. (MTCH) |
|---|---|---|
| ROE | -55.3% (2024) | -2.42% (2025) |
| ROIC | -59.7% (2024) | 22.5% (2025) |
| P/E | -70.7 (2024) | 12.8 (2025) |
| P/B | 39.1 (2024) | -30.9 (2025) |
| Current Ratio | 3.66 (2024) | 1.42 (2025) |
| Quick Ratio | 3.66 (2024) | 1.42 (2025) |
| D/E | 0.022 (2024) | -15.7 (2025) |
| Debt-to-Assets | 1.6% (2024) | 89.1% (2025) |
| Interest Coverage | 0 (2024) | 5.91 (2025) |
| Asset Turnover | 0.42 (2024) | 0.78 (2025) |
| Fixed Asset Turnover | 17.1 (2024) | 26.6 (2025) |
| Payout ratio | 0% (2024) | 30.4% (2025) |
| Dividend yield | 0% (2024) | 2.38% (2025) |
| Fiscal Year | 2024 | 2025 |
Efficiency & Valuation Duel: The Vital Signs
Financial ratios act as a company’s DNA, unveiling hidden risks and operational strengths critical for informed investment decisions.
Figma, Inc.
Figma suffers from deeply negative profitability, with ROE at -55% and net margin near -98%, signaling operational distress. Its valuation appears stretched with a negative P/E and an elevated price-to-book ratio of 39.1. The company pays no dividend, instead reinvesting heavily in R&D, which accounts for 100% of revenue, aiming for long-term growth despite current losses.
Match Group, Inc.
Match Group posts a positive net margin of 17.6% and a strong ROIC at 22.5%, highlighting operational efficiency. Its valuation is reasonable, with a P/E of 12.8 and a favorable price-to-book ratio. The firm supports shareholders with a 2.4% dividend yield amid moderate leverage and solid interest coverage, balancing profitability with prudent capital allocation.
Operational Strength vs. Growth Gambit
Match Group offers a healthier mix of profitability and valuation metrics, reflecting operational stability and shareholder returns. Figma’s profile signals high risk with negative returns but aggressive reinvestment for growth. Investors seeking stability lean toward Match; those favoring growth potential might consider Figma’s ambitious strategy.
Which one offers the Superior Shareholder Reward?
Figma, Inc. (FIG) pays no dividends and has no buyback program, reinvesting heavily in R&D and growth despite recent negative free cash flow (-$0.15/share in 2024). Match Group, Inc. (MTCH) yields 2.38% with a 30% payout ratio and aggressive buybacks, delivering strong free cash flow ($4.2/share in 2025). I see MTCH’s balanced dividend and buyback strategy as more sustainable and rewarding for investors in 2026.
Comparative Score Analysis: The Strategic Profile
The radar chart reveals the fundamental DNA and trade-offs of Figma, Inc. and Match Group, Inc., highlighting their strategic strengths and vulnerabilities:
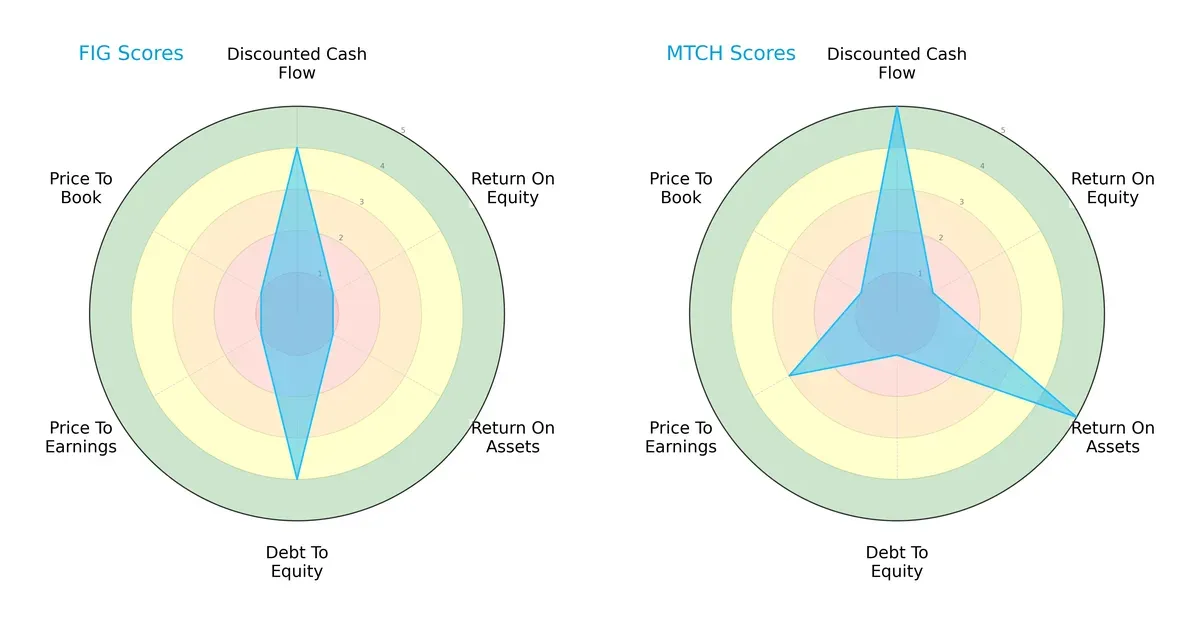
Figma shows strength in discounted cash flow and debt-to-equity, signaling good valuation and balance sheet management but weak profitability metrics like ROE and ROA. Match Group excels in asset efficiency and cash flow but carries higher financial risk with its debt profile. Match’s profile is more balanced with a focus on operational efficiency, while Figma relies heavily on conservative leverage and cash flow valuation.
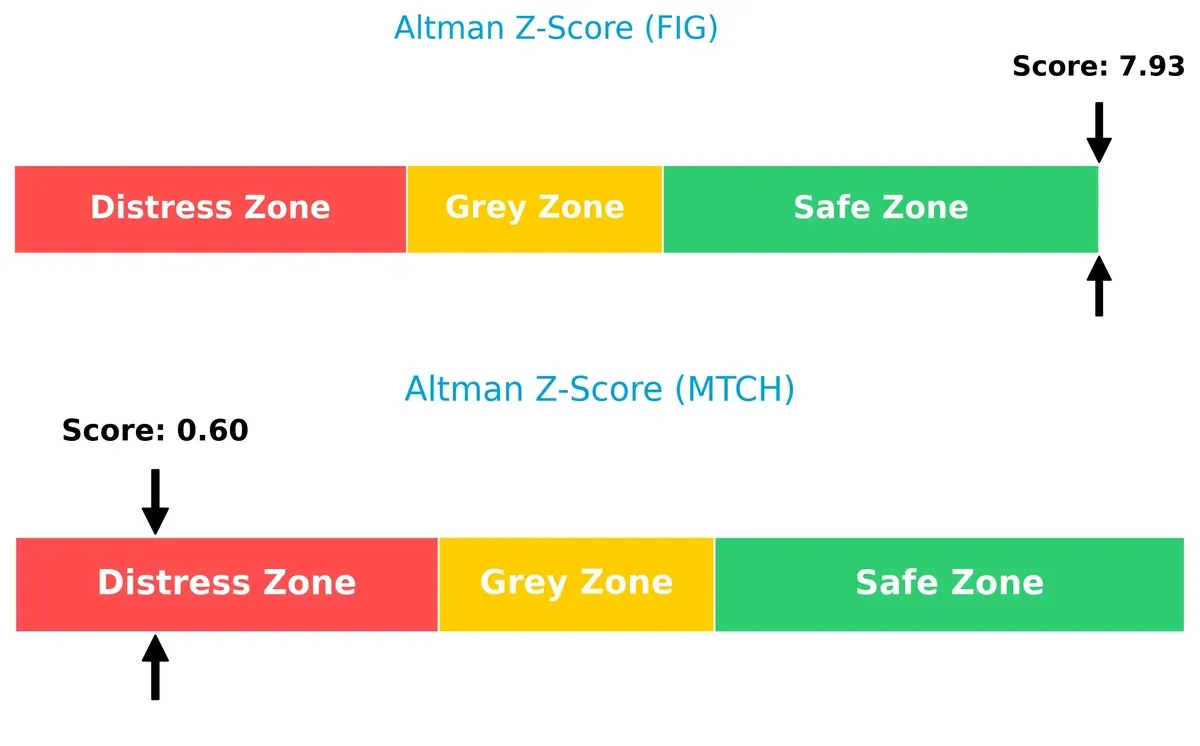
Bankruptcy Risk: Solvency Showdown
Match Group’s Altman Z-Score of 0.6 signals distress risk, while Figma’s 7.9 places it firmly in the safe zone. This gap highlights Figma’s superior financial resilience in this cycle:
Financial Health: Quality of Operations
Match Group’s Piotroski F-Score of 8 indicates very strong internal financial health. Figma’s score of 4 suggests average health with potential red flags in operational metrics:

How are the two companies positioned?
This section dissects the operational DNA of FIG and MTCH by comparing their revenue distribution and internal dynamics. The goal is to confront their economic moats and identify which model offers the most resilient competitive advantage today.
Revenue Segmentation: The Strategic Mix
This comparison dissects how Figma, Inc. and Match Group, Inc. diversify their income streams and reveals where their primary sector bets lie:
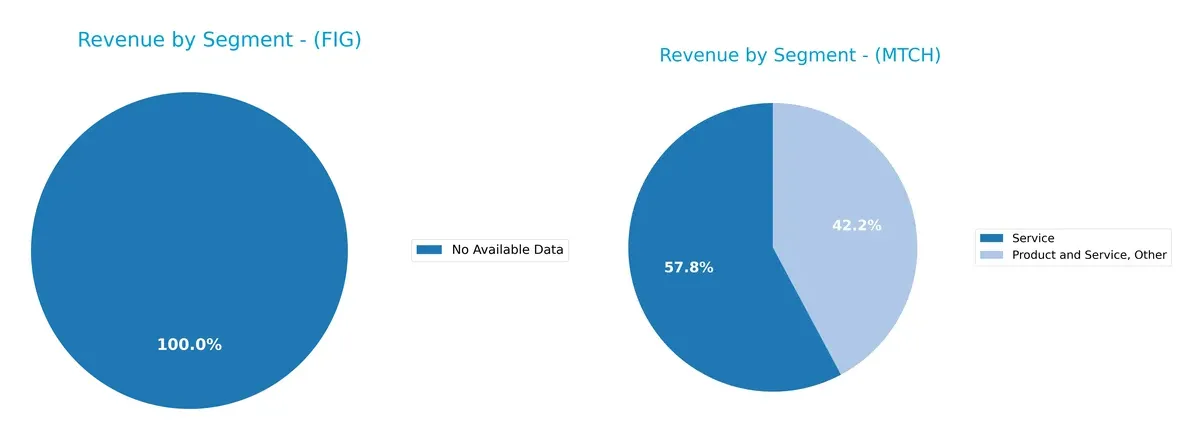
Figma lacks disclosed segment data, preventing segmentation analysis. Match Group anchors its revenues mainly in “Service” and “Product and Service, Other,” generating $1.35B and $989M in 2020. This mix signals reliance on core dating and adjacent digital services. Match Group’s moderate diversification cushions against single-market shocks but concentrates risk in consumer subscription ecosystems. I see this as a strategic bet on platform lock-in rather than broad sector spread.
Strengths and Weaknesses Comparison
This table compares the Strengths and Weaknesses of Figma, Inc. and Match Group, Inc.:
Figma Strengths
- Low debt-to-equity ratio at 0.02
- Favorable quick ratio of 3.66
- Strong fixed asset turnover at 17.09
Match Group Strengths
- Positive net margin of 17.59%
- Favorable ROIC at 22.5%
- Solid global revenue diversification
- Favorable PE ratio of 12.77
- Dividend yield at 2.38%
Figma Weaknesses
- Negative net margin (-97.74%) and ROE (-55.29%)
- Unfavorable PB ratio at 39.1
- Interest coverage at 0
- Low asset turnover at 0.42
Match Group Weaknesses
- Very high debt-to-assets at 89.06%
- Negative ROE (-241.99%)
- Moderate current ratio of 1.42
- Neutral asset turnover of 0.78
Figma shows financial conservatism with low leverage but struggles with profitability and asset utilization. Match Group demonstrates profitability and global reach but carries substantial debt risks. Both companies face profitability challenges, impacting capital allocation strategies.
The Moat Duel: Analyzing Competitive Defensibility
A structural moat is the only reliable shield protecting long-term profits from relentless competition erosion. Let’s dissect these firms’ moats:
Figma, Inc.: Innovation-Driven Intangible Assets
Figma’s moat stems from its innovative, browser-based collaborative design platform. Despite strong revenue growth, its negative ROIC signals value destruction. Future AI tools could deepen its moat if profitability stabilizes.
Match Group, Inc.: Network Effects and Brand Ecosystem
Match Group leverages powerful network effects across multiple dating brands, reflected in its stable and growing ROIC above WACC. Its broad user base fuels margin expansion and global growth opportunities.
Innovation Depth vs. Network Breadth: The Moat Face-off
Match Group’s network effect moat is wider and more durable, underpinned by strong ROIC and margin stability. Figma’s innovation moat shows promise but currently destroys value, making Match Group better positioned to defend market share.
Which stock offers better returns?
Both stocks show notable declines over the past year, with Figma, Inc. experiencing steep losses and Match Group, Inc. a milder decrease, reflecting distinct trading dynamics and volatility.
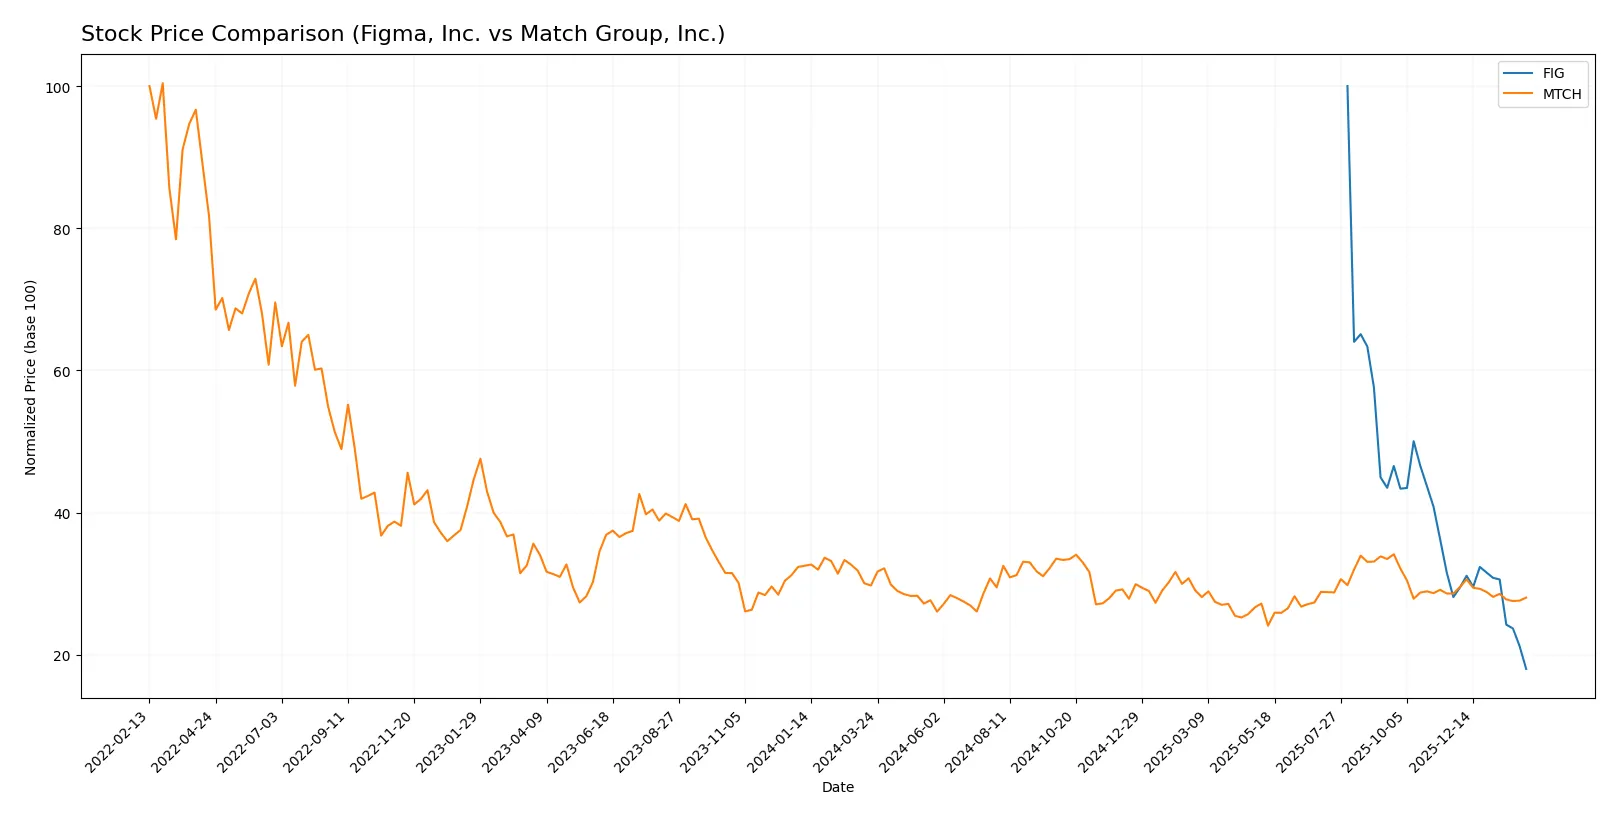
Trend Comparison
Figma, Inc. posted an 81.98% price decline over the past year, marking a bearish trend with accelerated losses and high volatility, hitting a low of 21.99 from a 122.0 high.
Match Group, Inc. declined 5.72% over the same period, also bearish but with decelerating losses and lower volatility, ranging between 27.18 and 38.51 in price.
Match Group’s stock outperformed Figma’s, delivering a smaller decline and more stable trading conditions, thus showing the highest relative market performance.
Target Prices
Analysts set a moderately optimistic target consensus for Figma, Inc. and Match Group, Inc.
| Company | Target Low | Target High | Consensus |
|---|---|---|---|
| Figma, Inc. | 35 | 52 | 42.17 |
| Match Group, Inc. | 33 | 43 | 36 |
The consensus target prices for FIG and MTCH exceed their current prices of $21.99 and $31.63, respectively, indicating expected upside in both stocks.

Don’t Let Luck Decide Your Entry Point
Optimize your entry points with our advanced ProRealTime indicators. You’ll get efficient buy signals with precise price targets for maximum performance. Start outperforming now!
How do institutions grade them?
Here is a summary of recent institutional grades for Figma, Inc. and Match Group, Inc.:
Figma, Inc. Grades
The table below shows Figma’s recent grades from major financial institutions.
| Grading Company | Action | New Grade | Date |
|---|---|---|---|
| Piper Sandler | Maintain | Overweight | 2026-02-03 |
| Morgan Stanley | Maintain | Equal Weight | 2026-01-15 |
| Wells Fargo | Upgrade | Overweight | 2026-01-08 |
| RBC Capital | Maintain | Sector Perform | 2026-01-05 |
| Goldman Sachs | Maintain | Neutral | 2025-11-07 |
Match Group, Inc. Grades
The recent institutional grades for Match Group are summarized in the table below.
| Grading Company | Action | New Grade | Date |
|---|---|---|---|
| TD Cowen | Maintain | Buy | 2026-02-05 |
| JP Morgan | Maintain | Neutral | 2026-02-04 |
| Truist Securities | Maintain | Hold | 2026-02-04 |
| Morgan Stanley | Maintain | Equal Weight | 2026-01-13 |
| Evercore ISI Group | Maintain | In Line | 2025-11-05 |
Which company has the best grades?
Match Group holds generally higher grades, including a recent “Buy” from TD Cowen, compared to Figma’s “Overweight” and “Equal Weight” ratings. Investors may view Match’s stronger buy-side support as a sign of more confident growth prospects.
Risks specific to each company
The following categories identify critical pressure points and systemic threats facing both firms in the 2026 market environment:
1. Market & Competition
Figma, Inc. (FIG)
- Faces intense competition in collaborative design software with rapid innovation cycles.
Match Group, Inc. (MTCH)
- Dominates global dating apps but faces saturation and emerging niche competitors.
2. Capital Structure & Debt
Figma, Inc. (FIG)
- Extremely low debt, signaling financial conservatism but limited leverage benefits.
Match Group, Inc. (MTCH)
- High debt-to-assets ratio (89%), increasing financial risk despite strong interest coverage.
3. Stock Volatility
Figma, Inc. (FIG)
- Exhibits very high negative beta (-3.58), indicating unusual and potentially destabilizing price swings.
Match Group, Inc. (MTCH)
- Moderate beta (1.32), reflecting expected market-related fluctuations.
4. Regulatory & Legal
Figma, Inc. (FIG)
- Operates in technology sector with evolving data privacy regulations impacting software services.
Match Group, Inc. (MTCH)
- Faces regulatory scrutiny over data privacy and online dating safety globally.
5. Supply Chain & Operations
Figma, Inc. (FIG)
- Relies on cloud infrastructure; risks include service outages and vendor dependency.
Match Group, Inc. (MTCH)
- Operates digital platforms; operational risks center on platform stability and user engagement.
6. ESG & Climate Transition
Figma, Inc. (FIG)
- ESG risks modest; software focus limits direct environmental impact, but social governance is critical.
Match Group, Inc. (MTCH)
- Faces increasing pressure to improve social governance and data ethics amid user base growth.
7. Geopolitical Exposure
Figma, Inc. (FIG)
- Primarily US-based with limited international operational exposure, reducing geopolitical risk.
Match Group, Inc. (MTCH)
- Global footprint exposes it to diverse geopolitical tensions and regulatory variability.
Which company shows a better risk-adjusted profile?
Match Group’s primary risk lies in its heavy debt load, which elevates financial risk despite strong profitability. Figma struggles with extreme stock volatility and weak profitability metrics. However, Figma’s conservative capital structure and robust Altman Z-Score suggest lower bankruptcy risk. Overall, Match Group offers a better risk-adjusted profile given its higher operational returns and favorable financial scores despite leverage concerns. The stark contrast in Figma’s negative margins and beta signals caution amid growth ambitions.
Final Verdict: Which stock to choose?
Figma, Inc. (FIG) wields a superpower in rapid revenue growth and strong liquidity, signaling potential for future scalability. However, its declining profitability and value destruction remain points of vigilance. FIG suits aggressive growth portfolios willing to navigate high volatility for disruptive innovation.
Match Group, Inc. (MTCH) commands a strategic moat with consistent value creation evidenced by a robust ROIC above WACC and steady free cash flow. It offers a safer profile than FIG, balancing growth with financial discipline. MTCH fits well within GARP portfolios seeking stable growth at a reasonable price.
If you prioritize aggressive growth and can tolerate profitability headwinds, FIG presents an intriguing scenario for high-risk, high-reward investors. However, if you seek a more stable investment with a durable competitive advantage and positive cash flow, MTCH outshines as the more prudent choice despite commanding a premium valuation.
Disclaimer: Investment carries a risk of loss of initial capital. The past performance is not a reliable indicator of future results. Be sure to understand risks before making an investment decision.
Go Further
I encourage you to read the complete analyses of Figma, Inc. and Match Group, Inc. to enhance your investment decisions: