In the dynamic world of software applications, Intuit Inc. and Figma, Inc. stand out as influential players shaping financial management and design collaboration. Intuit, a veteran in financial software, contrasts with Figma’s innovative approach to UI design and team productivity. Both companies operate within the technology sector but target distinct yet overlapping markets, making their strategies and growth prospects worthy of comparison. This article will help you decide which company presents the most compelling investment opportunity.
Table of contents
Companies Overview
I will begin the comparison between Intuit Inc. and Figma, Inc. by providing an overview of these two companies and their main differences.
Intuit Inc. Overview
Intuit Inc. focuses on financial management and compliance products for consumers, small businesses, and accounting professionals across the US, Canada, and internationally. Operating through segments like Small Business & Self-Employed and Credit Karma, Intuit provides solutions such as QuickBooks, TurboTax, and personal finance platforms. Founded in 1983 and headquartered in Mountain View, California, it is a well-established player in software applications for finance.
Figma, Inc. Overview
Figma, Inc. develops browser-based design tools aimed at helping teams create and collaborate on user interfaces and prototypes. Its product suite includes Figma Design, Dev Mode, FigJam, and AI-driven Figma Make, supporting design, feedback, and product development workflows. Incorporated in 2012 and based in San Francisco, California, Figma serves the software application industry with innovative collaborative design solutions.
Key similarities and differences
Both Intuit and Figma operate within the software application industry, focusing on delivering specialized tools to professional users. Intuit concentrates on financial management and compliance for businesses and individuals, while Figma targets design and development teams with collaborative UI tools. Intuit’s business model is diversified across multiple financial segments, whereas Figma centers on a unified platform for interface design and prototyping, reflecting distinct user needs and market approaches.
Income Statement Comparison
This table compares key income statement metrics for Intuit Inc. and Figma, Inc. based on their most recent fiscal year data.
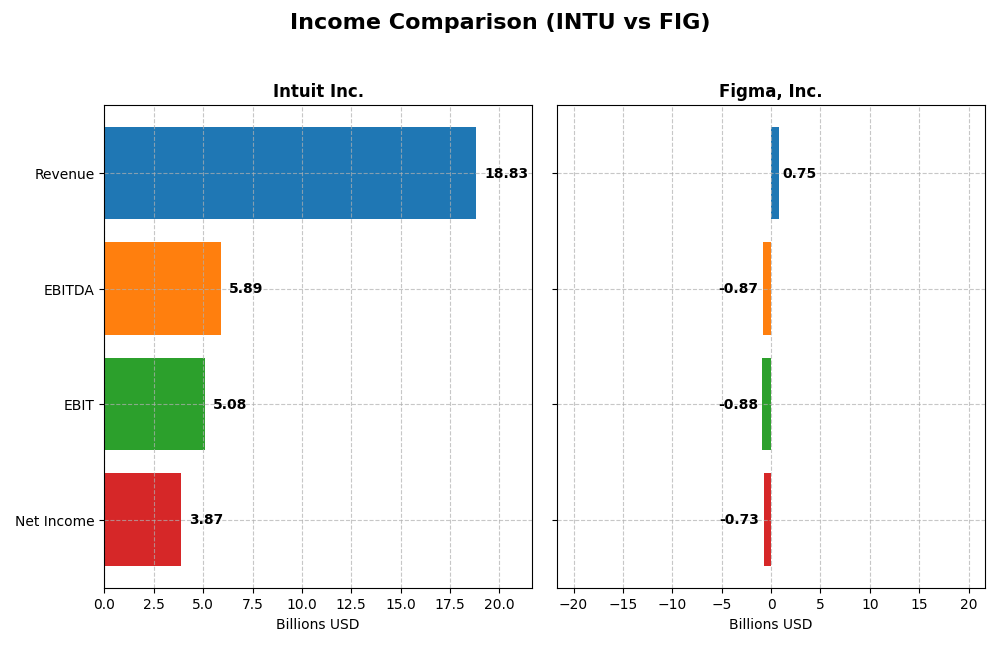
| Metric | Intuit Inc. (INTU) | Figma, Inc. (FIG) |
|---|---|---|
| Market Cap | 151.3B | 14.5B |
| Revenue | 18.8B | 749M |
| EBITDA | 5.89B | -870M |
| EBIT | 5.08B | -877M |
| Net Income | 3.87B | -732M |
| EPS | 13.82 | -3.11 |
| Fiscal Year | 2025 | 2024 |
Income Statement Interpretations
Intuit Inc.
Intuit’s revenue and net income have shown strong upward trends from 2021 to 2025, nearly doubling revenue and increasing net income by 87.6%. Margins remain robust, with a gross margin around 80.8% and a net margin above 20%. In 2025, revenue growth accelerated by 15.6%, accompanied by a 13% rise in net margin, reflecting improved profitability and operational efficiency.
Figma, Inc.
Figma’s revenue grew significantly by 48.4% between 2023 and 2024, with gross margin at a high 88.3%. However, the company reported a net loss with a negative net margin near -97.7%, worsened by a sharp decline in EBIT margin to -117.1%. Despite revenue growth, escalating operating expenses heavily impacted profitability in the latest fiscal year.
Which one has the stronger fundamentals?
Intuit demonstrates stronger fundamentals with consistent revenue and net income growth, favorable margins, and improving profitability metrics. Conversely, Figma’s high revenue growth is overshadowed by sustained losses and unfavorable margins, reflecting operational challenges. Intuit’s stable and positive income statement contrasts with Figma’s unfavorable overall income evaluations.
Financial Ratios Comparison
The table below presents the key financial ratios for Intuit Inc. and Figma, Inc. based on their most recent fiscal year data, providing a snapshot of their profitability, liquidity, leverage, and market valuation.
| Ratios | Intuit Inc. (2025) | Figma, Inc. (2024) |
|---|---|---|
| ROE | 19.6% | -55.3% |
| ROIC | 14.8% | -59.7% |
| P/E | 56.8 | -70.7 |
| P/B | 11.2 | 39.1 |
| Current Ratio | 1.36 | 3.66 |
| Quick Ratio | 1.36 | 3.66 |
| D/E | 0.34 | 0.02 |
| Debt-to-Assets | 18.0% | 1.6% |
| Interest Coverage | 19.9 | 0 |
| Asset Turnover | 0.51 | 0.42 |
| Fixed Asset Turnover | 12.5 | 17.1 |
| Payout ratio | 30.7% | 0 |
| Dividend yield | 0.54% | 0 |
Interpretation of the Ratios
Intuit Inc.
Intuit’s financial ratios are largely strong, with favorable net margin (20.55%), ROE (19.63%), and ROIC (14.78%) indicating efficient profitability and capital use. However, valuation ratios such as P/E (56.82) and P/B (11.15) are unfavorable, suggesting a potentially high market price. The company maintains a modest dividend yield of 0.54%, supported by stable payouts and free cash flow coverage, with some caution advised on low yield.
Figma, Inc.
Figma shows weak financial ratios, including a negative net margin (-97.74%), ROE (-55.29%), and ROIC (-59.68%), reflecting losses and inefficient capital deployment. Despite a favorable WACC (4.71%) and low debt levels, the company does not pay dividends, likely due to ongoing investments and a growth-focused strategy. Its elevated P/B ratio (39.1) and poor interest coverage highlight operational and financial risks.
Which one has the best ratios?
Intuit presents a more favorable overall ratio profile, with stronger profitability, capital returns, and financial stability. In contrast, Figma’s ratios reveal significant losses and operational challenges, with fewer favorable metrics. Intuit’s balanced risk metrics and dividend payments contrast with Figma’s growth-stage financial weaknesses, positioning Intuit as the company with superior ratio performance.
Strategic Positioning
This section compares the strategic positioning of Intuit Inc. and Figma, Inc. across Market position, Key segments, and Exposure to technological disruption:
Intuit Inc.
- Large market cap of 151B with diversified software products facing competitive pressure in financial sectors.
- Operates in four segments: Small Business, Consumer, Credit Karma, and ProConnect, driving broad revenue streams.
- Exposure to disruption through cloud-based and AI-enhanced financial and design tools, adapting product offerings.
Figma, Inc.
- Smaller market cap of 14.5B focused on collaborative UI design tools, competing in a niche software market.
- Concentrates on browser-based design and prototyping tools targeting design and development teams.
- Faces disruption risk in fast-evolving design software with AI integration and collaborative innovations.
Intuit Inc. vs Figma, Inc. Positioning
Intuit demonstrates a diversified business model with multiple revenue streams from financial management and tax services, offering stability and scale advantages. Figma, by contrast, has a concentrated focus on design collaboration software, which may limit revenue sources but allows specialization.
Which has the best competitive advantage?
Intuit shows a slightly favorable economic moat by creating value despite a declining ROIC trend, indicating efficient capital use. Figma exhibits a very unfavorable moat with declining profitability, suggesting challenges in maintaining a competitive advantage over time.
Stock Comparison
The stock prices of Intuit Inc. and Figma, Inc. have both experienced significant declines over the past year, with varying degrees of volatility and trading activity influencing their downward trajectories.

Trend Analysis
Intuit Inc.’s stock shows a bearish trend with a -17.58% price change over the past 12 months. The trend exhibits deceleration, a high volatility level (std deviation 51.54), and price fluctuation between 543.83 and 785.95. Recent weeks confirm continued bearish momentum.
Figma, Inc.’s stock also demonstrates a bearish trend with a steeper -75.52% decline over the last year. The downward trend is accelerating despite lower volatility (std deviation 19.93) and a price range from 29.86 to 122.0. Recent data indicate persistent selling pressure.
Comparing both, Intuit’s stock outperformed Figma’s over the past year, showing a smaller decline and higher buyer volume, while Figma faced heavier losses and dominant seller activity.
Target Prices
The current analyst consensus indicates promising upside potential for both Intuit Inc. and Figma, Inc.
| Company | Target High | Target Low | Consensus |
|---|---|---|---|
| Intuit Inc. | 880 | 700 | 798.4 |
| Figma, Inc. | 52 | 38 | 43.6 |
Analysts expect Intuit’s shares to trade significantly above the current price of $543.6, signaling strong growth prospects. Figma’s consensus target of $43.6 also suggests upside from today’s $29.83 trading level.
Analyst Opinions Comparison
This section compares analysts’ ratings and financial scores for Intuit Inc. and Figma, Inc.:
Rating Comparison
INTU Rating
- Rating: B, indicating a very favorable overall evaluation by analysts.
- Discounted Cash Flow Score: 4, a favorable score reflecting optimism on valuation.
- ROE Score: 4, favorable, showing efficient profit generation from equity.
- ROA Score: 5, very favorable, demonstrating excellent asset utilization.
- Debt To Equity Score: 2, moderate, suggesting some financial leverage risk.
- Overall Score: 3, moderate overall financial standing.
FIG Rating
- Rating: C+, also considered very favorable but lower than INTU’s rating.
- Discounted Cash Flow Score: 4, equally favorable assessment on cash flow value.
- ROE Score: 1, very unfavorable, indicating low efficiency in generating profits.
- ROA Score: 1, very unfavorable, reflecting poor asset utilization.
- Debt To Equity Score: 4, favorable, indicating lower financial risk.
- Overall Score: 2, moderate but lower than INTU’s overall score.
Which one is the best rated?
Based strictly on the provided data, Intuit Inc. (INTU) is better rated than Figma, Inc. (FIG). INTU has higher overall, ROE, and ROA scores, while FIG performs better only in debt to equity. INTU’s rating is also higher at B versus C+.
Scores Comparison
Here is a comparison of the financial scores for Intuit Inc. and Figma, Inc.:
INTU Scores
- Altman Z-Score: 9.35, indicating a safe zone with low bankruptcy risk.
- Piotroski Score: 9, classified as very strong financial health.
FIG Scores
- Altman Z-Score: 14.34, indicating a safe zone with very low bankruptcy risk.
- Piotroski Score: 4, classified as average financial health.
Which company has the best scores?
Based strictly on the provided data, FIG has a higher Altman Z-Score indicating a stronger bankruptcy safety margin. However, INTU scores significantly better on the Piotroski Score, reflecting stronger overall financial health.
Grades Comparison
Here is a detailed comparison of the latest grades assigned to Intuit Inc. and Figma, Inc.:
Intuit Inc. Grades
This table shows recent grades and actions from reputable financial institutions for Intuit Inc.:
| Grading Company | Action | New Grade | Date |
|---|---|---|---|
| Wells Fargo | Downgrade | Equal Weight | 2026-01-08 |
| Wells Fargo | Maintain | Overweight | 2025-11-21 |
| RBC Capital | Maintain | Outperform | 2025-11-21 |
| BMO Capital | Maintain | Outperform | 2025-11-21 |
| Evercore ISI Group | Maintain | Outperform | 2025-11-18 |
| RBC Capital | Maintain | Outperform | 2025-09-02 |
| RBC Capital | Maintain | Outperform | 2025-08-22 |
| UBS | Maintain | Neutral | 2025-08-22 |
| Morgan Stanley | Maintain | Overweight | 2025-08-22 |
| Barclays | Maintain | Overweight | 2025-08-22 |
Intuit’s grades predominantly indicate Outperform and Overweight ratings, with a recent downgrade to Equal Weight by Wells Fargo signaling some caution.
Figma, Inc. Grades
This table displays recent grade updates from recognized grading companies for Figma, Inc.:
| Grading Company | Action | New Grade | Date |
|---|---|---|---|
| Morgan Stanley | Maintain | Equal Weight | 2026-01-15 |
| Wells Fargo | Upgrade | Overweight | 2026-01-08 |
| RBC Capital | Maintain | Sector Perform | 2026-01-05 |
| Goldman Sachs | Maintain | Neutral | 2025-11-07 |
| JP Morgan | Maintain | Neutral | 2025-11-06 |
| Piper Sandler | Maintain | Overweight | 2025-11-06 |
| Wells Fargo | Maintain | Equal Weight | 2025-11-05 |
| Wells Fargo | Maintain | Equal Weight | 2025-09-04 |
| Morgan Stanley | Maintain | Equal Weight | 2025-09-04 |
| RBC Capital | Maintain | Sector Perform | 2025-09-04 |
Figma’s ratings are mostly Equal Weight, Sector Perform, and Neutral, with a recent upgrade to Overweight by Wells Fargo suggesting moderate optimism.
Which company has the best grades?
Intuit Inc. generally holds stronger grades, including multiple Outperform and Overweight ratings, compared to Figma’s mostly Hold and Neutral evaluations. This implies Intuit may be viewed more favorably by analysts, potentially affecting investor confidence and portfolio decisions.
Strengths and Weaknesses
Below is a comparative overview of key strengths and weaknesses for Intuit Inc. (INTU) and Figma, Inc. (FIG) based on the most recent financial and strategic data.
| Criterion | Intuit Inc. (INTU) | Figma, Inc. (FIG) |
|---|---|---|
| Diversification | Highly diversified revenue streams: strong Consumer, Small Business & Self-Employed, and Credit Karma segments with combined revenue exceeding 18B USD in 2025 | Limited diversification; primarily focused on design software with no reported revenue segmentation |
| Profitability | Strong profitability: 20.55% net margin, 19.63% ROE, ROIC at 14.78%, creating value but with slightly declining ROIC trend | Negative profitability: net margin -97.74%, ROE -55.29%, ROIC -59.68%; shedding value with rapidly declining ROIC |
| Innovation | Consistent innovation in financial software and tax solutions, maintaining competitive advantage | Innovation-driven but struggling to convert into profitability and sustainable value creation |
| Global presence | Established global presence through multiple business segments and acquisitions | Emerging global presence but limited scale compared to INTU |
| Market Share | Strong market position in financial software and tax services segments | Growing market share in creative software, but financial metrics indicate risk |
Intuit demonstrates solid diversification and profitability with a favorable overall financial position despite a slight decline in ROIC. In contrast, Figma shows significant challenges with unprofitable operations and value destruction, reflecting high risk for investors despite its innovative potential.
Risk Analysis
The table below summarizes key risk factors for Intuit Inc. and Figma, Inc. based on the most recent data available.
| Metric | Intuit Inc. (INTU) | Figma, Inc. (FIG) |
|---|---|---|
| Market Risk | Beta 1.25, moderately volatile | Beta -3.80, highly volatile |
| Debt level | Low debt/equity (0.34), favorable | Very low debt/equity (0.02), favorable |
| Regulatory Risk | Moderate, in financial software sector | Moderate, growing SaaS regulatory scrutiny |
| Operational Risk | Stable with 18.8K employees, strong margins | Higher risk due to negative margins and smaller size (1.6K employees) |
| Environmental Risk | Low, typical for software industry | Low, typical for software industry |
| Geopolitical Risk | Moderate, global operations including US & Canada | Moderate, US-based with expanding global presence |
Intuit shows lower financial and operational risks with strong profitability and stable debt levels, but faces moderate market volatility and regulatory factors. Figma carries higher market and operational risks, with significant losses and volatility, though debt risk is minimal. Investors should weigh Intuit’s stability against Figma’s growth potential and elevated risk profile.
Which Stock to Choose?
Intuit Inc. (INTU) shows a favorable income evolution with a 15.63% revenue growth in 2025 and strong profitability metrics including a 20.55% net margin and 19.63% ROE. Its debt levels are moderate and financial ratios are mostly favorable, supported by a very favorable rating and solid scores indicating financial stability.
Figma, Inc. (FIG) exhibits rapid revenue growth of 48.36% in 2024 but suffers from negative profitability with a -97.74% net margin and -55.29% ROE. Despite low debt levels and a strong current ratio, its financial ratios and income statement evaluations are mostly unfavorable, reflected in a very favorable rating yet average financial strength scores.
For investors, INTU’s favorable rating, strong profitability, and value-creating moat might appeal to those prioritizing stability and quality investing. In contrast, FIG’s rapid growth but negative profitability and value-destroying profile could be more suitable for risk-tolerant investors focused on high growth potential despite elevated risks.
Disclaimer: Investment carries a risk of loss of initial capital. The past performance is not a reliable indicator of future results. Be sure to understand risks before making an investment decision.
Go Further
I encourage you to read the complete analyses of Intuit Inc. and Figma, Inc. to enhance your investment decisions: