Home > Comparison > Financial Services > USB vs FITB
The strategic rivalry between U.S. Bancorp and Fifth Third Bancorp shapes the regional banking landscape in the U.S. U.S. Bancorp operates as a diversified financial services giant with extensive corporate and commercial banking operations, while Fifth Third Bancorp focuses on a more concentrated regional banking model with strong consumer lending and wealth management segments. This analysis will dissect their operational strengths and risks to identify which offers superior risk-adjusted potential for a diversified portfolio.
Table of contents
Companies Overview
U.S. Bancorp and Fifth Third Bancorp stand as major regional banking forces with significant market footprints in the U.S.
U.S. Bancorp: Midwest and West Banking Powerhouse
U.S. Bancorp dominates as a diversified financial services holding company. It generates revenue through corporate and commercial banking, consumer banking, wealth management, and payment services. In 2021, it focused on expanding its digital offerings and enhancing treasury and capital markets solutions. Its broad service array and expansive ATM network support a strong competitive position.
Fifth Third Bancorp: Regional Financial Services Specialist
Fifth Third Bancorp operates as a diversified financial services firm with a stronghold in the Midwest and Southeast. Its core revenue streams include commercial banking, branch banking, consumer lending, and wealth management. In 2021, the company emphasized growth in commercial lending and asset management, targeting business and government clients across multiple states with tailored credit and cash management solutions.
Strategic Collision: Similarities & Divergences
Both banks prioritize diversified financial services but diverge in scale and regional reach. U.S. Bancorp’s strategy leans toward broad digital integration and nationwide corporate services. Fifth Third focuses more on regional commercial lending and personalized branch banking. Their primary battleground is commercial banking market share in the Midwest. Investment profiles differ substantially: U.S. Bancorp commands a larger market cap and operational scale, while Fifth Third offers a more concentrated regional play with growth in niche lending segments.
Income Statement Comparison
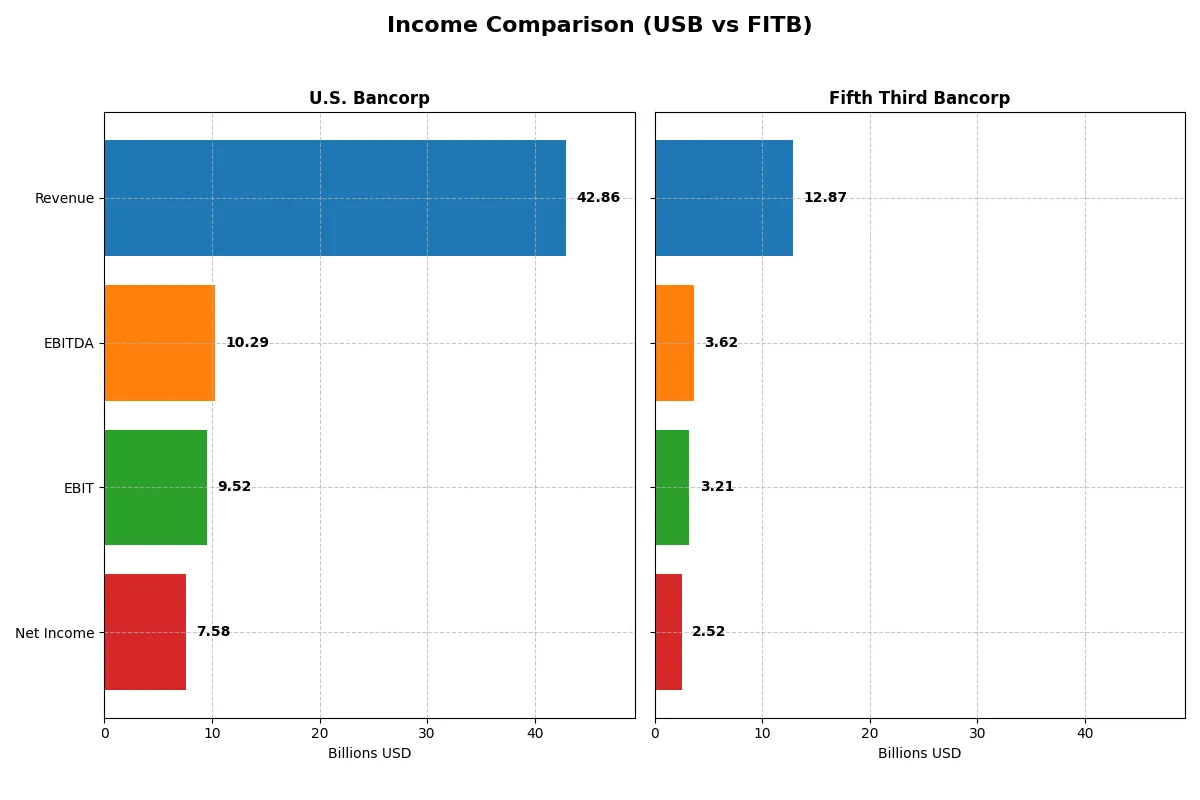
This data dissects the core profitability and scalability of both corporate engines to reveal who dominates the bottom line:
| Metric | U.S. Bancorp (USB) | Fifth Third Bancorp (FITB) |
|---|---|---|
| Revenue | 42.9B | 12.9B |
| Cost of Revenue | 15.9B | 4.5B |
| Operating Expenses | 17.4B | 5.2B |
| Gross Profit | 26.9B | 8.4B |
| EBITDA | 10.3B | 3.6B |
| EBIT | 9.5B | 3.2B |
| Interest Expense | 14.3B | 3.9B |
| Net Income | 7.6B | 2.5B |
| EPS | 4.62 | 3.55 |
| Fiscal Year | 2025 | 2025 |
Income Statement Analysis: The Bottom-Line Duel
This income statement comparison will uncover which company runs its financial engine with greater efficiency and momentum through recent market cycles.
U.S. Bancorp Analysis
U.S. Bancorp’s revenue rose steadily from 23.7B in 2021 to 42.9B in 2025, reflecting robust top-line growth of 80.7% over five years. Net income showed volatility, dipping overall by 4.9%. Gross margin remains strong at 62.8%, with net margin at 17.7% in 2025, indicating good profitability. Efficiency improved sharply in 2025, with EBIT surging 20.3%, signaling operational momentum.
Fifth Third Bancorp Analysis
Fifth Third Bancorp grew revenue from 7.9B in 2021 to 12.9B in 2025, marking a 61.9% increase over five years. Net income declined by 8.9% in this period despite a healthy gross margin of 65.3% and a net margin of 19.6% in 2025, suggesting disciplined cost control. EBIT expanded by 10.1% in the latest year, showing solid but slower efficiency gains versus its peer.
Revenue Scale vs. Margin Strength
U.S. Bancorp outpaces Fifth Third in revenue scale with a more pronounced growth trajectory and stronger EBIT momentum. Fifth Third boasts a higher gross and net margin, reflecting tighter cost control. For investors prioritizing scale and accelerating operating income, U.S. Bancorp wins. Those favoring margin dominance and cost efficiency may find Fifth Third’s profile more appealing.
Financial Ratios Comparison
These vital ratios act as a diagnostic tool to expose the underlying fiscal health, valuation premiums, and capital efficiency of the companies compared below:
| Ratios | U.S. Bancorp (USB) | Fifth Third Bancorp (FITB) |
|---|---|---|
| ROE | 11.62% | 11.61% |
| ROIC | 11.14% | 8.90% |
| P/E | 10.95 | 12.33 |
| P/B | 1.27 | 1.43 |
| Current Ratio | 2.73 | 0.82 |
| Quick Ratio | 2.73 | 0.82 |
| D/E (Debt-to-Equity) | 1.20 | 0.67 |
| Debt-to-Assets | 11.26% | 6.77% |
| Interest Coverage | 0.66 | 0.82 |
| Asset Turnover | 0.06 | 0.06 |
| Fixed Asset Turnover | 11.38 | 4.14 |
| Payout ratio | 41.46% | 39.76% |
| Dividend yield | 3.79% | 3.23% |
| Fiscal Year | 2025 | 2025 |
Efficiency & Valuation Duel: The Vital Signs
Financial ratios act as the company’s DNA, revealing hidden risks and operational excellence that underlie market valuations and shareholder returns.
U.S. Bancorp
U.S. Bancorp shows solid profitability with an 11.6% ROE and a robust 17.7% net margin. Its P/E of 10.95 and P/B of 1.27 indicate a reasonably valued stock. The company supports shareholders with a 3.79% dividend yield, reflecting a balanced approach to returns and reinvestment.
Fifth Third Bancorp
Fifth Third Bancorp delivers comparable ROE at 11.6% but edges higher with a 19.6% net margin. Its P/E stands at 12.33, suggesting a slightly stretched valuation versus U.S. Bancorp. Dividend yield of 3.23% signals steady income, while moderate reinvestment sustains growth potential.
Valuation Discipline vs. Margin Strength
U.S. Bancorp offers a more favorable valuation with strong dividends and efficient capital use. Fifth Third Bancorp boasts higher margins but trades at a premium, balancing risk and reward differently. Conservative investors may prefer U.S. Bancorp’s valuation discipline; those seeking margin strength might lean toward Fifth Third.
Which one offers the Superior Shareholder Reward?
I see U.S. Bancorp (USB) pays a higher dividend yield (~3.8–4.9%) with payout ratios around 41–61%. Its free cash flow coverage supports this robust dividend. USB also runs consistent buybacks, enhancing total return. Fifth Third Bancorp (FITB) offers slightly lower yields (~3.2–4.5%) and payout ratios near 32–51%. FITB’s buybacks are more modest, reflecting a cautious capital allocation. USB’s distribution model, backed by stronger buyback intensity and reliable cash flow, appears more sustainable. I conclude USB presents the superior total shareholder reward in 2026.
Comparative Score Analysis: The Strategic Profile
The radar chart reveals the fundamental DNA and trade-offs of U.S. Bancorp and Fifth Third Bancorp, showcasing their financial strengths and valuation nuances:
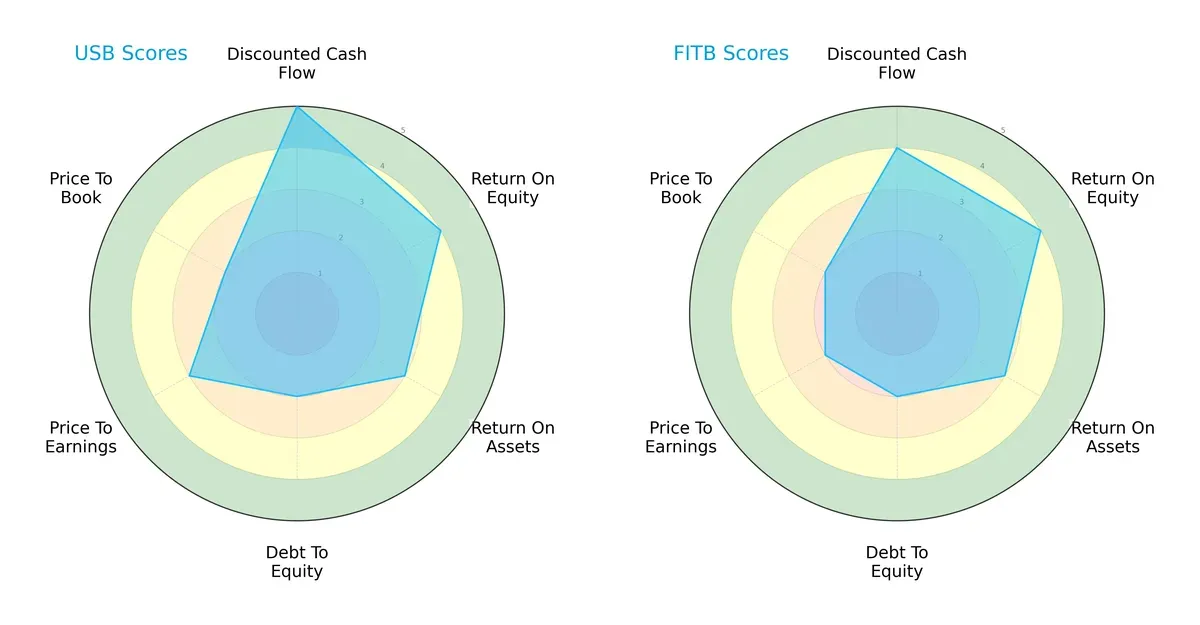
U.S. Bancorp leads with a very favorable DCF score (5 vs. 4), indicating stronger future cash flow expectations. Both share equal ROE (4) and ROA (3) scores, reflecting similar profitability and asset efficiency. Debt-to-equity scores are moderate and identical (2), signaling comparable leverage risk. Valuation scores favor U.S. Bancorp slightly on P/E (3 vs. 2), suggesting it is more reasonably priced relative to earnings. Overall, U.S. Bancorp exhibits a more balanced profile; Fifth Third Bancorp depends more on operational efficiency while trading at a heavier valuation discount.
Bankruptcy Risk: Solvency Showdown
The Altman Z-Scores place both firms firmly in the distress zone, implying elevated bankruptcy risk in this cycle:
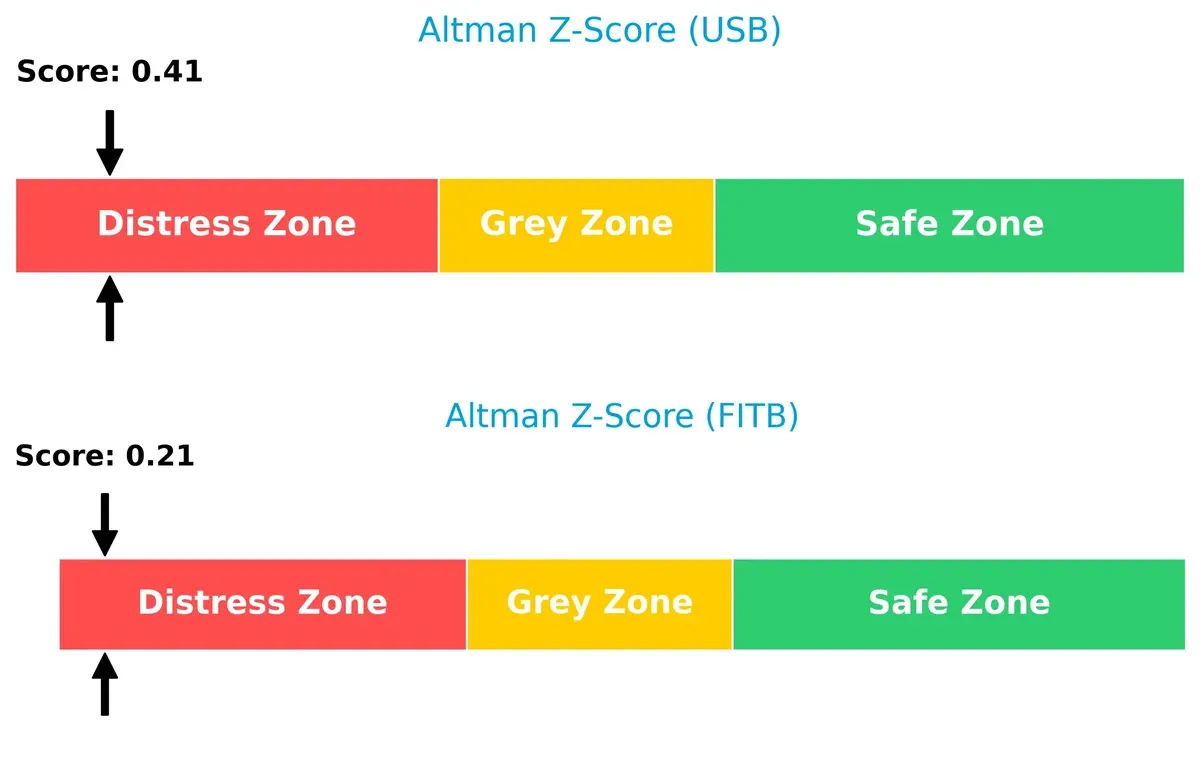
This signals that despite their moderate operational scores, both companies face significant solvency challenges. Investors must treat these risks with caution, as low Z-Scores historically precede financial distress in bank stocks during tightening cycles.
Financial Health: Quality of Operations
Fifth Third Bancorp outperforms U.S. Bancorp in Piotroski F-Score, showing superior financial health and fewer red flags:
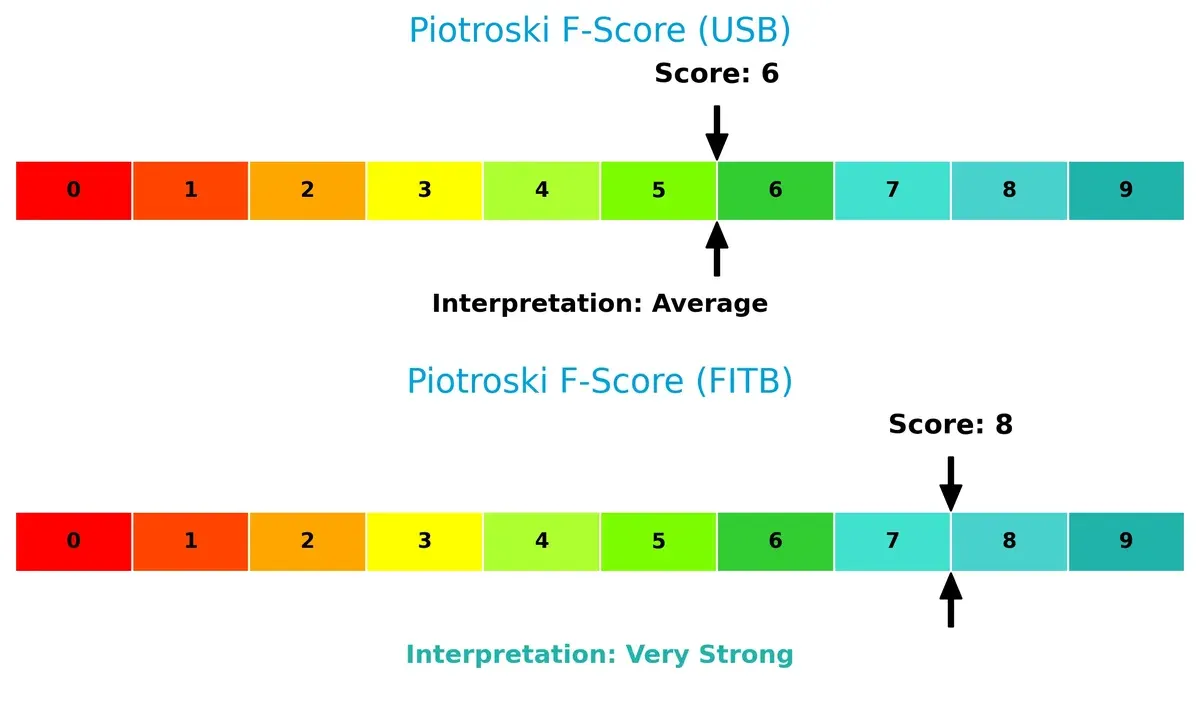
With a score of 8 against 6, Fifth Third demonstrates stronger internal metrics across profitability, leverage, and liquidity. U.S. Bancorp’s average score suggests some operational concerns, warranting closer scrutiny. This difference highlights Fifth Third’s more robust quality of earnings despite similar market ratings.
How are the two companies positioned?
This section dissects the operational DNA of U.S. Bancorp and Fifth Third Bancorp by comparing their revenue distribution and internal strengths and weaknesses. The goal is to confront their economic moats to identify which model offers the most resilient competitive advantage today.
Revenue Segmentation: The Strategic Mix
This visual comparison dissects how U.S. Bancorp and Fifth Third Bancorp diversify their income streams and where their primary sector bets lie:
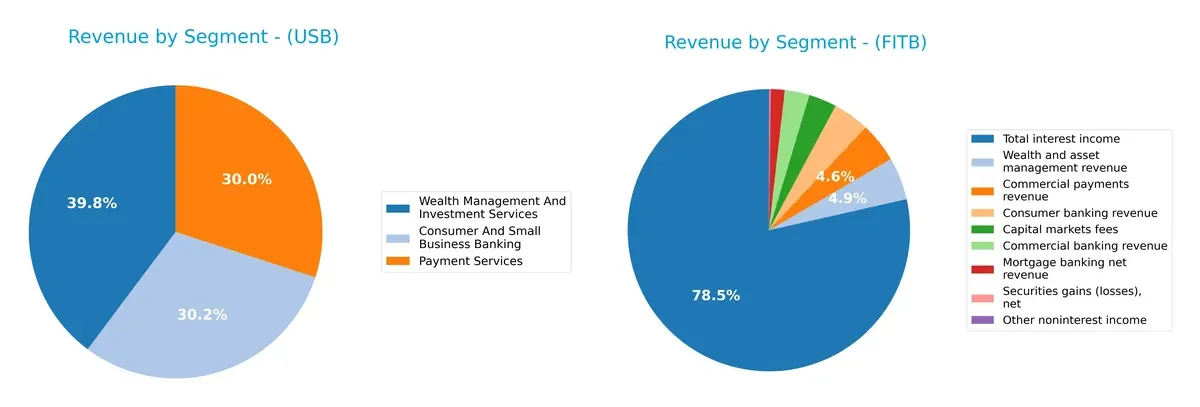
U.S. Bancorp anchors its revenue in Wealth Management ($12.2B) and Consumer Banking ($9.3B), showing a balanced, diversified model. Fifth Third Bancorp relies heavily on Total Interest Income ($10.4B), dwarfing all other segments under $650M. USB’s diversification reduces concentration risk and enhances ecosystem lock-in. In contrast, FITB’s reliance on interest income exposes it to interest rate cycles and limits its infrastructure dominance.
Strengths and Weaknesses Comparison
This table compares the Strengths and Weaknesses of U.S. Bancorp and Fifth Third Bancorp:
U.S. Bancorp Strengths
- Diversified revenue streams across banking, payment services, and wealth management
- Favorable net margin at 17.68%
- Strong current and quick ratios at 2.73
- Favorable price-to-earnings (10.95) and price-to-book (1.27) ratios
- Higher dividend yield at 3.79%
Fifth Third Bancorp Strengths
- Favorable net margin at 19.61%
- Favorable price-to-earnings (12.33) and price-to-book (1.43) ratios
- Lower debt-to-assets ratio at 6.77%
- Favorable fixed asset turnover at 4.14
- Slightly favorable overall financial ratios
U.S. Bancorp Weaknesses
- Unfavorable return on invested capital (11.14% vs. WACC 11.59%)
- High debt-to-equity ratio at 1.2
- Low interest coverage at 0.66
- Unfavorable asset turnover at 0.06
- Neutral return on equity at 11.62%
Fifth Third Bancorp Weaknesses
- Unfavorable weighted average cost of capital at 12.33%
- Current ratio below 1.0 at 0.82
- Unfavorable interest coverage at 0.82
- Unfavorable asset turnover at 0.06
- Neutral return on invested capital at 8.9%
U.S. Bancorp demonstrates stronger liquidity and dividend yield, supported by diversified revenue. Fifth Third shows better net margin but weaker liquidity and higher cost of capital. Both face challenges with asset efficiency and interest coverage that could affect capital allocation strategies.
The Moat Duel: Analyzing Competitive Defensibility
A structural moat is the single most crucial barrier protecting long-term profits from relentless competitive erosion:
U.S. Bancorp: Intangible Assets Fueling Margin Stability
U.S. Bancorp leverages strong brand recognition and diversified financial services to sustain high margins and growing ROIC. New digital offerings in 2026 could deepen this intangible moat.
Fifth Third Bancorp: Cost Advantage Driving Efficiency
Fifth Third Bancorp’s moat centers on cost leadership and regional scale, enabling superior EBIT margins versus peers. Its expanding footprint in underpenetrated markets supports future moat expansion.
Intangible Assets vs. Cost Advantage: The Competitive Moat Faceoff
U.S. Bancorp’s intangible asset moat offers deeper, more stable competitive protection than Fifth Third’s cost advantage. I see U.S. Bancorp better positioned to defend and grow market share in 2026.
Which stock offers better returns?
The past year reveals strong upward momentum for both stocks, with notable price gains and shifting trading volumes reflecting distinct investor sentiment.
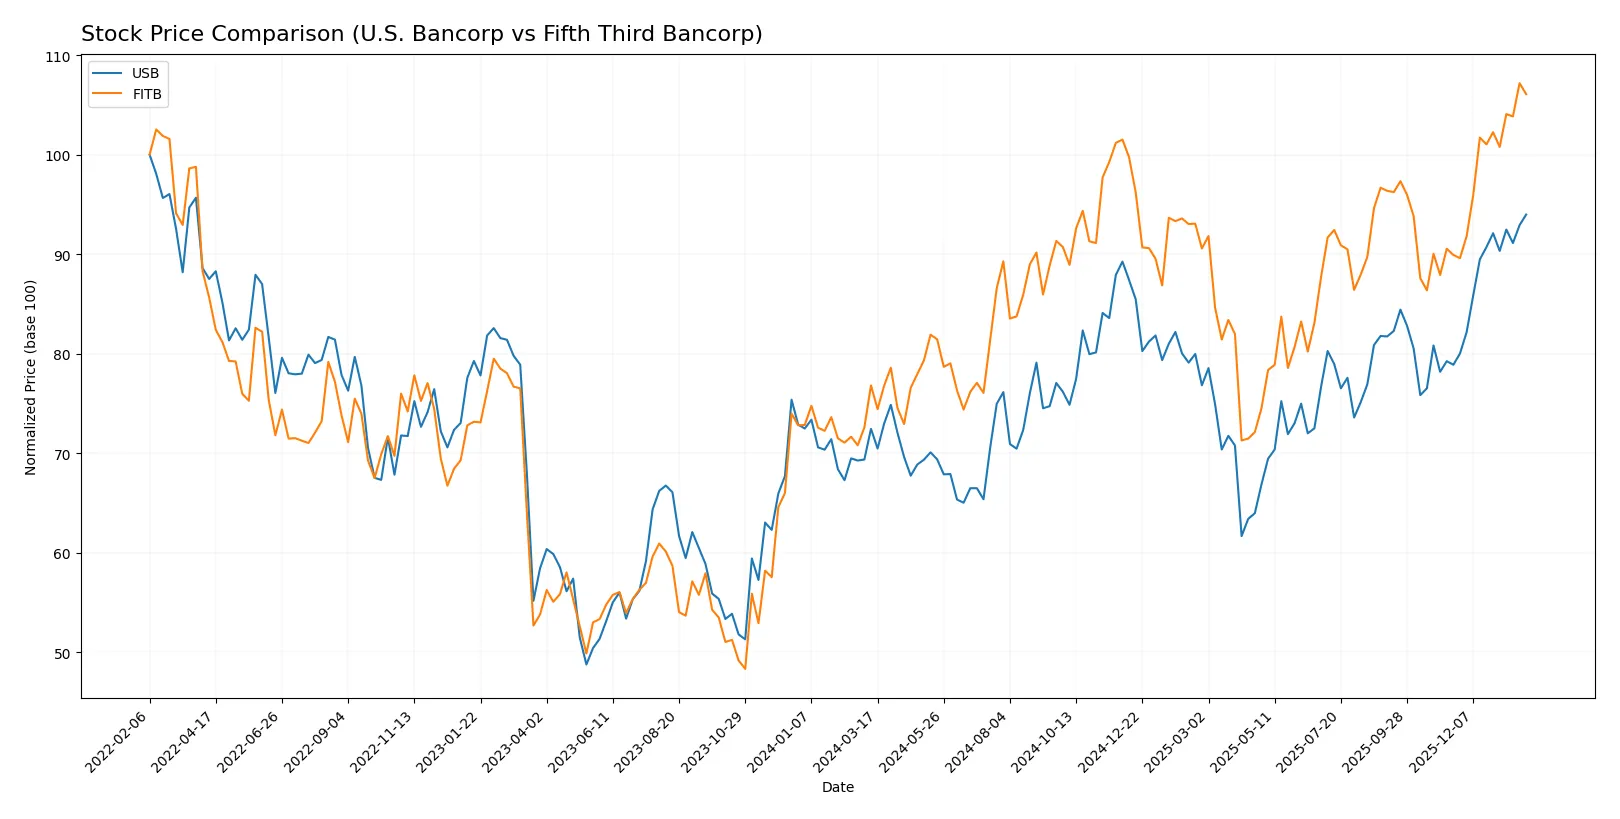
Trend Comparison
U.S. Bancorp’s stock rose 29.7% over the past year, showing a bullish trend with acceleration. Its price ranged between 36.83 and 56.11, with volatility at 4.33%.
Fifth Third Bancorp gained 38.08% in the same period, also bullish and accelerating. Its price moved from 33.75 to 50.74, with slightly lower volatility of 4.08%.
Fifth Third Bancorp outperformed U.S. Bancorp by nearly 8.4 percentage points, delivering the higher market return over the past year.
Target Prices
Analyst consensus suggests moderate upside potential for these regional banks.
| Company | Target Low | Target High | Consensus |
|---|---|---|---|
| U.S. Bancorp | 50 | 65 | 58.13 |
| Fifth Third Bancorp | 50 | 61 | 56.2 |
Both U.S. Bancorp and Fifth Third Bancorp trade near their consensus targets, indicating balanced risk-reward with room for modest gains.

Don’t Let Luck Decide Your Entry Point
Optimize your entry points with our advanced ProRealTime indicators. You’ll get efficient buy signals with precise price targets for maximum performance. Start outperforming now!
How do institutions grade them?
The following tables summarize recent grades assigned by reputable financial firms for both companies:
U.S. Bancorp Grades
This table shows current analyst ratings for U.S. Bancorp from several respected sources.
| Grading Company | Action | New Grade | Date |
|---|---|---|---|
| Argus Research | Maintain | Buy | 2026-01-22 |
| TD Cowen | Maintain | Buy | 2026-01-21 |
| Keefe, Bruyette & Woods | Maintain | Market Perform | 2026-01-21 |
| Oppenheimer | Maintain | Outperform | 2026-01-21 |
| DA Davidson | Maintain | Buy | 2026-01-21 |
| Truist Securities | Maintain | Hold | 2026-01-21 |
| RBC Capital | Maintain | Outperform | 2026-01-21 |
| TD Cowen | Maintain | Buy | 2026-01-07 |
| Wolfe Research | Downgrade | Peer Perform | 2026-01-07 |
| Barclays | Maintain | Overweight | 2026-01-05 |
Fifth Third Bancorp Grades
Below are the latest investment ratings for Fifth Third Bancorp by leading grading entities.
| Grading Company | Action | New Grade | Date |
|---|---|---|---|
| Truist Securities | Maintain | Buy | 2026-01-26 |
| DA Davidson | Maintain | Buy | 2026-01-26 |
| Citigroup | Maintain | Neutral | 2026-01-23 |
| Keefe, Bruyette & Woods | Maintain | Market Perform | 2026-01-21 |
| RBC Capital | Maintain | Outperform | 2026-01-21 |
| TD Cowen | Maintain | Buy | 2026-01-07 |
| Barclays | Maintain | Overweight | 2026-01-05 |
| Truist Securities | Maintain | Buy | 2025-12-22 |
| Keefe, Bruyette & Woods | Maintain | Market Perform | 2025-12-17 |
| Piper Sandler | Maintain | Overweight | 2025-12-10 |
Which company has the best grades?
U.S. Bancorp receives more consistent Buy and Outperform ratings, while Fifth Third Bancorp’s grades include several Market Perform and Neutral. Investors may view U.S. Bancorp’s stronger grades as signaling greater confidence from analysts.
Risks specific to each company
The following categories identify the critical pressure points and systemic threats facing both firms in the 2026 market environment:
1. Market & Competition
U.S. Bancorp
- Large market cap (87B) supports competitive positioning but faces pressure from fintech disruption.
Fifth Third Bancorp
- Smaller market cap (33B) limits scale but allows nimble responses to regional competition.
2. Capital Structure & Debt
U.S. Bancorp
- Higher debt-to-equity ratio (1.2) signals leverage risk; interest coverage below 1 warns of earnings strain.
Fifth Third Bancorp
- Moderate leverage (0.67 D/E) with slightly better interest coverage, but still below standard safety thresholds.
3. Stock Volatility
U.S. Bancorp
- Beta of 1.09 indicates average market volatility; stock price near 52-week high shows resilience.
Fifth Third Bancorp
- Lower beta at 0.99 suggests slightly less volatility; recent price near upper range signals investor confidence.
4. Regulatory & Legal
U.S. Bancorp
- Large national footprint exposes USB to complex regulatory scrutiny, increasing compliance costs.
Fifth Third Bancorp
- Regional focus reduces regulatory complexity but still vulnerable to evolving banking laws and state regulations.
5. Supply Chain & Operations
U.S. Bancorp
- Extensive ATM and branch network require significant operational maintenance; digital transition risk remains.
Fifth Third Bancorp
- Smaller branch network eases operational burden but may limit customer reach and revenue diversification.
6. ESG & Climate Transition
U.S. Bancorp
- Increasing pressure to align loan portfolios with climate goals; ESG reporting standards may raise costs.
Fifth Third Bancorp
- ESG initiatives advancing but limited scale may hinder rapid adaptation to climate-related financial risks.
7. Geopolitical Exposure
U.S. Bancorp
- Operates mainly in stable U.S. regions, minimizing geopolitical risks but sensitive to national policy shifts.
Fifth Third Bancorp
- Regional concentration in Midwest and South exposes FITB to localized economic and political risks.
Which company shows a better risk-adjusted profile?
Fifth Third Bancorp’s lower leverage and stronger Piotroski score suggest a more robust financial footing despite its smaller scale. However, both firms remain in Altman distress zones, signaling heightened bankruptcy risk. U.S. Bancorp’s higher debt and weaker interest coverage pose a more significant threat amid rising rates. The market rewards FITB’s operational efficiency and conservative capital structure, giving it a slight edge in risk-adjusted stability.
Final Verdict: Which stock to choose?
U.S. Bancorp’s superpower lies in its robust liquidity and dividend yield, signaling strong cash flow management. Its slightly unfavorable ROIC versus WACC is a point of vigilance, suggesting capital efficiency could improve. USB suits investors targeting steady income with moderate growth appetite.
Fifth Third Bancorp stands out with a strategic moat rooted in solid recurring revenues and a conservative debt profile. Compared to USB, FITB offers a slightly safer balance sheet and a stronger Piotroski score. It fits well in a GARP portfolio seeking balanced growth and financial resilience.
If you prioritize income and liquidity, U.S. Bancorp is the compelling choice due to its favorable dividend yield and cash flow strength. However, if you seek a blend of growth and stability, Fifth Third Bancorp offers better financial health and a more reassuring fundamental score. Both carry risks common to regional banks, warranting close monitoring.
Disclaimer: Investment carries a risk of loss of initial capital. The past performance is not a reliable indicator of future results. Be sure to understand risks before making an investment decision.
Go Further
I encourage you to read the complete analyses of U.S. Bancorp and Fifth Third Bancorp to enhance your investment decisions: