Home > Comparison > Financial Services > TFC vs FITB
The strategic rivalry between Truist Financial Corporation and Fifth Third Bancorp shapes the competitive landscape of regional banking. Truist operates a broad banking and insurance model focused on the Southeastern and Mid-Atlantic US, while Fifth Third emphasizes diversified financial services with a strong commercial banking presence in the Midwest. This analysis explores which business model delivers superior risk-adjusted returns amid evolving sector dynamics. Investors will gain clarity on the optimal choice for portfolio resilience and growth.
Table of contents
Companies Overview
Truist Financial Corporation and Fifth Third Bancorp shape regional banking with significant market footprints and diverse financial services.
Truist Financial Corporation: Southeastern Banking Powerhouse
Truist Financial Corporation dominates the Southeastern and Mid-Atlantic banking sector. Its core revenue engine blends consumer banking, wealth management, corporate lending, and insurance products. In 2021, Truist sharpened its strategic focus on integrating banking with insurance and investment services to deepen customer relationships and diversify income streams.
Fifth Third Bancorp: Midwest and Beyond Banking Specialist
Fifth Third Bancorp serves multiple states with a comprehensive financial services portfolio. It generates revenue primarily through commercial banking, branch banking, and consumer lending, supported by wealth and asset management. In 2021, the company emphasized expanding its branch network and enhancing cash management and lending solutions for businesses and individuals.
Strategic Collision: Similarities & Divergences
Both banks leverage diversified financial services to capture regional markets, but Truist integrates insurance and investment advisory more aggressively. Fifth Third prioritizes expanding physical presence and business lending. Their primary battleground lies in commercial and consumer lending where regional dominance is key. Truist’s broader service spectrum contrasts with Fifth Third’s focus on branch growth, defining distinct investment profiles.
Income Statement Comparison
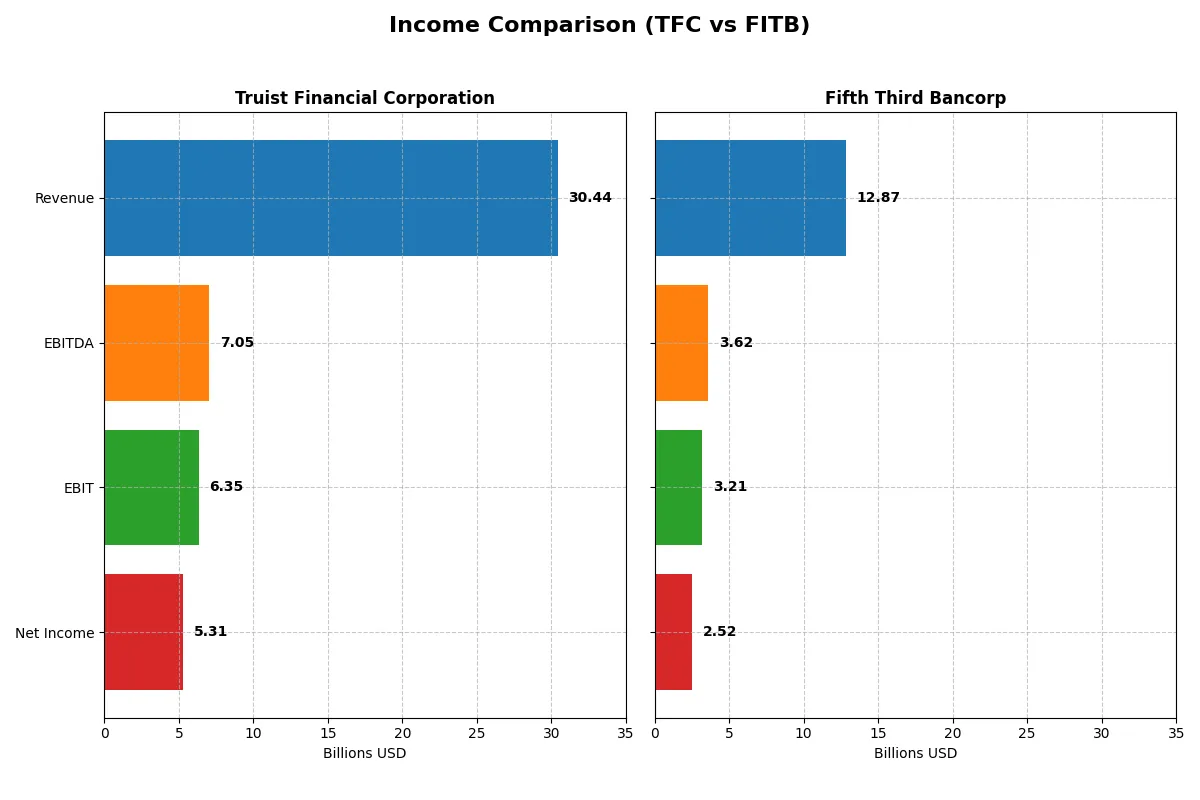
This data dissects the core profitability and scalability of both corporate engines to reveal who dominates the bottom line:
| Metric | Truist Financial Corporation (TFC) | Fifth Third Bancorp (FITB) |
|---|---|---|
| Revenue | 30.4B | 12.9B |
| Cost of Revenue | 11.5B | 4.5B |
| Operating Expenses | 12.6B | 5.2B |
| Gross Profit | 18.9B | 8.4B |
| EBITDA | 7.1B | 3.6B |
| EBIT | 6.3B | 3.2B |
| Interest Expense | 10.1B | 3.9B |
| Net Income | 5.3B | 2.5B |
| EPS | 3.86 | 3.55 |
| Fiscal Year | 2025 | 2025 |
Income Statement Analysis: The Bottom-Line Duel
This income statement comparison reveals the true efficiency and profitability dynamics behind each bank’s corporate engine.
Truist Financial Corporation Analysis
Truist’s revenue surged 25.5% in 2025 to $30.4B, driving gross profit up 66%. Its gross margin remains robust at 62.2%, while net income stands at $5.3B, reflecting a solid 17.4% net margin. Despite interest expenses weighing heavily at 33.2%, Truist’s EBIT margin of 20.9% signals strong operational leverage and improving momentum.
Fifth Third Bancorp Analysis
Fifth Third’s revenue declined slightly by 1.4% to $12.9B in 2025 but maintained a favorable gross margin of 65.3%. Net income reached $2.5B, lifting the net margin to 19.6%. EBIT margin improved to 25%, supported by disciplined cost management. Though revenue growth slowed, improving net margin and EPS growth reflect growing operational efficiency.
Margin Strength vs. Revenue Growth
Truist leads with impressive revenue growth and scale, delivering strong EBIT despite high interest costs. Fifth Third excels in margin efficiency and consistent profitability despite flat revenue. Truist’s profile suits those prioritizing growth at scale, while Fifth Third offers a steadier margin-focused approach for investors seeking operational discipline.
Financial Ratios Comparison
These vital ratios act as a diagnostic tool to expose underlying fiscal health, valuation premiums, and capital efficiency for Truist Financial Corporation and Fifth Third Bancorp:
| Ratios | Truist Financial Corporation (TFC) | Fifth Third Bancorp (FITB) |
|---|---|---|
| ROE | 8.14% | 11.61% |
| ROIC | 3.61% | 8.90% |
| P/E | 11.75 | 12.33 |
| P/B | 0.96 | 1.43 |
| Current Ratio | 0.87 | 0.82 |
| Quick Ratio | 0.87 | 0.82 |
| D/E | 1.07 | 0.67 |
| Debt-to-Assets | 12.75% | 6.77% |
| Interest Coverage | 0.63 | 0.82 |
| Asset Turnover | 0.056 | 0.060 |
| Fixed Asset Turnover | 9.60 | 4.14 |
| Payout ratio | 49.67% | 39.76% |
| Dividend yield | 4.23% | 3.23% |
| Fiscal Year | 2025 | 2025 |
Efficiency & Valuation Duel: The Vital Signs
Ratios serve as a company’s financial DNA, unveiling hidden risks and operational strengths through clear, quantifiable signals.
Truist Financial Corporation
Truist posts a solid net margin of 17.44% but shows weakness with an 8.14% ROE below its WACC at 9.11%, signaling return challenges. Its P/E of 11.75 and P/B near 1 suggest the stock is fairly valued. A 4.23% dividend yield rewards shareholders amid moderate leverage and operational constraints.
Fifth Third Bancorp
Fifth Third exhibits stronger profitability with a 19.61% net margin and an 11.61% ROE, outpacing its WACC though slightly higher at 12.33%. Valuation metrics show a fair P/E of 12.33 and a premium P/B of 1.43. The 3.23% dividend yield complements efficient capital deployment and lower debt levels.
Balanced Profitability vs. Valuation Discipline
Fifth Third offers a better blend of return and valuation metrics with higher ROE and controlled leverage. Truist’s dividend yield stands out but is weighed down by weaker returns and financial ratios. Investors seeking steady income might favor Truist, while those prioritizing operational efficiency may lean toward Fifth Third.
Which one offers the Superior Shareholder Reward?
I compare Truist Financial Corporation (TFC) and Fifth Third Bancorp (FITB) on their shareholder reward strategies. TFC yields 4.2% with a payout ratio near 50%, reflecting balanced dividend sustainability. FITB offers a lower 3.2% yield but maintains a lower payout ratio around 40%, preserving more cash for growth. Both execute buybacks: TFC’s capital allocation includes steady repurchases supporting total return, while FITB’s buybacks are more modest. I observe TFC’s higher yield combined with disciplined buybacks offers a more attractive and sustainable total return profile for 2026 investors.
Comparative Score Analysis: The Strategic Profile
The radar chart reveals the fundamental DNA and trade-offs of Truist Financial Corporation and Fifth Third Bancorp:
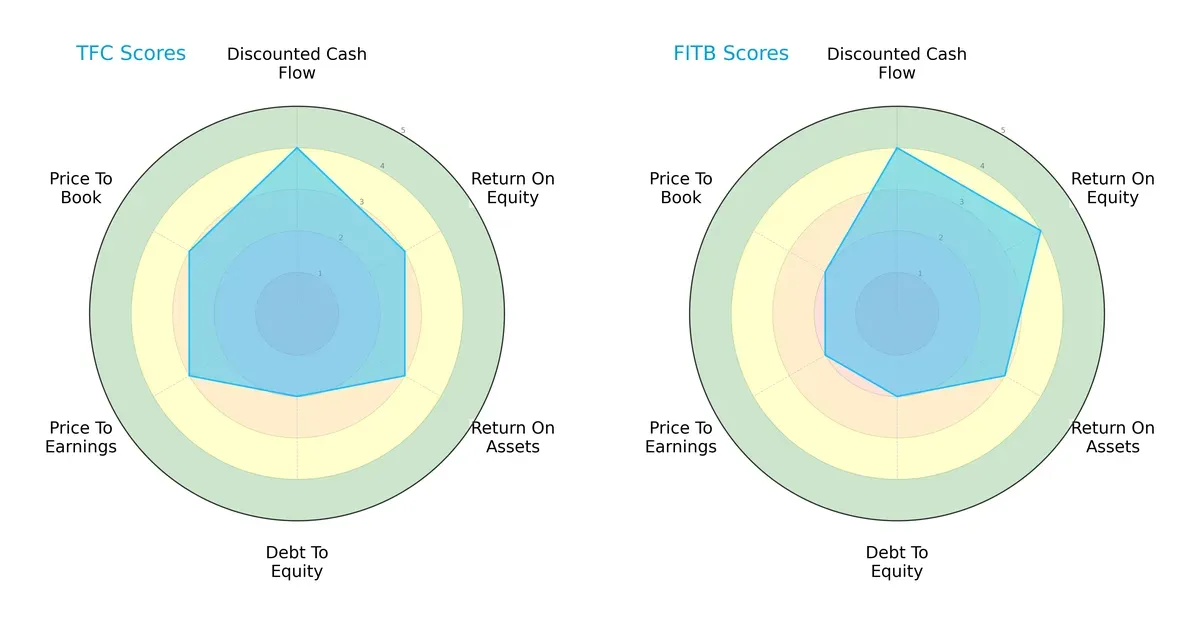
Both firms share a balanced DCF score of 4, signaling fair valuation expectations. Fifth Third leads with a stronger ROE (4 vs. 3) indicating superior equity efficiency. Truist holds a slight edge in valuation metrics (PE/PB scores of 3 vs. 2), suggesting better relative value. Both maintain moderate leverage (Debt/Equity score of 2). Truist’s profile is more evenly distributed, while Fifth Third leverages its ROE strength more distinctly.
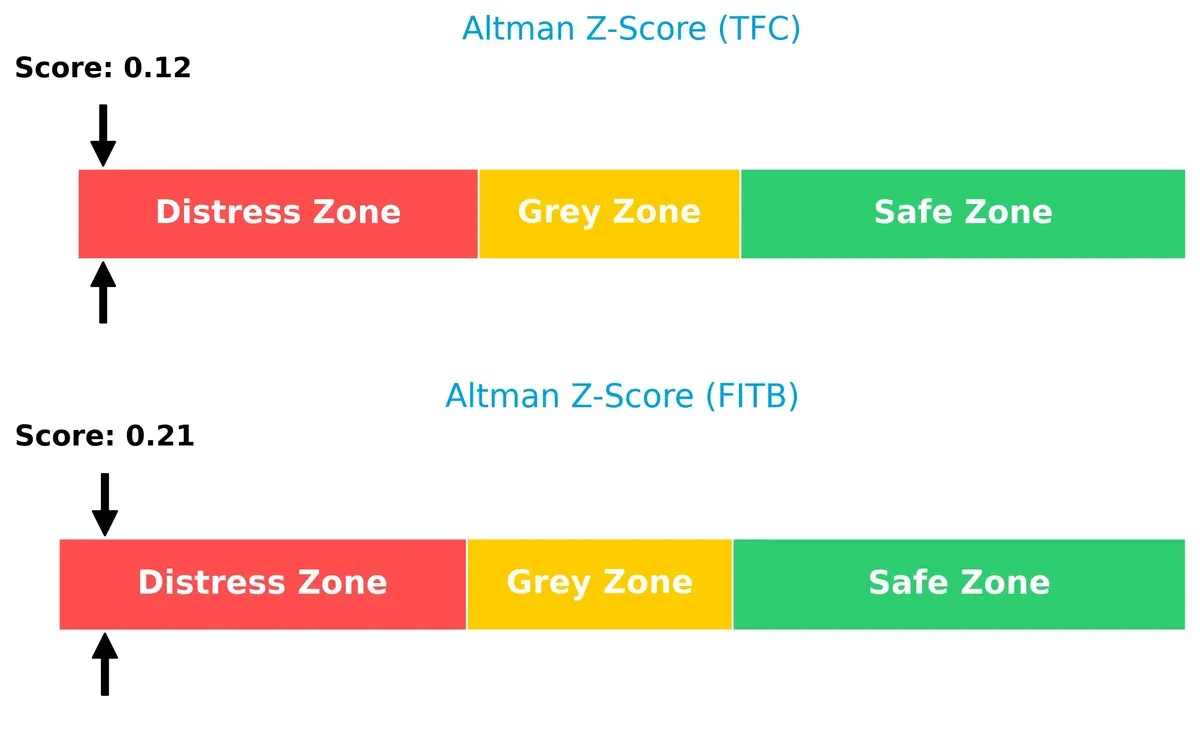
Bankruptcy Risk: Solvency Showdown
Both Truist and Fifth Third register Altman Z-Scores deep in the distress zone, highlighting significant bankruptcy risk in this economic cycle:
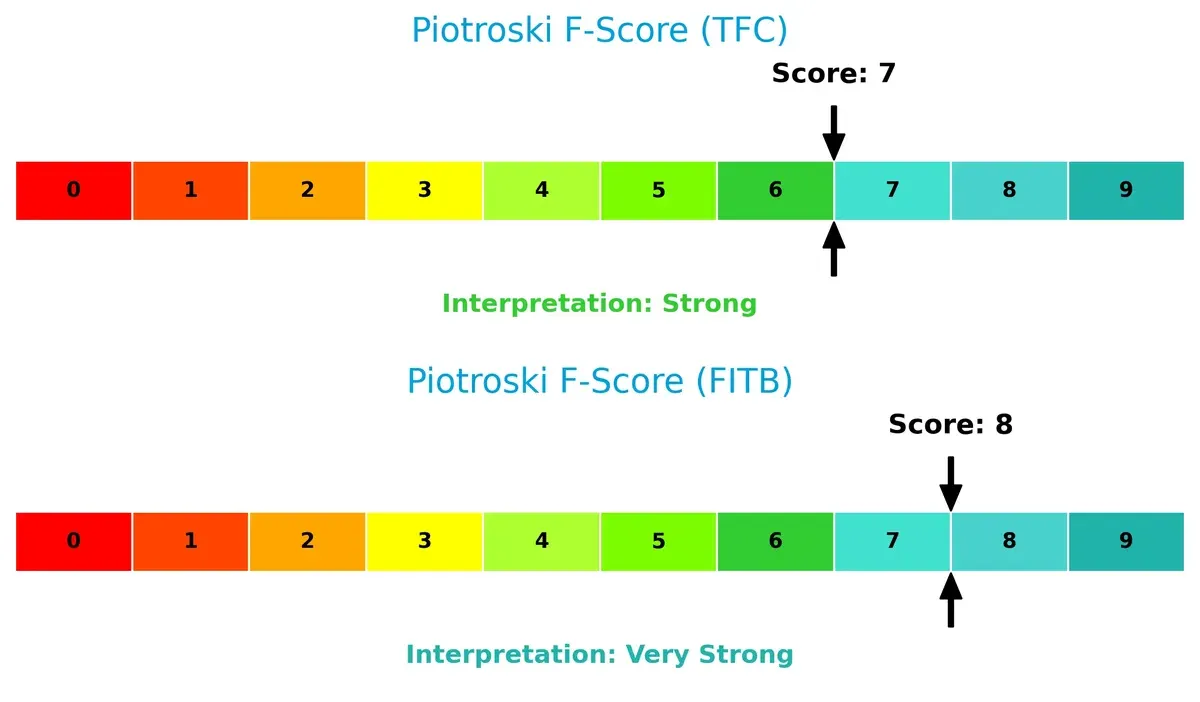
Financial Health: Quality of Operations
Fifth Third’s Piotroski F-Score of 8 signals very strong financial health, outperforming Truist’s strong 7 score. Truist’s metrics hint at minor red flags relative to Fifth Third’s superior operational quality:
How are the two companies positioned?
This section dissects the operational DNA of Truist Financial Corporation and Fifth Third Bancorp by comparing their revenue distribution by segment and internal dynamics. The final objective is to confront their economic moats to identify which business model offers the most resilient and sustainable competitive advantage in today’s market landscape.
Revenue Segmentation: The Strategic Mix
This visual comparison dissects how Truist Financial Corporation and Fifth Third Bancorp diversify their income streams and reveals their primary sector bets:
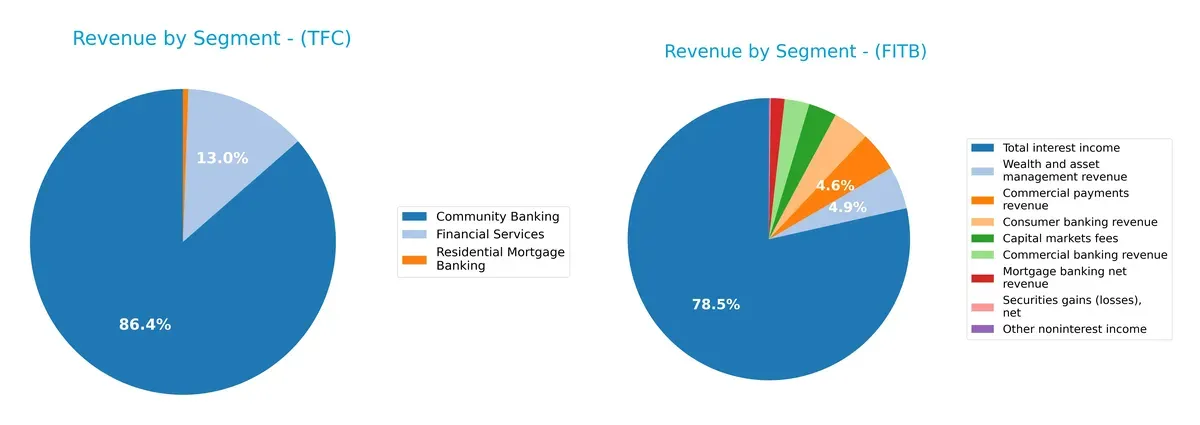
Fifth Third Bancorp boasts a broad revenue base with key contributions from wealth management ($647M), commercial payments ($608M), and commercial banking ($377M). Truist Financial hinges heavily on community banking ($153M in 2016), with smaller contributions from financial services ($23M). Truist’s heavy reliance on one segment increases concentration risk, while Fifth Third’s diversity supports resilience and cross-segment synergy. Truist’s negative “Other, Treasury & Corporate” also signals structural challenges.
Strengths and Weaknesses Comparison
This table compares the Strengths and Weaknesses of Truist Financial Corporation and Fifth Third Bancorp:
Truist Financial Corporation Strengths
- Favorable net margin at 17.44%
- Low debt-to-assets at 12.75%
- Strong fixed asset turnover of 9.6
- Attractive dividend yield of 4.23%
- Favorable P/E and P/B ratios
Fifth Third Bancorp Strengths
- Higher net margin at 19.61%
- Neutral ROE and ROIC indicating efficient capital use
- Favorable dividend yield of 3.23%
- Lower debt-to-assets at 6.77%
- Favorable P/E and P/B ratios
Truist Financial Corporation Weaknesses
- Unfavorable ROE at 8.14% below WACC
- Current ratio below 1 at 0.87
- High debt-to-equity at 1.07
- Low interest coverage at 0.63
- Low asset turnover at 0.06
Fifth Third Bancorp Weaknesses
- Unfavorable WACC at 12.33% above ROIC
- Current ratio below 1 at 0.82
- Interest coverage below 1 at 0.82
- Low asset turnover at 0.06
- Higher P/B ratio at 1.43 signals premium valuation
Overall, Truist demonstrates strengths in asset efficiency and dividend yield but faces challenges in profitability ratios and liquidity. Fifth Third shows stronger profitability and capital efficiency but contends with a higher cost of capital and liquidity constraints. These factors shape each company’s strategic focus on balancing growth and financial stability.
The Moat Duel: Analyzing Competitive Defensibility
Only a structural moat can shield a company’s long-term profits from relentless competitive pressure. Let’s dissect the moat dynamics between two regional banks:
Truist Financial Corporation: Legacy Scale with Margin Pressure
Truist relies on scale and diversified banking services as its moat. However, its ROIC trails WACC by -5.5%, signaling value destruction. Margin stability faces threats from rising interest expenses. In 2026, Truist’s moat risks erosion without innovation or cost control.
Fifth Third Bancorp: Improving Profitability Amid Value Challenges
Fifth Third’s moat centers on growing operational efficiency and regional banking penetration. Though ROIC also lags WACC by -3.4%, the firm shows a positive ROIC trend (+34%), suggesting improving capital use. Expansion in wealth management may deepen its moat in 2026.
Scale Dominance vs. Operational Momentum
Truist’s legacy scale is offset by declining capital returns, while Fifth Third’s improving ROIC hints at a strengthening moat. I see Fifth Third better positioned to defend and grow market share amid evolving banking competition.
Which stock offers better returns?
Over the past 12 months, both Truist Financial Corporation and Fifth Third Bancorp have shown strong bullish trends with accelerating price gains, highlighting robust trading dynamics and notable upward momentum.
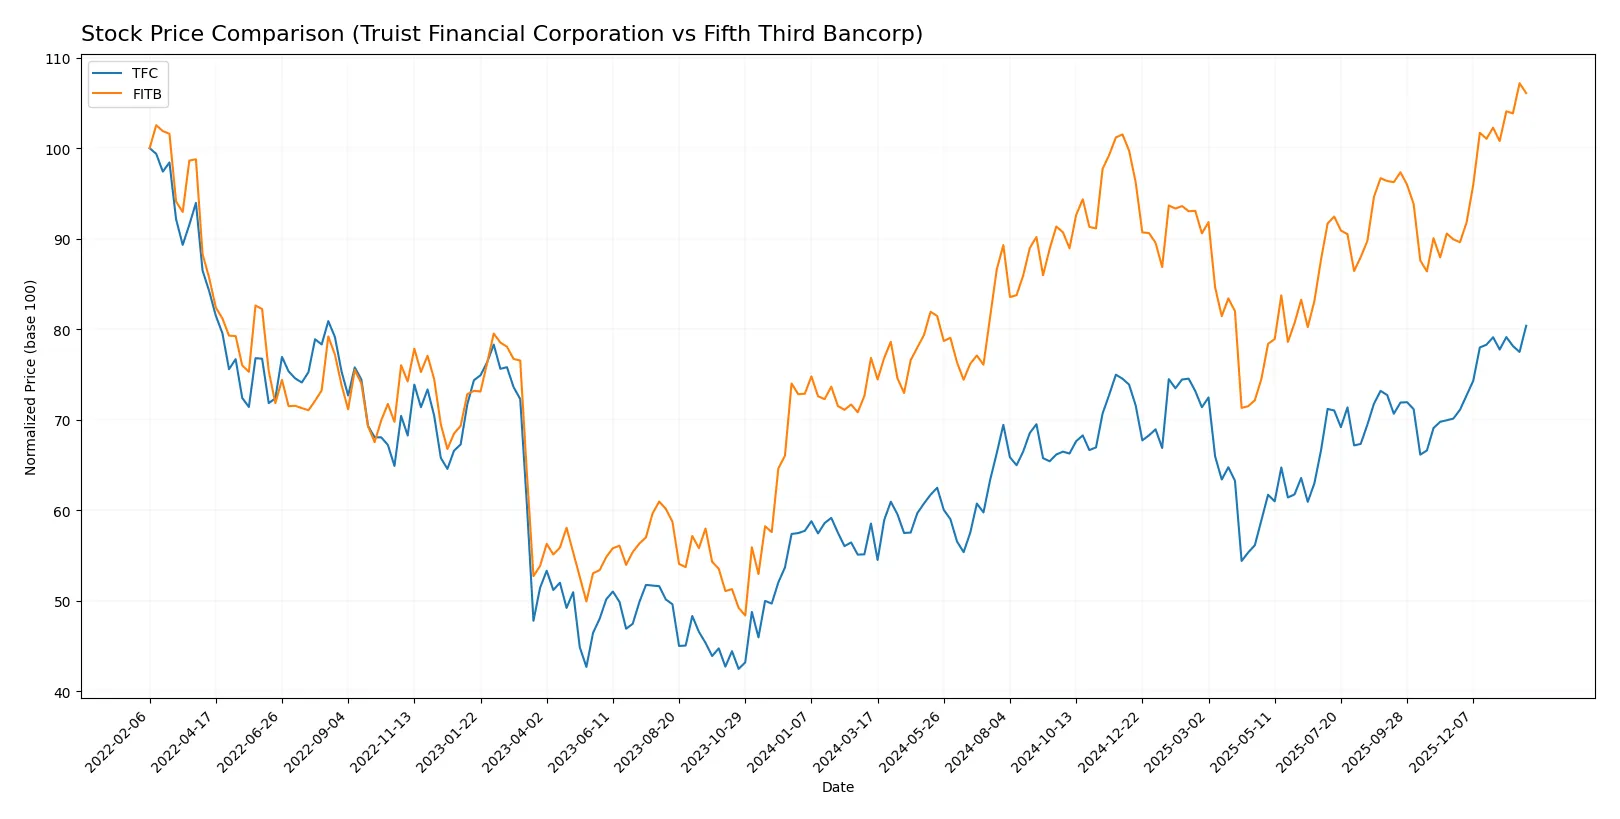
Trend Comparison
Truist Financial’s stock rose 37.34% over the past year, reflecting a bullish trend with accelerating momentum and a standard deviation of 4.03. Its price ranged from 34.79 to 51.42, showing strong upward movement.
Fifth Third Bancorp’s stock increased 38.08% in the same period, also bullish and accelerating. The price fluctuated between 33.75 and 50.74, with slightly higher volatility (std dev 4.08) than Truist.
Comparing both, Fifth Third delivered a marginally higher market performance, outperforming Truist by 0.74% over the past year.
Target Prices
Analysts present a cautiously optimistic target consensus for these regional banks.
| Company | Target Low | Target High | Consensus |
|---|---|---|---|
| Truist Financial Corporation | 50 | 58 | 54.38 |
| Fifth Third Bancorp | 50 | 61 | 56.2 |
The consensus targets for Truist and Fifth Third exceed current prices, signaling moderate upside potential. Analysts expect modest growth relative to recent trading levels.

Don’t Let Luck Decide Your Entry Point
Optimize your entry points with our advanced ProRealTime indicators. You’ll get efficient buy signals with precise price targets for maximum performance. Start outperforming now!
How do institutions grade them?
The following tables summarize recent institutional grades for Truist Financial Corporation and Fifth Third Bancorp:
Truist Financial Corporation Grades
The most recent grades from leading firms for Truist Financial Corporation are listed here.
| Grading Company | Action | New Grade | Date |
|---|---|---|---|
| Argus Research | Maintain | Buy | 2026-01-23 |
| Piper Sandler | Maintain | Neutral | 2026-01-22 |
| TD Cowen | Maintain | Buy | 2026-01-22 |
| TD Cowen | Maintain | Buy | 2026-01-07 |
| Raymond James | Maintain | Outperform | 2026-01-07 |
| Evercore ISI Group | Upgrade | Outperform | 2026-01-06 |
| Barclays | Downgrade | Underweight | 2026-01-05 |
| Citigroup | Maintain | Buy | 2025-12-31 |
| Keefe, Bruyette & Woods | Maintain | Market Perform | 2025-12-17 |
| Morgan Stanley | Maintain | Equal Weight | 2025-12-17 |
Fifth Third Bancorp Grades
Recent institutional grades for Fifth Third Bancorp from various analysts are presented below.
| Grading Company | Action | New Grade | Date |
|---|---|---|---|
| Truist Securities | Maintain | Buy | 2026-01-26 |
| DA Davidson | Maintain | Buy | 2026-01-26 |
| Citigroup | Maintain | Neutral | 2026-01-23 |
| Keefe, Bruyette & Woods | Maintain | Market Perform | 2026-01-21 |
| RBC Capital | Maintain | Outperform | 2026-01-21 |
| TD Cowen | Maintain | Buy | 2026-01-07 |
| Barclays | Maintain | Overweight | 2026-01-05 |
| Truist Securities | Maintain | Buy | 2025-12-22 |
| Keefe, Bruyette & Woods | Maintain | Market Perform | 2025-12-17 |
| Piper Sandler | Maintain | Overweight | 2025-12-10 |
Which company has the best grades?
Fifth Third Bancorp generally receives more Buy and Outperform ratings than Truist. Truist has some downgrades to Underweight and more Neutral or Market Perform grades. This divergence may affect investor confidence and perceived growth prospects.
Risks specific to each company
The following categories identify the critical pressure points and systemic threats facing both firms in the 2026 market environment:
1. Market & Competition
Truist Financial Corporation
- Faces intense regional banking competition with a large branch network but slower asset turnover
Fifth Third Bancorp
- Competes aggressively in similar markets with fewer branches but slightly better asset utilization
2. Capital Structure & Debt
Truist Financial Corporation
- Higher debt-to-equity ratio (1.07), signaling elevated leverage risk
Fifth Third Bancorp
- Lower debt-to-equity ratio (0.67), implying more conservative capital structure
3. Stock Volatility
Truist Financial Corporation
- Beta 0.874 indicates less volatility than the market
Fifth Third Bancorp
- Beta 0.988 shows near-market volatility, slightly higher risk
4. Regulatory & Legal
Truist Financial Corporation
- Subject to stringent regional banking regulations with complex insurance operations
Fifth Third Bancorp
- Faces regulatory scrutiny typical for diversified regional banks with commercial and consumer lending
5. Supply Chain & Operations
Truist Financial Corporation
- Extensive physical branch and service network may strain operational efficiency
Fifth Third Bancorp
- More streamlined branch network but reliant on third-party lending channels
6. ESG & Climate Transition
Truist Financial Corporation
- Moderate ESG risks due to large operational footprint and insurance exposures
Fifth Third Bancorp
- ESG risks mitigated somewhat by smaller employee base and focused commercial lending
7. Geopolitical Exposure
Truist Financial Corporation
- Primarily domestic US exposure, limiting geopolitical risk
Fifth Third Bancorp
- Similar US-centric operations with limited global exposure
Which company shows a better risk-adjusted profile?
Fifth Third Bancorp’s lower leverage and stronger profitability mitigate its risks better than Truist’s higher debt and operational inefficiencies. Both banks are in the distress zone by Altman Z-score, but FITB’s very strong Piotroski score signals better financial health. The most impactful risk for Truist is its high leverage and weak interest coverage, raising default concerns. For Fifth Third, the higher weighted average cost of capital relative to ROIC suggests pressure on capital returns. FITB’s lower debt-to-equity ratio and slightly better operational metrics justify my preference for its risk-adjusted profile.
Final Verdict: Which stock to choose?
Truist Financial Corporation (TFC) demonstrates a powerful operational efficiency and appealing dividend yield, making it a strong candidate for portfolios seeking income with growth potential. However, its declining ROIC and weak liquidity ratios signal caution. TFC suits investors with an appetite for aggressive growth but tolerance for volatility.
Fifth Third Bancorp (FITB) commands a strategic moat through improving profitability and a more robust return on invested capital trend. Its moderate leverage and stronger balance sheet offer relatively better safety than TFC. FITB aligns well with Growth at a Reasonable Price (GARP) investors who prioritize stability alongside growth.
If you prioritize aggressive income growth and can weather operational risks, TFC is the compelling choice due to its cash-generating ability and dividend yield. However, if you seek a more stable investment with improving profitability and a solid financial foundation, FITB offers better stability and a strengthening moat, though at a moderate premium.
Disclaimer: Investment carries a risk of loss of initial capital. The past performance is not a reliable indicator of future results. Be sure to understand risks before making an investment decision.
Go Further
I encourage you to read the complete analyses of Truist Financial Corporation and Fifth Third Bancorp to enhance your investment decisions: