Home > Comparison > Financial Services > PNC vs FITB
The strategic rivalry between The PNC Financial Services Group, Inc. and Fifth Third Bancorp shapes regional banking dynamics in the US financial services sector. PNC operates as a diversified financial powerhouse with a broad retail and institutional footprint. Fifth Third Bancorp focuses on commercial and consumer lending with a strong regional branch network. This analysis will determine which business model offers superior risk-adjusted returns for diversified portfolios amid evolving market conditions.
Table of contents
Companies Overview
The PNC Financial Services Group and Fifth Third Bancorp are key regional banks shaping U.S. financial services.
The PNC Financial Services Group, Inc.: Diversified Financial Powerhouse
PNC dominates as a diversified financial services provider with a broad footprint of 2,591 branches and 9,502 ATMs. It generates revenue from retail banking, corporate banking, and asset management. In 2026, PNC’s strategic focus remains on scaling its corporate and institutional banking while enhancing digital channels to serve mid-sized and large clients efficiently.
Fifth Third Bancorp: Regional Banking Specialist
Fifth Third Bancorp operates as a regional banking specialist with 1,117 full-service centers and 2,322 ATMs across multiple states. It drives revenue through commercial banking, consumer lending, and wealth management services. Its 2026 strategy prioritizes expanding commercial lending and wealth management while leveraging technology to improve customer experience and operational efficiency.
Strategic Collision: Similarities & Divergences
Both banks emphasize diversification across retail and commercial segments, yet PNC leans more on large corporate clients while Fifth Third targets regional consumer and business customers. They compete fiercely in commercial lending and wealth management. PNC’s scale and institutional focus contrast with Fifth Third’s regional depth, creating distinct risk and growth profiles for investors.
Income Statement Comparison
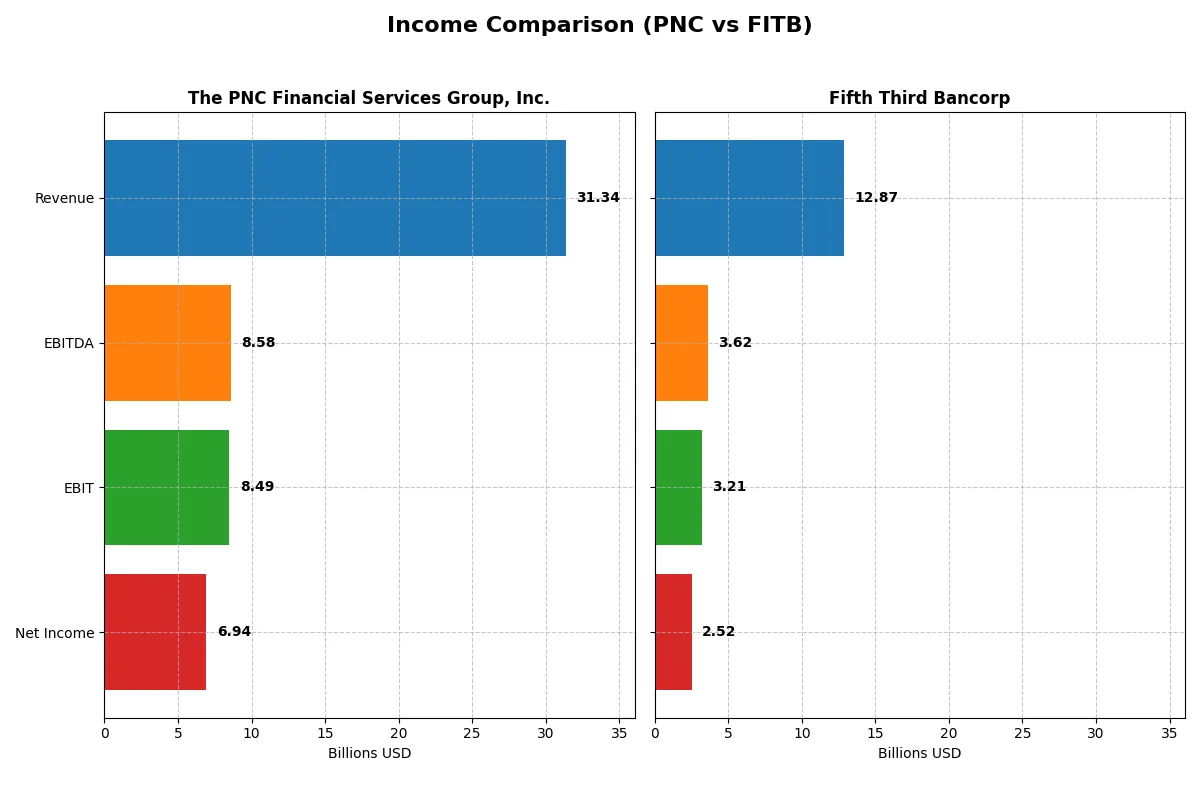
This data dissects the core profitability and scalability of both corporate engines to reveal who dominates the bottom line:
| Metric | The PNC Financial Services Group, Inc. (PNC) | Fifth Third Bancorp (FITB) |
|---|---|---|
| Revenue | 31.3B | 12.9B |
| Cost of Revenue | 8.9B | 4.5B |
| Operating Expenses | 13.97B | 5.19B |
| Gross Profit | 22.5B | 8.4B |
| EBITDA | 8.58B | 3.62B |
| EBIT | 8.49B | 3.21B |
| Interest Expense | 10.9B | 3.92B |
| Net Income | 6.94B | 2.52B |
| EPS | 16.62 | 3.55 |
| Fiscal Year | 2025 | 2025 |
Income Statement Analysis: The Bottom-Line Duel
This income statement comparison reveals which company operates with greater efficiency and delivers stronger profitability over time.
The PNC Financial Services Group, Inc. Analysis
PNC’s revenue rose from 20B in 2021 to 31.3B in 2025, showing solid growth despite a slight dip in 2025. Net income steadily increased to 6.9B, with a robust net margin of 22.13% in 2025, highlighting excellent cost control and margin expansion. EBIT margin improved to 27.08%, signaling operational efficiency gains and strong momentum.
Fifth Third Bancorp Analysis
Fifth Third’s revenue climbed from 7.9B in 2021 to 12.9B in 2025 but showed a slight decline last year. Net income peaked at 2.7B in 2021 but fell to 2.5B in 2025, with a net margin near 19.61%. EBIT margin at 24.95% reflects decent efficiency, yet net income growth over five years was negative, indicating margin pressures and weaker profitability momentum.
Margin Strength vs. Profit Growth
PNC outperforms Fifth Third by delivering higher margins and consistent net income growth. While both companies expanded revenue, PNC’s superior EBIT and net margins reveal stronger operational efficiency. For investors prioritizing sustained profit growth and margin expansion, PNC presents a more compelling profile.
Financial Ratios Comparison
These vital ratios act as a diagnostic tool to expose the underlying fiscal health, valuation premiums, and capital efficiency of the companies compared below:
| Ratios | The PNC Financial Services Group, Inc. (PNC) | Fifth Third Bancorp (FITB) |
|---|---|---|
| ROE | 11.45% | 11.61% |
| ROIC | 7.65% | 8.90% |
| P/E | 11.86 | 12.33 |
| P/B | 1.36 | 1.43 |
| Current Ratio | 0.81 | 0.82 |
| Quick Ratio | 0.81 | 0.82 |
| D/E | 0.94 | 0.67 |
| Debt-to-Assets | 9.96% | 6.77% |
| Interest Coverage | 0.78 | 0.82 |
| Asset Turnover | 0.05 | 0.06 |
| Fixed Asset Turnover | 0 | 4.14 |
| Payout Ratio | 37.49% | 39.76% |
| Dividend Yield | 3.16% | 3.23% |
| Fiscal Year | 2025 | 2025 |
Efficiency & Valuation Duel: The Vital Signs
Ratios serve as a company’s DNA, uncovering hidden risks and revealing operational excellence beneath headline numbers.
The PNC Financial Services Group, Inc.
PNC posts a solid 11.45% ROE and a strong 22.13% net margin, signaling reliable profitability. Its P/E of 11.86 and P/B of 1.36 suggest a fairly valued stock. The 3.16% dividend yield rewards shareholders while balancing reinvestment, though a low current ratio of 0.81 flags liquidity concerns.
Fifth Third Bancorp
Fifth Third delivers a comparable 11.61% ROE with a slightly lower 19.61% net margin. Its P/E stands at 12.33, reflecting a modest premium, paired with a P/B of 1.43. A 3.23% dividend yield supports income investors. The current ratio at 0.82 also signals tight liquidity, but a favorable fixed asset turnover of 4.14 boosts operational efficiency.
Valuation and Efficiency: Balanced Trade-offs
Fifth Third shows a slightly more favorable ratio profile with better operational efficiency and dividend yield. PNC offers steadier profitability and valuation metrics but faces liquidity risks. Investors prioritizing income and operational strength may lean toward Fifth Third, while those valuing consistent profitability might prefer PNC’s profile.
Which one offers the Superior Shareholder Reward?
I see PNC offers a higher dividend yield at 3.16% in 2025 compared to Fifth Third Bancorp’s 3.23%. PNC’s payout ratio hovers around 37-51%, showing moderate distribution from earnings. FITB maintains a similar payout ratio near 40-50%, balancing dividends with growth investments. Both companies run buyback programs, but PNC’s larger scale and consistent free cash flow coverage make its buybacks more sustainable. FITB’s capital allocation leans slightly more towards reinvestment, seen in its modest free cash flow per share. I conclude PNC provides a superior total shareholder return profile in 2026 due to its blend of solid dividends and disciplined buybacks, supporting long-term value better than FITB.
Comparative Score Analysis: The Strategic Profile
The radar chart reveals the fundamental DNA and trade-offs of both firms, highlighting their core financial strengths and valuation nuances:
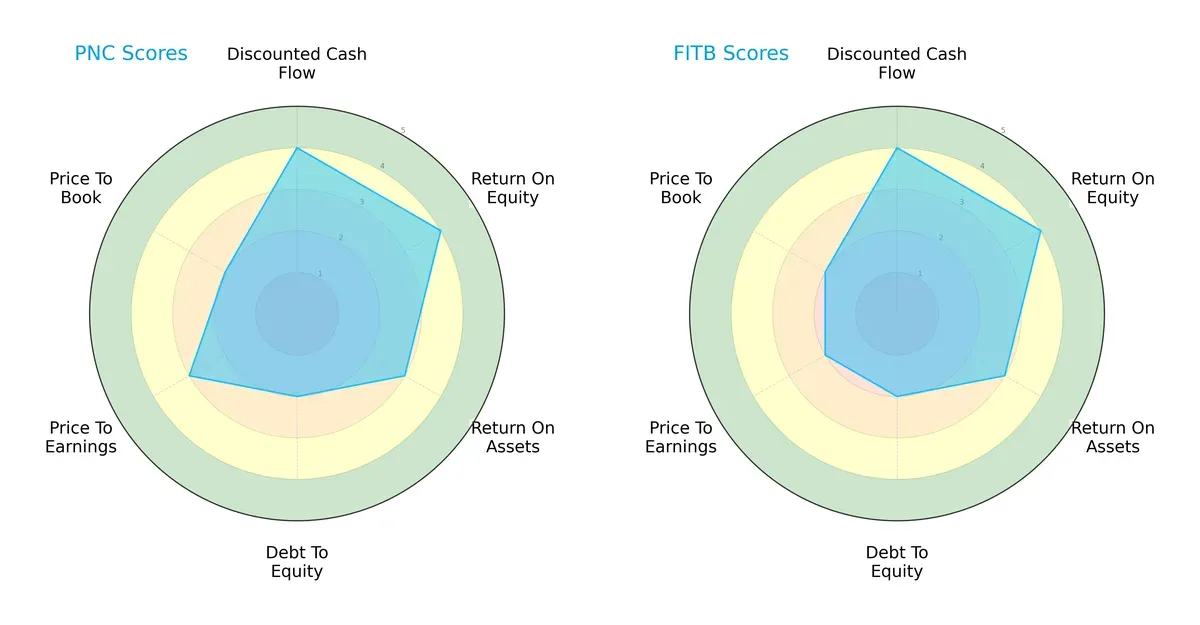
Both The PNC Financial Services Group, Inc. (PNC) and Fifth Third Bancorp (FITB) share similar profiles with strong DCF and ROE scores at 4 each. Both score moderately on ROA and debt-to-equity at 3 and 2, respectively. PNC holds a slight edge in price-to-earnings valuation (3 vs. 2), indicating a fairer market pricing. Overall, PNC presents a slightly more balanced profile, while FITB relies more on operational efficiency but faces marginally higher valuation risk.
Bankruptcy Risk: Solvency Showdown
The Altman Z-Scores for both companies fall deep in the distress zone, signaling elevated bankruptcy risk amid the current cycle:
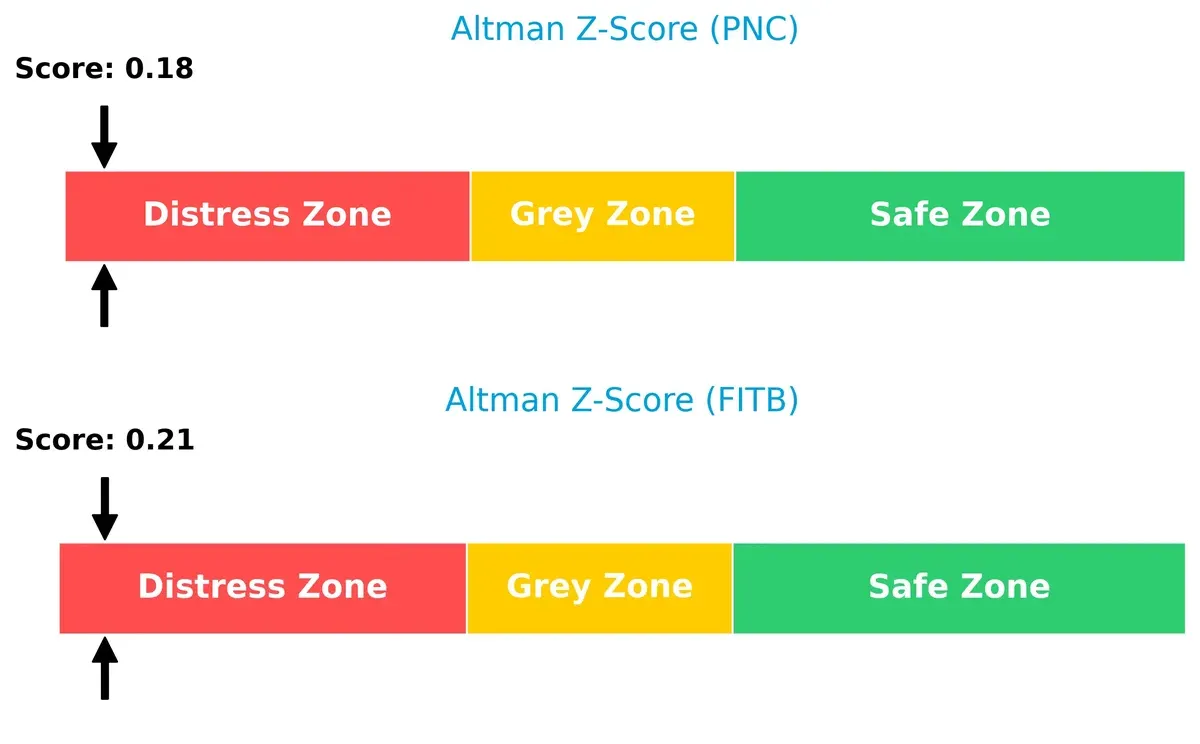
PNC posts a 0.18 score, closely matched by FITB’s 0.21, both far below the safe threshold of 3. This indicates significant financial strain and vulnerability, underscoring the need for cautious risk management when considering these banking stocks.
Financial Health: Quality of Operations
Piotroski F-Scores show both banks maintain solid internal financial health, with FITB slightly outperforming PNC:
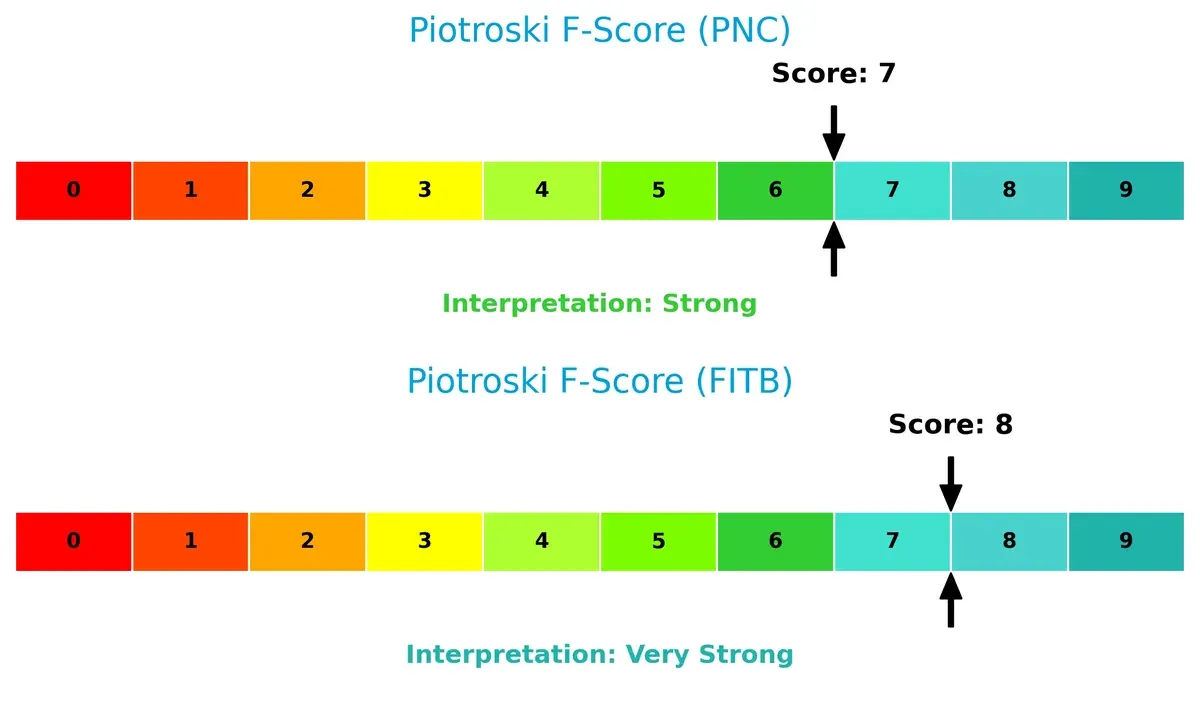
PNC scores a strong 7, reflecting sound profitability and operational efficiency. FITB’s very strong score of 8 suggests superior financial strength and fewer red flags. These metrics imply FITB manages its balance sheet and earnings quality better in this challenging sector environment.
How are the two companies positioned?
This section dissects the operational DNA of PNC and Fifth Third Bancorp by comparing their revenue distribution and internal dynamics. The goal is to confront their economic moats and identify which model offers the most resilient competitive advantage today.
Revenue Segmentation: The Strategic Mix
This visual comparison dissects how The PNC Financial Services Group and Fifth Third Bancorp diversify income streams and reveals their primary sector bets:
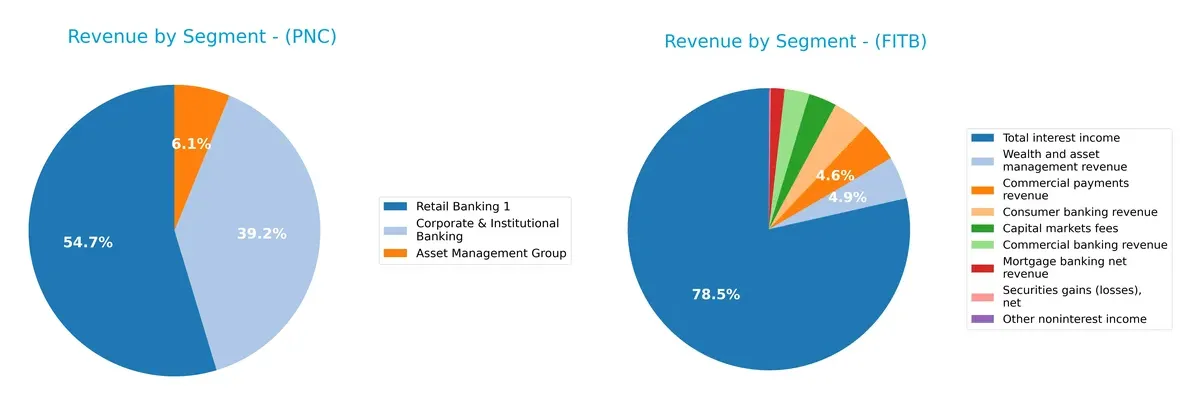
PNC anchors its revenue in Retail Banking at $12.9B, with strong Corporate & Institutional Banking at $9.3B and a smaller Asset Management Group at $1.45B. This mix shows a focused but balanced approach between consumer and corporate clients. Fifth Third Bancorp pivots on Total Interest Income of $10.4B, with more evenly spread smaller segments like Commercial Banking ($377M) and Wealth Management ($647M). PNC’s concentration in retail risks consumer market shifts, while Fifth Third’s diverse smaller streams reduce single-segment dependency.
Strengths and Weaknesses Comparison
This table compares the Strengths and Weaknesses of The PNC Financial Services Group, Inc. (PNC) and Fifth Third Bancorp (FITB):
PNC Strengths
- Diversified revenue across asset management, corporate banking, and retail banking
- Favorable net margin at 22.13%
- Favorable price-to-earnings and price-to-book ratios
- Low debt-to-assets ratio at 9.96%
- Dividend yield of 3.16% supports shareholder returns
FITB Strengths
- Favorable net margin at 19.61%
- Slightly higher ROIC at 8.9% vs PNC
- Favorable fixed asset turnover at 4.14 indicating operational efficiency
- Favorable price-to-earnings and price-to-book ratios
- Lower debt-to-assets at 6.77%
- Dividend yield slightly higher at 3.23%
PNC Weaknesses
- Current ratio at 0.81 signals potential liquidity risk
- Interest coverage below 1 at 0.78 indicates strain on debt servicing
- Asset turnover very low at 0.05, fixed asset turnover at zero suggests inefficiency
- WACC exceeds ROIC, impacting value creation
- Neutral ROE at 11.45%
FITB Weaknesses
- Current ratio at 0.82 also indicates liquidity concerns
- Interest coverage below 1 at 0.82 limits debt resilience
- WACC at 12.33% exceeds ROIC, limiting returns above cost of capital
- Asset turnover low at 0.06, though better than PNC
Both companies show solid profitability metrics and attractive valuation multiples. However, liquidity ratios and interest coverage figures point to potential financial stress. Operational efficiency differs, with FITB showing better fixed asset utilization. Their capital costs exceed returns, raising questions on value creation strategies.
The Moat Duel: Analyzing Competitive Defensibility
A structural moat alone shields long-term profits from relentless competitive pressure and market share erosion. Let’s dissect the core advantages of two regional banks in 2026:
The PNC Financial Services Group, Inc.: Growing Profitability Despite Value Erosion
PNC’s moat stems from intangible assets and service diversification, reflected in stable margins (22% net margin) and rising profitability. However, ROIC trails WACC by 3.6%, signaling value destruction despite a 16% ROIC growth trend. New markets and tech integration could deepen its moat but require cautious capital allocation.
Fifth Third Bancorp: Accelerating Efficiency Amid Value Challenges
Fifth Third’s competitive edge lies in cost advantages and operational efficiency, showcasing a solid 19.6% net margin and a faster 34% ROIC growth. Like PNC, it destroys value with ROIC below WACC by 3.4%, yet its sharper ROIC improvement suggests better capital use. Expansion into digital banking offers growth, but margin pressures persist.
ROIC Growth vs. Value Creation: Which Bank Defends Better?
Both banks struggle to surpass their cost of capital, shedding value despite growing ROIC. Fifth Third’s steeper ROIC improvement indicates a deeper, more dynamic moat. I see Fifth Third better positioned to defend market share amid evolving regional banking challenges.
Which stock offers better returns?
The past year shows strong bullish momentum for both stocks, with PNC accelerating more sharply and exhibiting wider price swings than FITB.
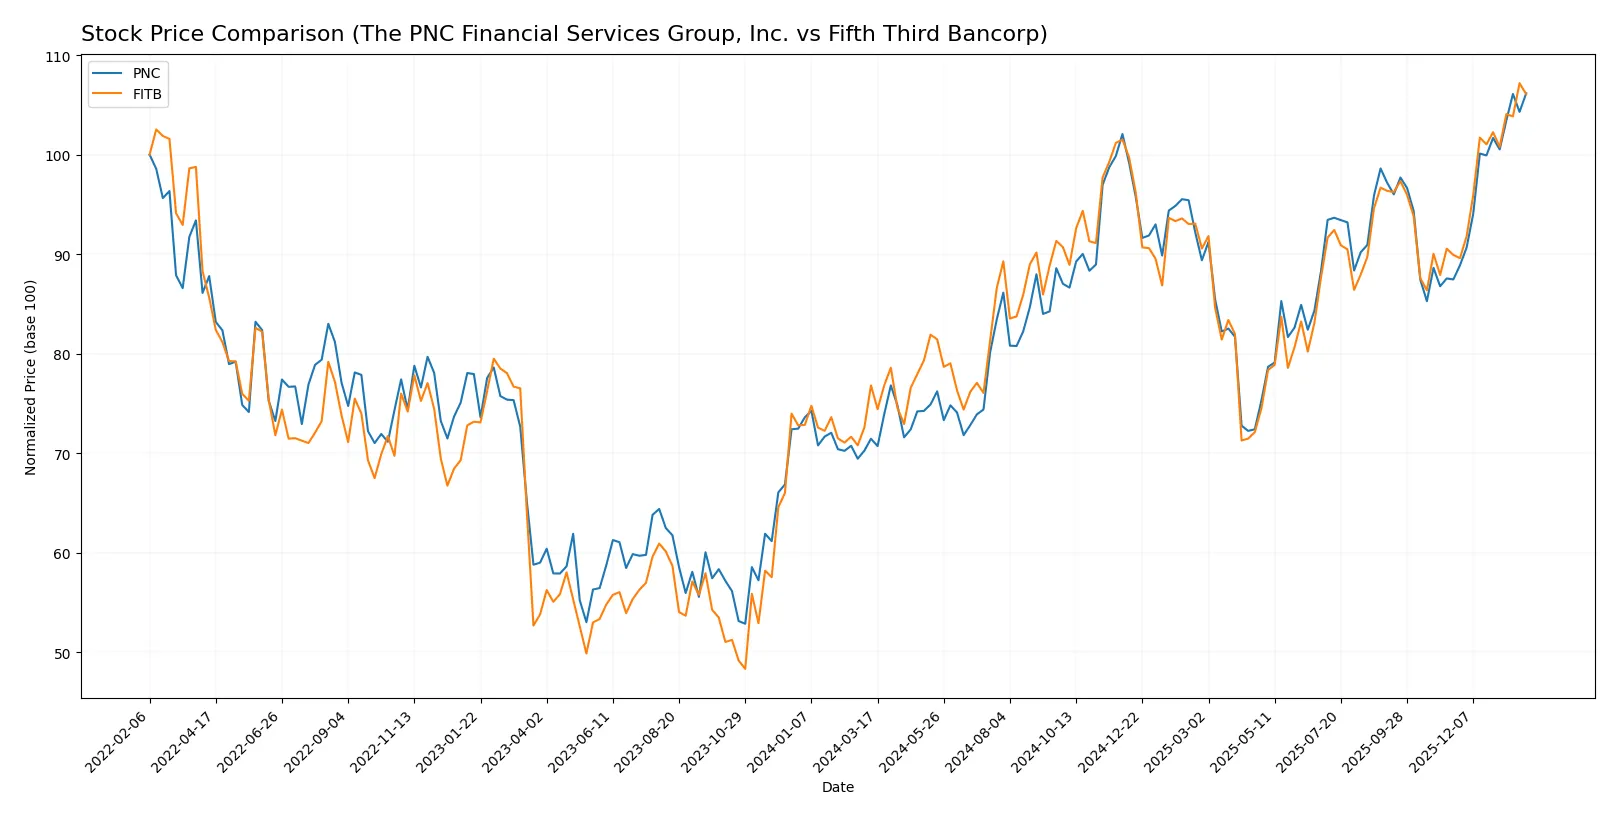
Trend Comparison
The PNC Financial Services Group, Inc. stock gained 48.54% over the past 12 months, showing a bullish trend with accelerating growth and a high volatility level of 19.63%. Its price ranged from 148.78 to 223.3, confirming strong upward momentum.
Fifth Third Bancorp rose 38.08% over the same period, also with a bullish and accelerating trend. Volatility remains moderate at 4.08%, with prices fluctuating between 33.75 and 50.74, indicating steadier gains compared to PNC.
PNC outperformed FITB by delivering a higher total return and exhibiting stronger acceleration, despite greater price volatility over the last year.
Target Prices
Analysts present a moderately bullish consensus on these regional banks, reflecting confidence in their recovery and growth prospects.
| Company | Target Low | Target High | Consensus |
|---|---|---|---|
| The PNC Financial Services Group, Inc. | 206 | 284 | 239.1 |
| Fifth Third Bancorp | 50 | 61 | 56.2 |
The consensus target prices suggest upside potential of roughly 7% for PNC and 12% for Fifth Third versus current prices. Analysts expect steady performance improvements within the sector.

Don’t Let Luck Decide Your Entry Point
Optimize your entry points with our advanced ProRealTime indicators. You’ll get efficient buy signals with precise price targets for maximum performance. Start outperforming now!
How do institutions grade them?
The following tables summarize recent grades assigned by reputable financial institutions for both companies:
The PNC Financial Services Group, Inc. Grades
This table lists recent grades from major institutions evaluating The PNC Financial Services Group:
| Grading Company | Action | New Grade | Date |
|---|---|---|---|
| Keefe, Bruyette & Woods | Maintain | Market Perform | 2026-01-20 |
| Wells Fargo | Maintain | Overweight | 2026-01-20 |
| Oppenheimer | Maintain | Outperform | 2026-01-20 |
| RBC Capital | Maintain | Outperform | 2026-01-20 |
| TD Cowen | Maintain | Buy | 2026-01-20 |
| Morgan Stanley | Maintain | Underweight | 2026-01-20 |
| TD Cowen | Maintain | Buy | 2026-01-07 |
| Barclays | Maintain | Overweight | 2026-01-05 |
| Truist Securities | Maintain | Hold | 2025-12-18 |
| Keefe, Bruyette & Woods | Maintain | Market Perform | 2025-12-17 |
Fifth Third Bancorp Grades
This table lists recent grades from major institutions evaluating Fifth Third Bancorp:
| Grading Company | Action | New Grade | Date |
|---|---|---|---|
| Truist Securities | Maintain | Buy | 2026-01-26 |
| DA Davidson | Maintain | Buy | 2026-01-26 |
| Citigroup | Maintain | Neutral | 2026-01-23 |
| Keefe, Bruyette & Woods | Maintain | Market Perform | 2026-01-21 |
| RBC Capital | Maintain | Outperform | 2026-01-21 |
| TD Cowen | Maintain | Buy | 2026-01-07 |
| Barclays | Maintain | Overweight | 2026-01-05 |
| Truist Securities | Maintain | Buy | 2025-12-22 |
| Keefe, Bruyette & Woods | Maintain | Market Perform | 2025-12-17 |
| Piper Sandler | Maintain | Overweight | 2025-12-10 |
Which company has the best grades?
Fifth Third Bancorp has received more consistent Buy and Outperform ratings than The PNC Financial Services Group. This suggests stronger institutional confidence, potentially influencing investor sentiment and capital flows.
Risks specific to each company
The following categories identify critical pressure points and systemic threats facing The PNC Financial Services Group, Inc. and Fifth Third Bancorp in the 2026 market environment:
1. Market & Competition
The PNC Financial Services Group, Inc.
- Large footprint with 2,591 branches faces intense regional banking competition.
Fifth Third Bancorp
- Smaller footprint with 1,117 branches limits scale but focuses on selective regional markets.
2. Capital Structure & Debt
The PNC Financial Services Group, Inc.
- Debt-to-assets at 9.96% is favorable; however, interest coverage at 0.78 signals risk in servicing debt.
Fifth Third Bancorp
- Lower debt-to-assets at 6.77% and better interest coverage at 0.82 suggest more prudent leverage management.
3. Stock Volatility
The PNC Financial Services Group, Inc.
- Beta near 0.99 indicates stock volatility closely tracks the market, moderate systemic risk.
Fifth Third Bancorp
- Beta at 0.99 also tracks market volatility; volume spikes may cause temporary price swings.
4. Regulatory & Legal
The PNC Financial Services Group, Inc.
- Large size invites heightened regulatory scrutiny, increasing compliance costs and legal exposure.
Fifth Third Bancorp
- Mid-sized regional bank faces similar regulatory challenges but on a smaller scale.
5. Supply Chain & Operations
The PNC Financial Services Group, Inc.
- Extensive branch and ATM network increases operational complexity and costs.
Fifth Third Bancorp
- Smaller network reduces operational risk but limits growth opportunities.
6. ESG & Climate Transition
The PNC Financial Services Group, Inc.
- ESG initiatives critical to maintain investor confidence amid rising climate risk regulations.
Fifth Third Bancorp
- ESG commitments increasingly vital; lagging efforts could damage reputation and access to capital.
7. Geopolitical Exposure
The PNC Financial Services Group, Inc.
- Primarily US-focused, limiting direct geopolitical risk but vulnerable to domestic policy shifts.
Fifth Third Bancorp
- Similar US concentration limits foreign risk but exposes firm to federal regulatory changes.
Which company shows a better risk-adjusted profile?
The most impactful risk for PNC lies in its weak interest coverage and distress-level Altman Z-score, signaling potential financial strain. For Fifth Third Bancorp, operational scale and regulatory pressures weigh most heavily, though it maintains a very strong Piotroski score. Overall, Fifth Third shows a slightly better risk-adjusted profile, supported by stronger leverage metrics and fixed asset turnover. The distress-level Altman Z-score for both firms demands caution, but Fifth Third’s more favorable debt management and operational efficiency mitigate risks better in 2026.
Final Verdict: Which stock to choose?
The PNC Financial Services Group excels as a robust cash generator with improving profitability despite value erosion indicated by ROIC below WACC. Its lower liquidity ratios signal a point of vigilance but fit well in an aggressive growth portfolio aiming to capitalize on earnings momentum and operational leverage.
Fifth Third Bancorp offers a more balanced safety profile, leveraging a solid strategic moat through efficient capital use and a strong tangible asset base. Its consistent free cash flow and moderate valuation multiples make it suitable for a GARP-focused portfolio seeking stable growth with reasonable risk management.
If you prioritize aggressive earnings growth and can tolerate liquidity constraints, PNC outshines with its accelerating profitability and market momentum. However, if you seek better stability and capital efficiency in banking with a slightly safer balance sheet, Fifth Third Bancorp offers a compelling alternative. Both present analytical scenarios worth considering based on your risk tolerance and investment horizon.
Disclaimer: Investment carries a risk of loss of initial capital. The past performance is not a reliable indicator of future results. Be sure to understand risks before making an investment decision.
Go Further
I encourage you to read the complete analyses of The PNC Financial Services Group, Inc. and Fifth Third Bancorp to enhance your investment decisions: