Home > Comparison > Financial Services > FITB vs RF
The competitive dynamic between Fifth Third Bancorp and Regions Financial Corporation shapes regional banking in the U.S. Fifth Third operates as a diversified financial services firm with broad commercial and consumer banking, while Regions emphasizes corporate banking alongside consumer and wealth management. This head-to-head reflects a strategic contest for regional leadership amid evolving interest rate cycles. This analysis will identify which bank offers the superior risk-adjusted return potential for a balanced portfolio.

Table of contents
Companies Overview
Fifth Third Bancorp and Regions Financial Corporation are key players shaping the regional banking landscape in the US.
Fifth Third Bancorp: Diversified Regional Financial Powerhouse
Fifth Third Bancorp operates as a diversified financial services company with a strong focus on commercial and consumer banking. Its revenue stems from credit intermediation, lending, deposit products, and wealth management services. In 2021, it emphasized expanding its branch network and deepening client relationships across multiple Midwestern and Southeastern states.
Regions Financial Corporation: Southern and Midwestern Banking Specialist
Regions Financial Corporation excels as a financial holding company delivering commercial and consumer banking alongside wealth management. It drives revenue through corporate lending, consumer loans, and advisory services. In 2022, its strategy centered on broadening its presence in the South, Midwest, and Texas through 1,300 branches and 2,000 ATMs.
Strategic Collision: Similarities & Divergences
Both banks prioritize commercial and consumer banking, yet Fifth Third takes a more diversified approach across regions while Regions focuses on the South and Texas. Their battleground is client acquisition in mid-sized markets with integrated banking and wealth management offerings. Investors face distinct profiles: Fifth Third’s broad footprint contrasts with Regions’ regional concentration and targeted growth.
Income Statement Comparison
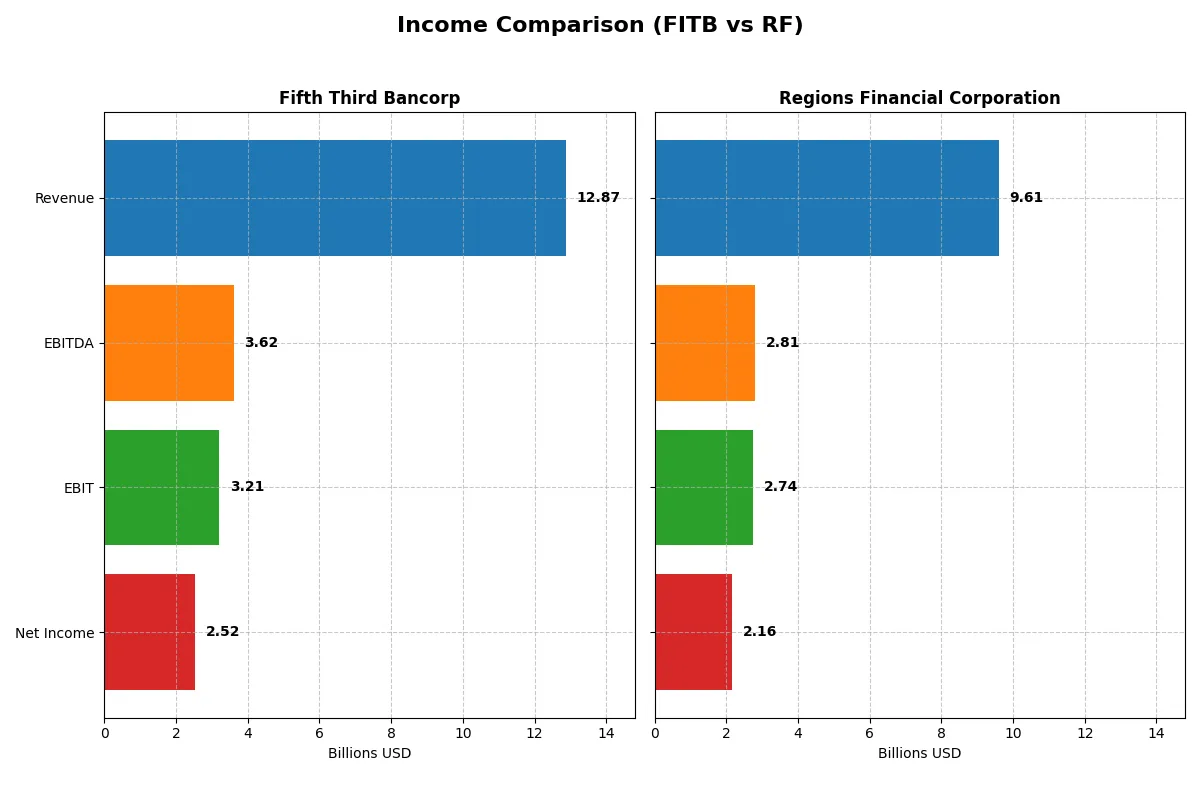
This data dissects the core profitability and scalability of both corporate engines to reveal who dominates the bottom line:
| Metric | Fifth Third Bancorp (FITB) | Regions Financial Corporation (RF) |
|---|---|---|
| Revenue | 12.9B | 9.61B |
| Cost of Revenue | 4.47B | 2.44B |
| Operating Expenses | 5.19B | 4.43B |
| Gross Profit | 8.40B | 7.17B |
| EBITDA | 3.62B | 2.81B |
| EBIT | 3.21B | 2.74B |
| Interest Expense | 3.92B | 2.08B |
| Net Income | 2.52B | 2.16B |
| EPS | 3.55 | 2.31 |
| Fiscal Year | 2025 | 2025 |
Income Statement Analysis: The Bottom-Line Duel
The following income statement comparison reveals which company operates with greater efficiency and profitability in the current competitive banking environment.
Fifth Third Bancorp Analysis
Fifth Third Bancorp’s revenue grew 62% from 2021 to 2025 but dipped 1.4% in the latest year to $12.9B. Its net income shows a mixed trend, declining nearly 9% over five years but rising 10.6% in 2025 to $2.52B. Gross margin remains strong at 65.3%, while net margin improved to 19.6%, signaling growing operational efficiency despite a high 30.5% interest expense burden.
Regions Financial Corporation Analysis
Regions Financial Corporation increased revenue by 45.5% over five years, reaching $9.61B in 2025, with a modest 2.5% growth last year. Net income fell 14.5% over the period but climbed 11.1% in the latest year to $2.16B. Regions boasts a superior gross margin of 74.6% and net margin of 22.4%, coupled with a lower interest expense ratio of 21.7%, reflecting efficient cost management and solid profit generation.
Margin Strength vs. Revenue Growth
Regions Financial leads in profitability metrics with higher gross and net margins and lower interest costs. Fifth Third exhibits stronger revenue growth but faces pressure on net income and interest expenses. Investors seeking margin resilience may prefer Regions, while those favoring growth might lean toward Fifth Third’s expanding top line.
Financial Ratios Comparison
These vital ratios act as a diagnostic tool to expose the underlying fiscal health, valuation premiums, and capital efficiency for both companies:
| Ratios | Fifth Third Bancorp (FITB) | Regions Financial Corporation (RF) |
|---|---|---|
| ROE | 11.6% | 11.3% |
| ROIC | 8.9% | 13.8% |
| P/E | 12.3 | 11.0 |
| P/B | 1.43 | 1.25 |
| Current Ratio | 0.82 | 0.30 |
| Quick Ratio | 0.82 | 0.30 |
| D/E (Debt-to-Equity) | 0.67 | 0.26 |
| Debt-to-Assets | 6.8% | 3.1% |
| Interest Coverage | 0.82 | 1.32 |
| Asset Turnover | 0.06 | 0.06 |
| Fixed Asset Turnover | 4.14 | 5.79 |
| Payout Ratio | 39.8% | 41.8% |
| Dividend Yield | 3.23% | 3.80% |
| Fiscal Year | 2025 | 2025 |
Efficiency & Valuation Duel: The Vital Signs
Ratios act as a company’s DNA, unveiling hidden operational strengths and risks that shape investment decisions.
Fifth Third Bancorp
Fifth Third shows neutral ROE at 11.6% and a solid net margin of 19.6%, signaling decent profitability. Its P/E of 12.3 and P/B of 1.43 suggest the stock trades at reasonable value, not stretched. A 3.23% dividend yield complements moderate shareholder returns, balancing income with reinvestment in growth.
Regions Financial Corporation
Regions boasts a higher net margin of 22.4% and favorable ROIC at 13.8%, reflecting efficient capital use. The stock trades cheaper with a P/E of 11.0 and P/B of 1.25, indicating attractive valuation. A stronger 3.8% dividend yield enhances total returns, reinforcing shareholder value through consistent payouts.
Valuation Discipline Meets Operational Efficiency
Regions Financial offers a better blend of profitability and valuation metrics, with higher returns and a cheaper price. Fifth Third’s profile suits investors valuing stability and moderate income. The choice hinges on preference for premium efficiency or steady dividend income.
Which one offers the Superior Shareholder Reward?
I see Fifth Third Bancorp (FITB) and Regions Financial Corporation (RF) both pay dividends with solid yields, but their distribution strategies diverge. FITB offers a 3.2% dividend yield with a 40% payout ratio, balancing dividends and moderate buybacks. RF yields slightly higher at 3.8%, with a 42% payout ratio, but emphasizes conservative debt and consistent buybacks. FITB’s payout is well-covered by earnings, yet its leverage is higher (debt-to-equity ~0.67 vs. RF’s ~0.26), which raises risk. RF deploys capital efficiently, maintaining stronger interest coverage and lower financial leverage, supporting sustainable dividends and aggressive buybacks. Historically, banks with disciplined capital allocation and lower leverage outperform peers in shareholder returns. I conclude RF offers a superior total return profile in 2026 due to its more sustainable distribution model and prudent balance sheet management.
Comparative Score Analysis: The Strategic Profile
The radar chart reveals the fundamental DNA and trade-offs of Fifth Third Bancorp and Regions Financial Corporation, illustrating their core financial strengths and vulnerabilities:
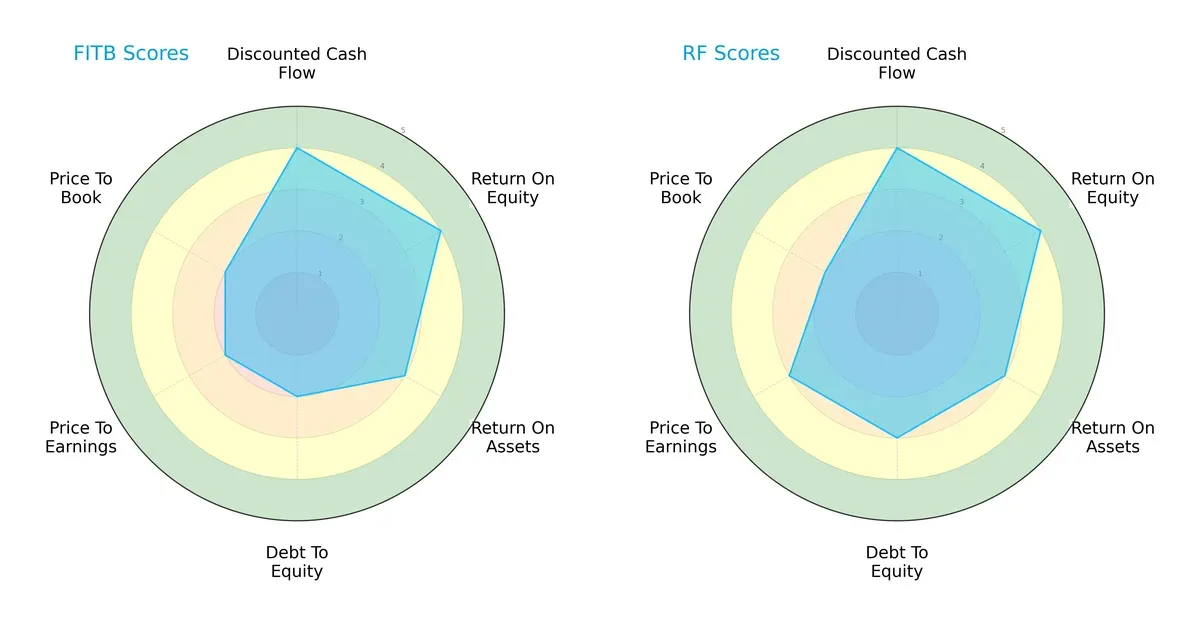
Both firms show strong discounted cash flow and return on equity scores at 4, reflecting efficient profit generation and solid valuation models. Their return on assets scores are moderate at 3, indicating average asset utilization. Regions edges out Fifth Third with a better debt-to-equity score of 3 versus 2, signaling a slightly stronger balance sheet. Regions also posts a higher price-to-earnings score (3 vs. 2), suggesting a more favorable market valuation. Fifth Third’s profile appears less balanced, relying more heavily on specific strengths like ROE and DCF, while Regions maintains a more evenly distributed financial scorecard.
Bankruptcy Risk: Solvency Showdown
The Altman Z-Scores place both firms deep in the distress zone, signaling elevated bankruptcy risk amid current market conditions:
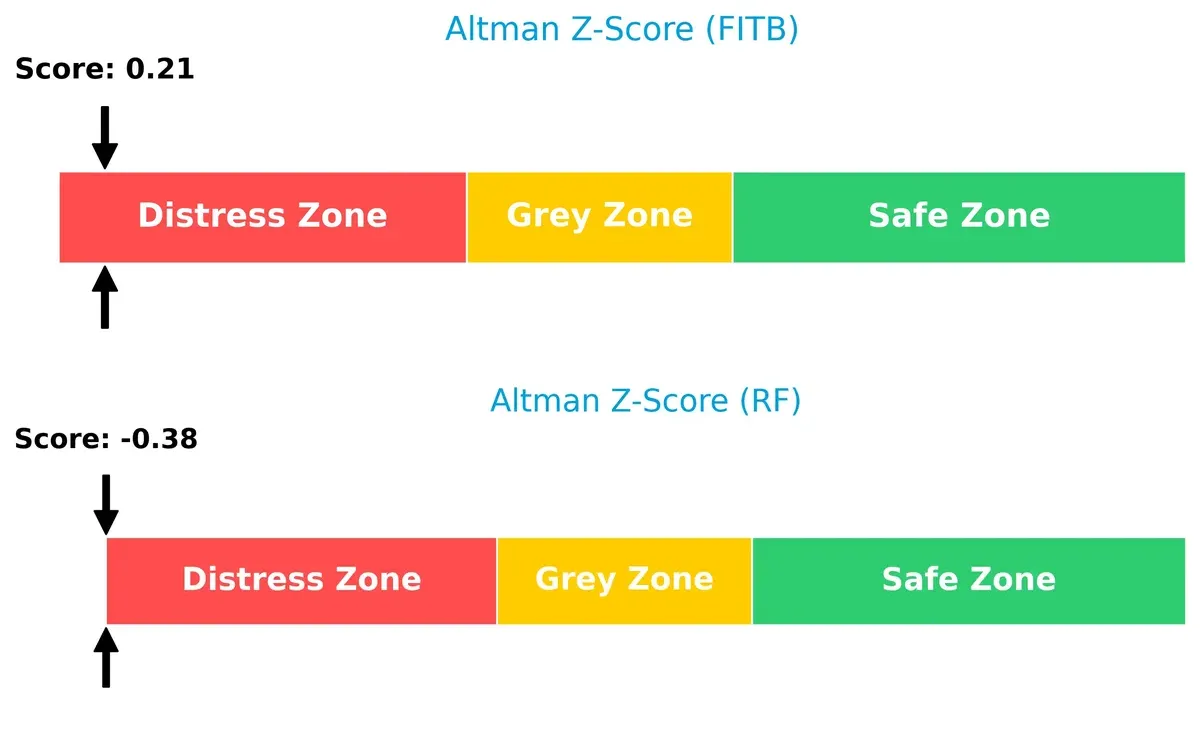
Fifth Third posts a fragile 0.21, slightly better than Regions’ -0.38. Both scores indicate severe financial stress, with a high probability of default if adverse conditions persist. Investors must weigh the risk of insolvency heavily in any allocation decision.
Financial Health: Quality of Operations
Piotroski F-Scores reveal both companies in very strong financial health, reflecting robust internal metrics and operational quality:
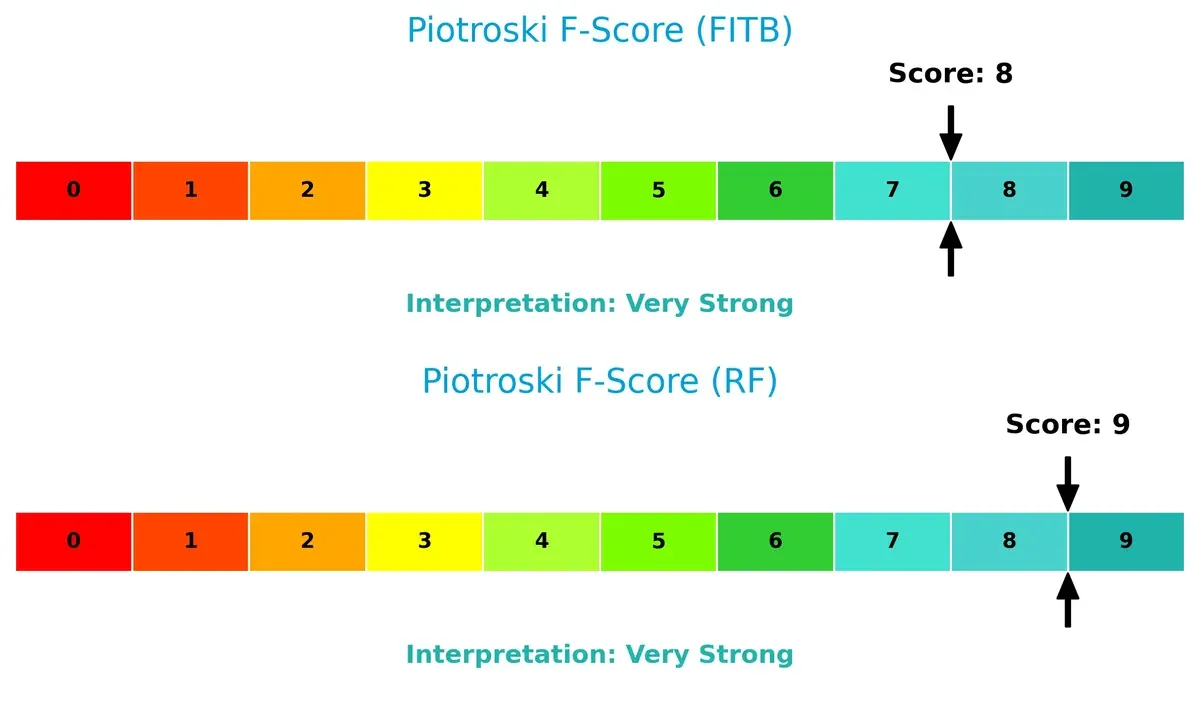
Regions scores a perfect 9, edging out Fifth Third’s strong 8. These high scores demonstrate solid profitability, efficient asset use, and prudent leverage management. Neither firm shows immediate red flags internally, but the marginal advantage favors Regions in operational strength.
—
In sum, Regions Financial Corporation offers a more balanced financial profile and slightly better operational health. Yet, both face significant solvency risks per Altman Z-Scores. Prudent investors should monitor these risks closely while valuing their strong cash flow and profitability metrics.
How are the two companies positioned?
This section dissects the operational DNA of Fifth Third Bancorp and Regions Financial by comparing revenue distribution and internal strengths and weaknesses. The objective is to confront their economic moats and identify which model delivers the most resilient competitive advantage today.
Revenue Segmentation: The Strategic Mix
This visual comparison dissects how Fifth Third Bancorp and Regions Financial Corporation diversify their income streams and where their primary sector bets lie:
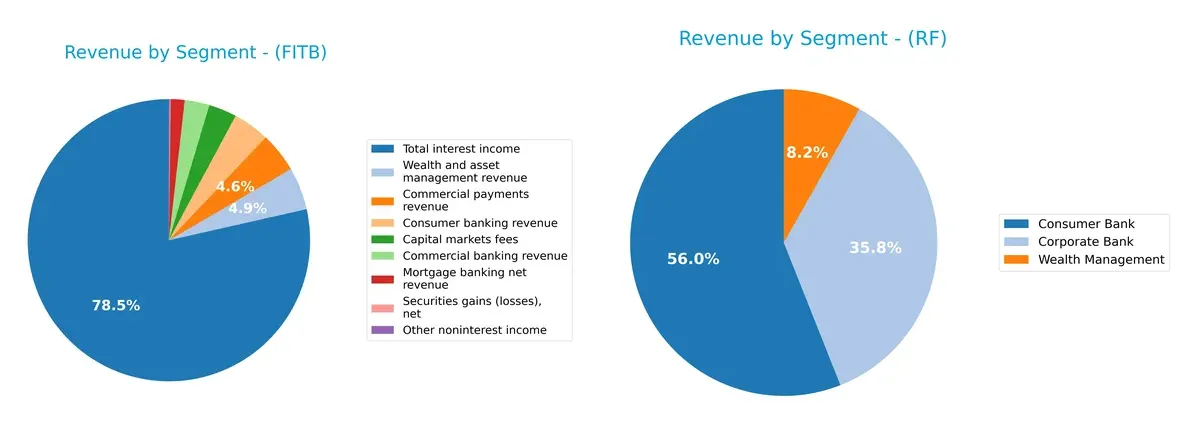
Fifth Third Bancorp anchors its revenue heavily on total interest income at $10.4B, complemented by diverse streams like commercial payments ($608M) and wealth management ($647M). Regions Financial leans on concentrated strength in consumer banking ($3.1B) and corporate banking ($2B), with wealth management trailing ($457M). Fifth Third’s broader diversification suggests a strategy balancing interest margins and fee income, while Regions’ focus risks cyclical pressure but benefits from scale and operational focus.
Strengths and Weaknesses Comparison
This table compares the Strengths and Weaknesses of Fifth Third Bancorp and Regions Financial Corporation:
Fifth Third Bancorp Strengths
- Diverse revenue streams including wealth management and capital markets fees
- Favorable net margin of 19.61%
- Favorable dividend yield at 3.23%
- Favorable fixed asset turnover of 4.14
- Favorable debt-to-assets ratio at 6.77%
Regions Financial Corporation Strengths
- Higher net margin of 22.44%
- Stronger ROIC at 13.79%, above WACC
- Favorable fixed asset turnover of 5.79
- Favorable dividend yield at 3.8%
- Lower debt-to-assets at 3.06%
- Favorable debt-to-equity ratio at 0.26
Fifth Third Bancorp Weaknesses
- Unfavorable current ratio at 0.82 signals liquidity constraints
- Unfavorable WACC at 12.33%, above ROIC
- Unfavorable interest coverage ratio at 0.82
- Unfavorable asset turnover at 0.06
- Neutral ROE at 11.61% below WACC
Regions Financial Corporation Weaknesses
- Very low current and quick ratios at 0.3, indicating liquidity risk
- Unfavorable WACC at 12.77%, above ROIC
- Unfavorable interest coverage ratio at 1.32
- Unfavorable asset turnover at 0.06
- Higher percentage of unfavorable ratios (35.71%) compared to FITB
Overall, Regions Financial exhibits stronger profitability ratios and more efficient asset utilization but faces greater liquidity challenges than Fifth Third Bancorp. Both companies need to manage capital costs carefully, as WACC exceeds ROIC, impacting capital allocation strategies.
The Moat Duel: Analyzing Competitive Defensibility
A structural moat is the only true shield protecting long-term profits from relentless competition erosion. Let’s dissect the competitive moats of two regional banks:
Fifth Third Bancorp: Emerging Profitability Despite Value Destruction
Fifth Third’s primary moat is intangible assets and customer relationships, reflected in its improving ROIC trend despite trailing WACC by 3.4%. Margin stability and a 10%+ net margin growth in 2025 hint at deepening profitability, yet the bank still sheds value overall. New products and regional expansion could bolster its moat if capital allocation improves.
Regions Financial Corporation: Growing Operational Efficiency but No Clear Moat
Regions leans on cost advantage and operational scale, evidenced by a 1% ROIC surplus over WACC and superior gross margin of 74.6%. This outperforms Fifth Third’s margin profile, signaling tighter cost control. Regions’ steady ROIC growth and expanding EBIT support moderate moat strength, though competitive pressures in regional banking limit moat depth. Expansion into wealth management could enhance defensibility.
Margin Stability vs. Operational Scale: Who Defends Best?
Regions Financial exhibits a wider moat with ROIC surpassing WACC and stronger margins, signaling efficient capital use and value creation. Fifth Third shows potential but still destroys value despite rising profitability. Regions is better positioned to defend market share amid tightening regional bank competition.
Which stock offers better returns?
The past year shows strong bullish trends for both stocks, with Fifth Third Bancorp and Regions Financial accelerating price gains and distinct trading volume dynamics.
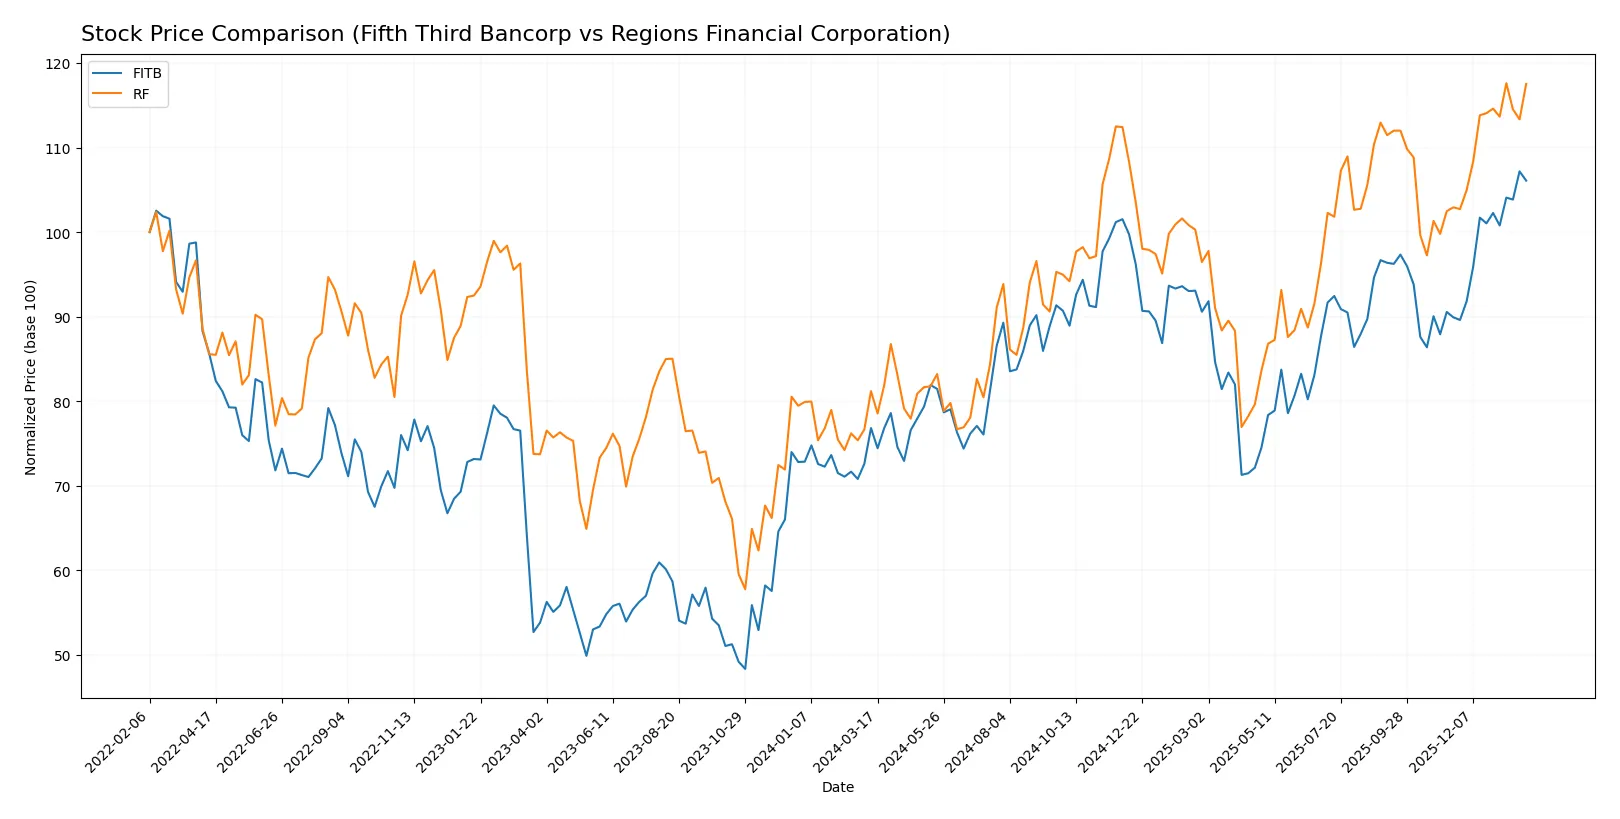
Trend Comparison
Fifth Third Bancorp’s stock rose 38.08% over the past year, showing bullish acceleration and a volatility measure (std deviation) of 4.08. It hit a high of 50.74 and bottomed at 33.75.
Regions Financial Corporation gained 44.74% in the same period, also accelerating bullish momentum but with lower volatility at 2.78. Its price ranged between 18.6 and 28.52.
Regions Financial outperformed Fifth Third Bancorp in total returns, delivering the highest market performance over the last 12 months.
Target Prices
Analysts present a moderate upside for regional banks Fifth Third Bancorp and Regions Financial Corporation.
| Company | Target Low | Target High | Consensus |
|---|---|---|---|
| Fifth Third Bancorp | 50 | 61 | 56.2 |
| Regions Financial Corporation | 27 | 32 | 29.89 |
Both stocks trade near the lower end of analyst targets, signaling cautious optimism amid regional bank pressures. Investors should weigh these targets against current macro risks.

Don’t Let Luck Decide Your Entry Point
Optimize your entry points with our advanced ProRealTime indicators. You’ll get efficient buy signals with precise price targets for maximum performance. Start outperforming now!
How do institutions grade them?
Here is a summary of recent institutional grades for Fifth Third Bancorp and Regions Financial Corporation:
Fifth Third Bancorp Grades
This table presents recent grades assigned by reputable financial institutions to Fifth Third Bancorp.
| Grading Company | Action | New Grade | Date |
|---|---|---|---|
| Truist Securities | Maintain | Buy | 2026-01-26 |
| DA Davidson | Maintain | Buy | 2026-01-26 |
| Citigroup | Maintain | Neutral | 2026-01-23 |
| Keefe, Bruyette & Woods | Maintain | Market Perform | 2026-01-21 |
| RBC Capital | Maintain | Outperform | 2026-01-21 |
| TD Cowen | Maintain | Buy | 2026-01-07 |
| Barclays | Maintain | Overweight | 2026-01-05 |
| Truist Securities | Maintain | Buy | 2025-12-22 |
| Keefe, Bruyette & Woods | Maintain | Market Perform | 2025-12-17 |
| Piper Sandler | Maintain | Overweight | 2025-12-10 |
Regions Financial Corporation Grades
This table summarizes the latest institutional grades for Regions Financial Corporation.
| Grading Company | Action | New Grade | Date |
|---|---|---|---|
| Piper Sandler | Maintain | Neutral | 2026-01-20 |
| Wells Fargo | Maintain | Underweight | 2026-01-20 |
| Keefe, Bruyette & Woods | Downgrade | Market Perform | 2026-01-20 |
| Wells Fargo | Downgrade | Underweight | 2026-01-16 |
| Evercore ISI Group | Downgrade | Underperform | 2026-01-06 |
| Barclays | Maintain | Underweight | 2026-01-05 |
| Truist Securities | Maintain | Hold | 2025-12-22 |
| Keefe, Bruyette & Woods | Maintain | Outperform | 2025-12-17 |
| Truist Securities | Maintain | Hold | 2025-10-20 |
| Stephens & Co. | Downgrade | Equal Weight | 2025-10-14 |
Which company has the best grades?
Fifth Third Bancorp consistently receives positive grades, mostly Buy or Outperform, from various firms. Regions Financial Corporation shows more downgrades and Underweight ratings, signaling weaker sentiment. Investors may interpret this divergence as a reflection of differing market confidence levels.
Risks specific to each company
The following categories identify the critical pressure points and systemic threats facing both firms in the 2026 market environment:
1. Market & Competition
Fifth Third Bancorp
- Faces intense regional banking competition with a diversified service offering across multiple states.
Regions Financial Corporation
- Competes aggressively in overlapping markets, focusing heavily on commercial and consumer banking services.
2. Capital Structure & Debt
Fifth Third Bancorp
- Moderate debt-to-equity ratio (0.67) with some concern over interest coverage at 0.82 times.
Regions Financial Corporation
- Lower debt-to-equity (0.26) and better interest coverage (1.32 times) suggest stronger financial stability.
3. Stock Volatility
Fifth Third Bancorp
- Beta near 1 (0.988) implies stock price moves closely with the market, moderate volatility.
Regions Financial Corporation
- Slightly higher beta (1.039) indicates marginally greater sensitivity to market swings.
4. Regulatory & Legal
Fifth Third Bancorp
- Subject to stringent U.S. banking regulations; compliance complexity rising with expanded commercial services.
Regions Financial Corporation
- Similar regulatory environment, with additional scrutiny on regional lending and wealth management divisions.
5. Supply Chain & Operations
Fifth Third Bancorp
- Operates 1,117 branches and 2,322 ATMs, requiring robust operational management and technology investment.
Regions Financial Corporation
- Runs 1,300 offices and 2,000 ATMs, emphasizing efficiency in overlapping geographic regions.
6. ESG & Climate Transition
Fifth Third Bancorp
- Increasing pressure to integrate ESG into lending and asset management; transition risk in fossil fuel exposure.
Regions Financial Corporation
- Actively addressing ESG risks; stronger focus on sustainable finance but still exposed to regional energy sectors.
7. Geopolitical Exposure
Fifth Third Bancorp
- Primarily U.S.-focused with limited international exposure; regional economic cycles significantly impact performance.
Regions Financial Corporation
- Also U.S.-centric; heightened sensitivity to economic shifts in the South and Midwest regions.
Which company shows a better risk-adjusted profile?
Regions Financial Corporation’s lower leverage, superior interest coverage, and stronger ESG initiatives give it a more resilient risk profile. Fifth Third Bancorp’s higher debt and weaker liquidity ratios expose it to greater financial stress risks. Both firms face intense competition and regulatory challenges, but Regions balances these with more favorable capital structure metrics. The recent Altman Z-scores place both in distress zones; however, Regions’ perfect Piotroski score and better debt metrics suggest a safer investment stance.
Final Verdict: Which stock to choose?
Fifth Third Bancorp’s superpower lies in its improving profitability amid challenging capital costs. It steadily grows returns on invested capital, signaling operational resilience. The key point of vigilance is its below-par liquidity ratios, which could pressure short-term flexibility. FITB suits aggressive growth portfolios willing to embrace moderate risk for improving efficiency.
Regions Financial Corporation commands a strategic moat through superior capital efficiency and stronger balance sheet metrics. Its lower leverage and higher return on invested capital hint at a more sustainable value creation path. RF offers better stability and fits well within GARP portfolios seeking growth with a disciplined risk profile.
If you prioritize operational turnaround and improving profitability, Fifth Third Bancorp presents a compelling scenario due to its accelerating earnings momentum. However, if you seek financial stability and consistent capital efficiency, Regions Financial outshines with its stronger moat and safer leverage. Both stocks carry risks typical of regional banks, so investor risk tolerance shapes the optimal choice.
Disclaimer: Investment carries a risk of loss of initial capital. The past performance is not a reliable indicator of future results. Be sure to understand risks before making an investment decision.
Go Further
I encourage you to read the complete analyses of Fifth Third Bancorp and Regions Financial Corporation to enhance your investment decisions: