Home > Comparison > Financial Services > FITB vs MTB
The strategic rivalry between Fifth Third Bancorp and M&T Bank Corporation shapes the dynamics of the regional banking sector. Fifth Third Bancorp operates as a diversified financial services firm with a broad product range and extensive branch network. In contrast, M&T Bank Corporation focuses on commercial and retail banking with a strong presence in the Mid-Atlantic region. This analysis will assess which bank offers a superior risk-adjusted return for diversified portfolios amid evolving financial landscapes.

Table of contents
Companies Overview
Fifth Third Bancorp and M&T Bank Corporation stand as pivotal regional banks shaping the U.S. financial services landscape.
Fifth Third Bancorp: Diversified Regional Bank Leader
Fifth Third Bancorp operates as a diversified financial services company focused on commercial, branch, and consumer lending. Its core revenue stems from credit intermediation, cash management, and wealth management services. In 2021, the company emphasized expanding its full-service banking footprint across 12 states while enhancing asset-based lending and capital markets services.
M&T Bank Corporation: Commercial and Retail Banking Powerhouse
M&T Bank Corporation leads with a strong commercial and retail banking platform serving small to large businesses and consumers. It generates revenue through commercial lending, real estate financing, and wealth management. The strategic focus in 2021 centered on deepening market penetration in the Northeast and Mid-Atlantic while growing its residential mortgage and discretionary portfolio segments.
Strategic Collision: Similarities & Divergences
Both banks prioritize commercial and retail banking, competing fiercely in regional markets for lending and deposit growth. Fifth Third leans into a broader geographic footprint with diverse product lines, while M&T emphasizes deep regional expertise and real estate finance. Their distinct approaches create unique risk and growth profiles, reflecting divergent capital allocation and market positioning strategies.
Income Statement Comparison
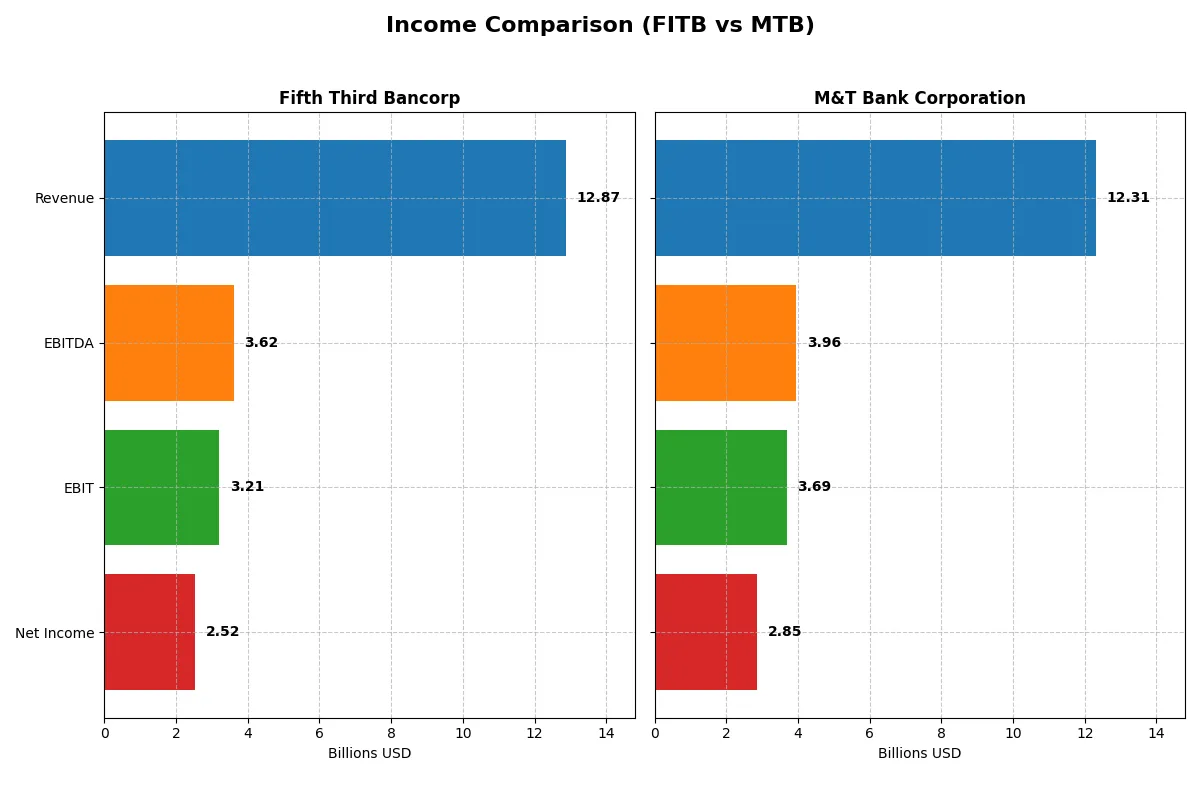
This data dissects the core profitability and scalability of both corporate engines to reveal who dominates the bottom line:
| Metric | Fifth Third Bancorp (FITB) | M&T Bank Corporation (MTB) |
|---|---|---|
| Revenue | 12.87B | 12.31B |
| Cost of Revenue | 4.47B | 3.12B |
| Operating Expenses | 5.19B | 5.49B |
| Gross Profit | 8.40B | 9.19B |
| EBITDA | 3.62B | 3.96B |
| EBIT | 3.21B | 3.69B |
| Interest Expense | 3.92B | 3.54B |
| Net Income | 2.52B | 2.85B |
| EPS | 3.55 | 17.10 |
| Fiscal Year | 2025 | 2025 |
Income Statement Analysis: The Bottom-Line Duel
The income statement comparison reveals which bank runs its business with superior efficiency and stronger profit momentum through recent market cycles.
Fifth Third Bancorp Analysis
Fifth Third Bancorp’s revenue grew 62% from 2021 to 2025 but dipped slightly by 1.4% in the last year. Net income shows a mixed picture, declining almost 9% over five years but rising 10.6% year-over-year. Gross margin stands at a solid 65.3%, while net margin sits at 19.6%, reflecting decent profitability despite a high interest expense ratio of 30.5%. The latest year’s profit growth signals improving operational efficiency and margin recovery.
M&T Bank Corporation Analysis
M&T Bank’s revenue soared 103% over five years but fell 8.2% in 2025, showing more volatility. Net income surged 53% overall and rose nearly 20% last year. Gross margin reached a robust 74.6%, and net margin hit 23.2%, outperforming Fifth Third in profitability metrics despite a comparable interest expense burden of 28.7%. M&T’s stronger EBIT margin of 30% and consistent earnings growth highlight superior capital allocation and cost controls.
Margin Strength vs. Earnings Momentum
M&T Bank outpaces Fifth Third Bancorp with higher gross and net margins and stronger net income growth both annually and over the longer term. Fifth Third shows resilience with steady margin recovery and decent profit growth last year but lags in overall earnings expansion. For investors prioritizing sustained profitability and margin power, M&T presents a more compelling income statement profile.
Financial Ratios Comparison
These vital ratios act as a diagnostic tool to expose the underlying fiscal health, valuation premiums, and capital efficiency for informed investor analysis:
| Ratios | Fifth Third Bancorp (FITB) | M&T Bank Corporation (MTB) |
|---|---|---|
| ROE | 11.6% | 9.8% |
| ROIC | 8.9% | 6.8% |
| P/E | 12.3 | 11.5 |
| P/B | 1.43 | 1.13 |
| Current Ratio | 0.82 | 0.32 |
| Quick Ratio | 0.82 | 0.32 |
| D/E | 0.67 | 0.45 |
| Debt-to-Assets | 6.8% | 6.1% |
| Interest Coverage | 0.82 | 1.04 |
| Asset Turnover | 0.06 | 0.06 |
| Fixed Asset Turnover | 4.14 | N/A |
| Payout Ratio | 39.8% | 32.6% |
| Dividend Yield | 3.23% | 2.83% |
| Fiscal Year | 2025 | 2025 |
Efficiency & Valuation Duel: The Vital Signs
Financial ratios serve as a company’s DNA, uncovering hidden risks and operational strengths that shape investor decisions.
Fifth Third Bancorp
Fifth Third Bancorp shows solid profitability with a neutral 11.6% ROE and a favorable 19.6% net margin. Its valuation metrics are attractive, with a P/E of 12.33 and P/B of 1.43, signaling reasonable pricing. The stock offers a 3.23% dividend yield, rewarding shareholders while maintaining a balanced capital allocation.
M&T Bank Corporation
M&T Bank Corporation delivers a higher net margin of 23.16% but a slightly unfavorable 9.8% ROE, indicating moderate profitability efficiency. The stock trades at a favorable P/E of 11.54 and P/B of 1.13, suggesting it’s attractively valued. M&T pays a 2.83% dividend yield, supporting steady shareholder returns amid some operational headwinds.
Valuation Appeal vs. Operational Resilience
Fifth Third Bancorp balances valuation and shareholder yield with neutral profitability metrics, while M&T offers stronger margins but weaker ROE and more ratio weaknesses. Investors seeking stable dividends with reasonable growth may prefer Fifth Third, while those favoring margin strength might lean toward M&T.
Which one offers the Superior Shareholder Reward?
I compare Fifth Third Bancorp (FITB) and M&T Bank Corporation (MTB) by their dividend yields, payout ratios, and buyback intensity. FITB yields 3.2% with a 40% payout ratio, showing consistent dividend coverage. MTB offers a slightly lower yield of 2.8% but a more conservative 33% payout ratio. MTB’s free cash flow per share is significantly higher (over 20 vs. near zero for FITB), enabling more robust buybacks and reinvestment. Historically, MTB’s lower leverage (debt-to-equity ~0.45 vs. FITB’s ~0.67) supports sustainable capital returns. I see MTB’s balanced model of dividends and strong buybacks as superior for long-term total return in 2026.
Comparative Score Analysis: The Strategic Profile
The radar chart reveals the fundamental DNA and trade-offs of Fifth Third Bancorp and M&T Bank Corporation, highlighting their financial strengths and valuation nuances:
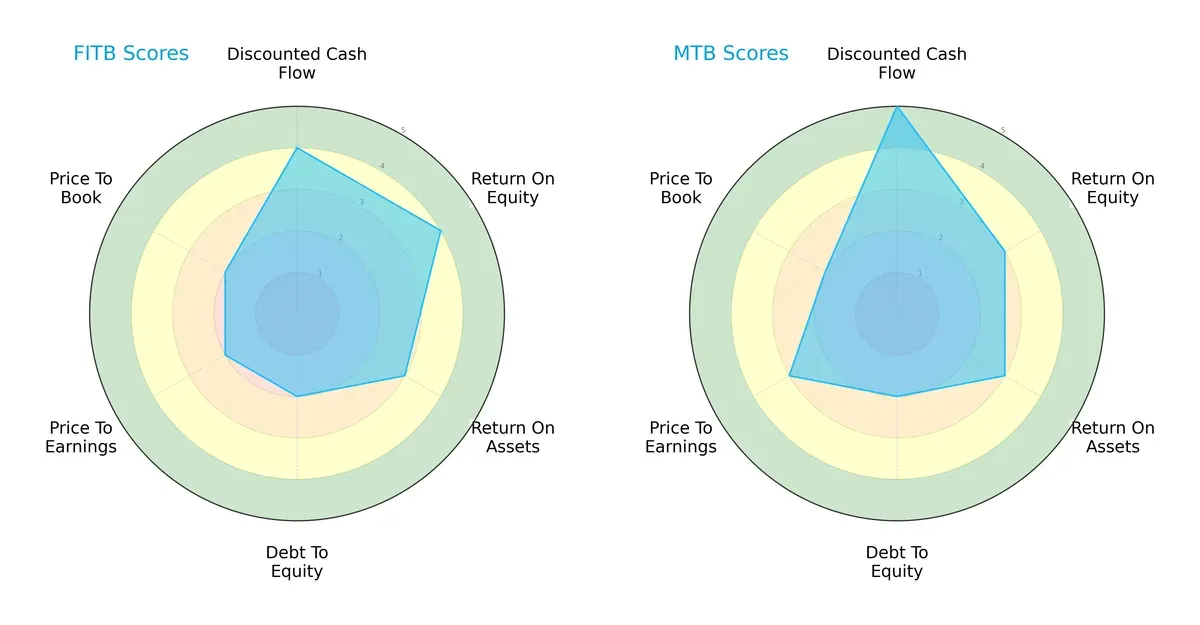
Fifth Third Bancorp shows strength in ROE (score 4) and DCF (4), signaling efficient capital use and attractive cash flow prospects. M&T Bank edges ahead on DCF (5) and P/E (3), suggesting a slightly better valuation and cash flow outlook. Both firms share moderate debt-to-equity risks (score 2), but Fifth Third relies more on profitability metrics, while M&T Bank presents a more balanced valuation profile.
—
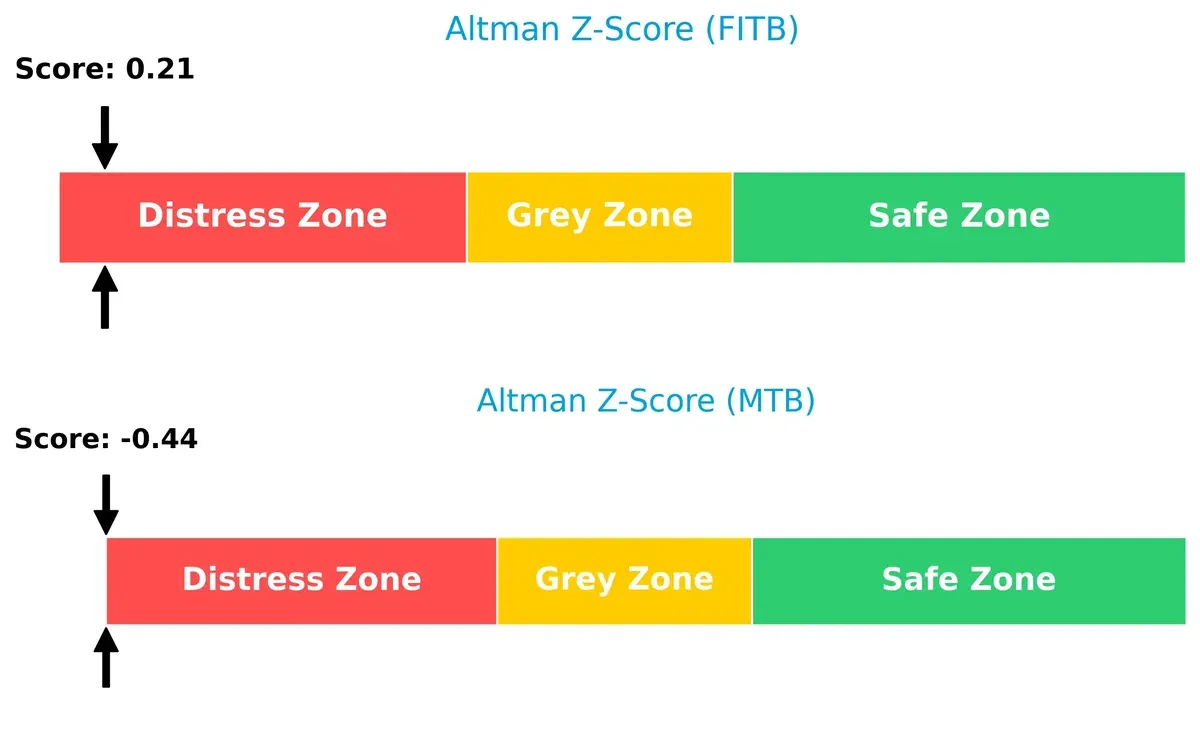
Bankruptcy Risk: Solvency Showdown
Fifth Third Bancorp’s Altman Z-Score of 0.21 slightly outperforms M&T Bank’s -0.44, but both remain in the distress zone, signaling elevated bankruptcy risks in this cycle:
—
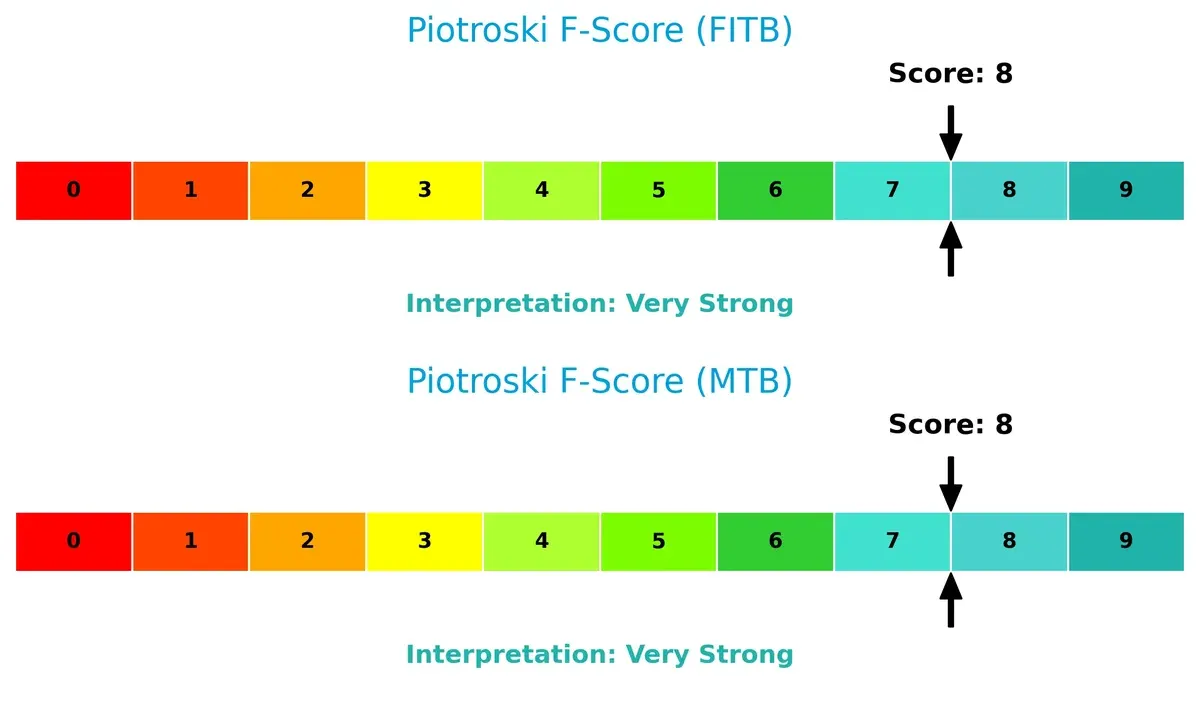
Financial Health: Quality of Operations
Both companies score an 8 on the Piotroski F-Score, reflecting very strong internal financial health and operational quality, with no immediate red flags detected:
How are the two companies positioned?
This section dissects the operational DNA of Fifth Third Bancorp and M&T Bank Corporation by comparing their revenue distribution and internal strengths and weaknesses. The final objective is to confront their economic moats and identify which business model offers the most resilient, sustainable competitive advantage in today’s market.
Revenue Segmentation: The Strategic Mix
The following visual comparison dissects how Fifth Third Bancorp and M&T Bank Corporation diversify their income streams and where their primary sector bets lie:
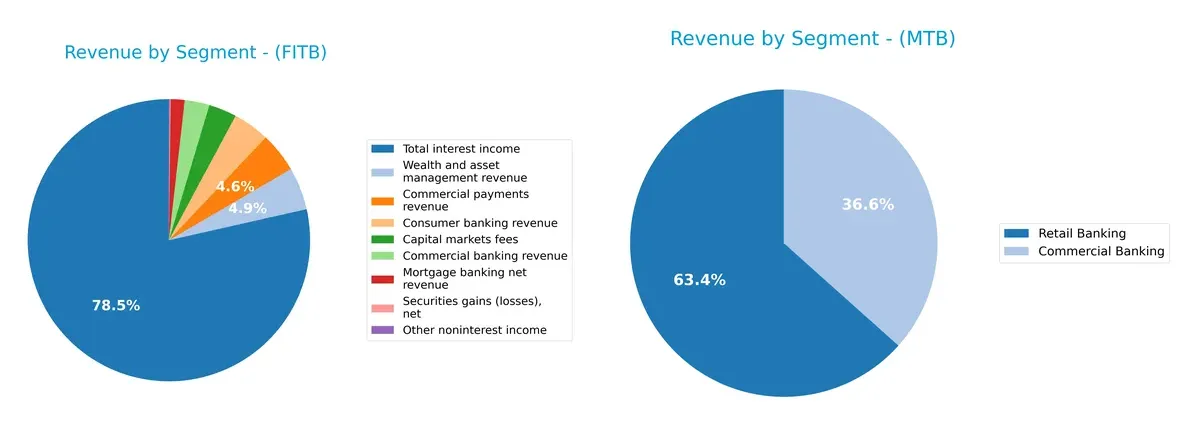
Fifth Third Bancorp anchors its revenue with $10.4B from interest income, complemented by diverse streams like wealth management ($647M) and commercial payments ($608M). M&T Bank shows a more balanced mix, with retail banking ($471M) and commercial banking ($272M) revenues sharing focus. Fifth Third leans on interest income dominance, raising concentration risk, while M&T’s broader segment spread suggests strategic resilience through diversified banking services.
Strengths and Weaknesses Comparison
This table compares the Strengths and Weaknesses of Fifth Third Bancorp and M&T Bank Corporation:
Fifth Third Bancorp Strengths
- Diverse revenue streams across commercial, consumer banking, wealth, and capital markets
- Favorable net margin at 19.61%
- Strong fixed asset turnover at 4.14
- Favorable valuation multiples (PE 12.33, PB 1.43)
- Solid dividend yield at 3.23%
M&T Bank Corporation Strengths
- Higher net margin at 23.16%
- Favorable debt-to-equity and debt-to-assets ratios
- Favorable valuation multiples (PE 11.54, PB 1.13)
- Diversified banking segments including retail, commercial, fiduciary, and mortgage
- Presence of “All Other” geographic revenue indicating some geographic spread
Fifth Third Bancorp Weaknesses
- Current ratio below 1 at 0.82 indicating liquidity risk
- Unfavorable WACC at 12.33% exceeding ROIC
- Low interest coverage ratio at 0.82
- Asset turnover very low at 0.06
- Neutral ROE and ROIC below WACC
M&T Bank Corporation Weaknesses
- Very low current and quick ratios at 0.32 showing liquidity constraints
- Unfavorable WACC at 10.43% above ROIC
- Zero fixed asset turnover, signaling inefficiency
- Unfavorable ROE at 9.77% below sector averages
- Higher proportion of unfavorable financial ratios (50%)
Both banks exhibit strengths in profitability and valuation metrics, but face liquidity and capital efficiency challenges. Fifth Third shows greater revenue diversification, while M&T has stronger net margins but weaker liquidity ratios. These factors shape their strategic priorities differently.
The Moat Duel: Analyzing Competitive Defensibility
A structural moat alone shields long-term profits from relentless competition and market erosion. Here’s how Fifth Third Bancorp and M&T Bank stack up:
Fifth Third Bancorp: Emerging Profitability Amid Value Destruction
Fifth Third’s moat hinges on diversified commercial and consumer banking services, creating moderate switching costs. Despite a negative ROIC vs. WACC gap signaling value destruction, its ROIC growth suggests improving operational efficiency in 2026.
M&T Bank Corporation: Legacy Cost Advantage Facing Decline
M&T’s moat rests on scale-driven cost advantages and strong regional presence. However, a declining ROIC trend combined with value destruction indicates weakening competitive positioning, though its higher margins reflect some resilience as it explores new market expansions.
ROIC Resilience vs. Traditional Cost Leadership
Fifth Third displays a narrower moat but improving profitability trends. M&T’s wider moat suffers from eroding returns and shrinking economic profits. I see Fifth Third better positioned to defend and deepen its market share in 2026.
Which stock offers better returns?
Both stocks show strong price appreciation over the past year, with notable acceleration and distinct trading volume dynamics shaping investor interest.
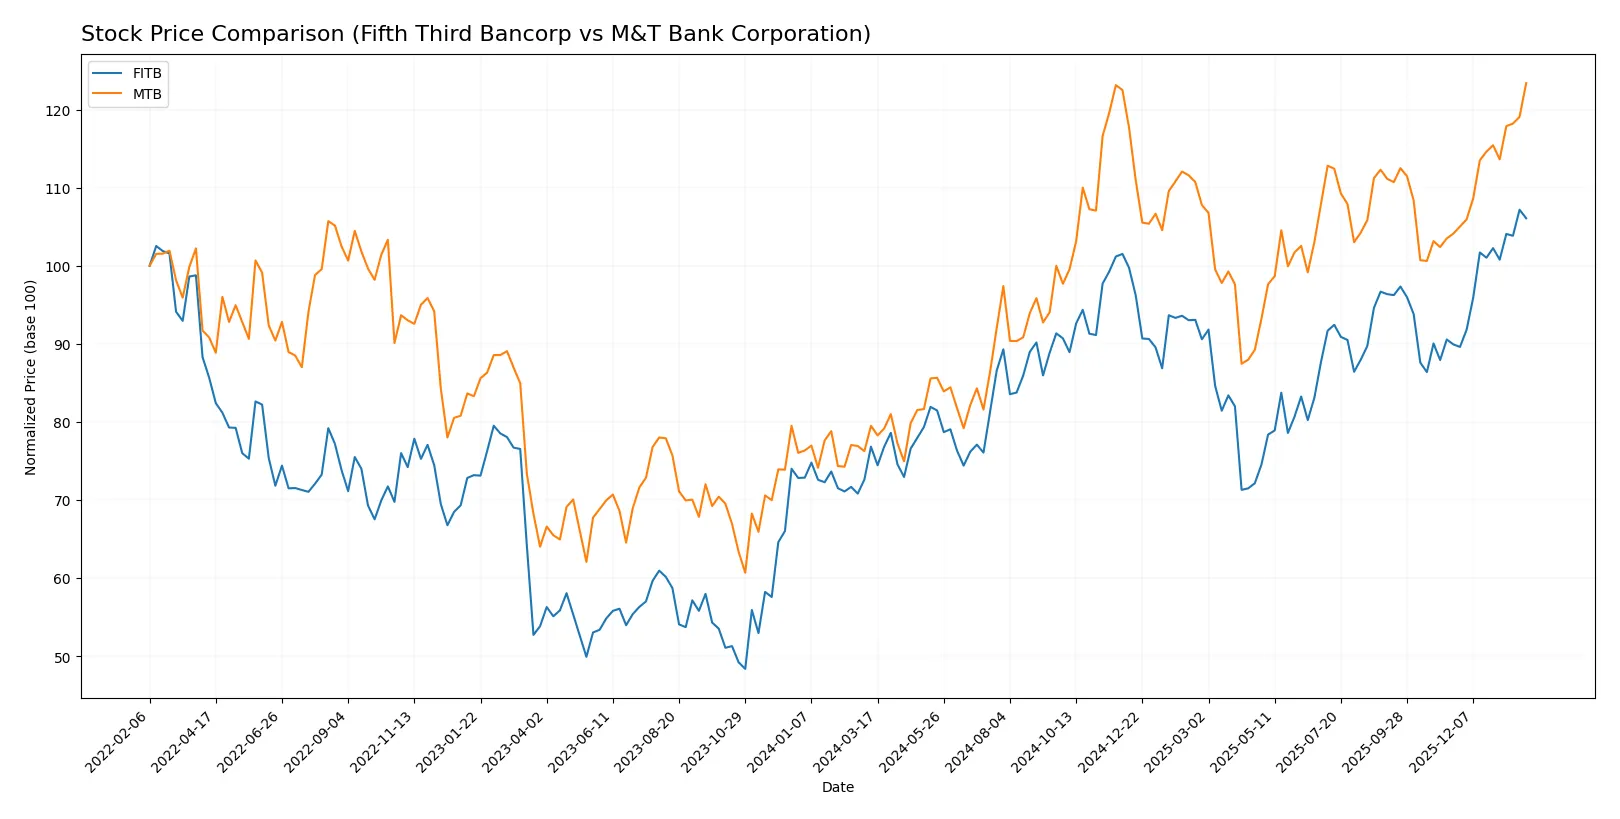
Trend Comparison
Fifth Third Bancorp (FITB) gained 38.08% over the past 12 months, demonstrating a bullish trend with accelerating momentum and moderate volatility (std dev 4.08). The price ranged from 33.75 to 50.74.
M&T Bank Corporation (MTB) posted a 55.23% increase over the same period, also bullish with accelerating gains but higher volatility (std dev 21.88). Its price moved between 134.56 and 221.57.
MTB outperformed FITB in market returns with stronger price growth and higher recent buyer dominance, reflecting more robust investor enthusiasm.
Target Prices
Analysts present a confident target price consensus for Fifth Third Bancorp and M&T Bank Corporation.
| Company | Target Low | Target High | Consensus |
|---|---|---|---|
| Fifth Third Bancorp | 50 | 61 | 56.2 |
| M&T Bank Corporation | 208 | 255 | 230.8 |
The consensus target prices imply moderate upside for both banks versus current prices: FITB trades near its low target, MTB trades slightly below its consensus target. Analysts expect steady sector performance.

Don’t Let Luck Decide Your Entry Point
Optimize your entry points with our advanced ProRealTime indicators. You’ll get efficient buy signals with precise price targets for maximum performance. Start outperforming now!
How do institutions grade them?
The following tables present recent institutional grades for Fifth Third Bancorp and M&T Bank Corporation:
Fifth Third Bancorp Grades
This table summarizes current grades issued by reputable financial institutions for Fifth Third Bancorp.
| Grading Company | Action | New Grade | Date |
|---|---|---|---|
| Truist Securities | Maintain | Buy | 2026-01-26 |
| DA Davidson | Maintain | Buy | 2026-01-26 |
| Citigroup | Maintain | Neutral | 2026-01-23 |
| Keefe, Bruyette & Woods | Maintain | Market Perform | 2026-01-21 |
| RBC Capital | Maintain | Outperform | 2026-01-21 |
| TD Cowen | Maintain | Buy | 2026-01-07 |
| Barclays | Maintain | Overweight | 2026-01-05 |
| Truist Securities | Maintain | Buy | 2025-12-22 |
| Keefe, Bruyette & Woods | Maintain | Market Perform | 2025-12-17 |
| Piper Sandler | Maintain | Overweight | 2025-12-10 |
M&T Bank Corporation Grades
This table summarizes current grades issued by reputable financial institutions for M&T Bank Corporation.
| Grading Company | Action | New Grade | Date |
|---|---|---|---|
| RBC Capital | Maintain | Outperform | 2026-01-20 |
| Jefferies | Maintain | Buy | 2026-01-16 |
| Wolfe Research | Downgrade | Peer Perform | 2026-01-07 |
| TD Cowen | Maintain | Buy | 2026-01-07 |
| B of A Securities | Downgrade | Neutral | 2026-01-07 |
| Evercore ISI Group | Downgrade | In Line | 2026-01-06 |
| Barclays | Maintain | Equal Weight | 2026-01-05 |
| Keefe, Bruyette & Woods | Maintain | Market Perform | 2025-12-17 |
| Truist Securities | Downgrade | Hold | 2025-12-12 |
| TD Cowen | Maintain | Buy | 2025-10-20 |
Which company has the best grades?
Fifth Third Bancorp consistently receives Buy and Outperform ratings, with no recent downgrades. M&T Bank shows mixed grades, including several downgrades. This suggests Fifth Third currently holds stronger institutional support, potentially influencing investor confidence.
Risks specific to each company
The following categories identify the critical pressure points and systemic threats facing both firms in the 2026 market environment:
1. Market & Competition
Fifth Third Bancorp
- Faces intense regional banking rivalry with pressure on margins despite a diverse service portfolio.
M&T Bank Corporation
- Operates in competitive Northeast markets with strong commercial banking focus but less geographic diversification.
2. Capital Structure & Debt
Fifth Third Bancorp
- Moderate debt-to-equity ratio (0.67) with favorable debt-to-assets but interest coverage is weak (0.82).
M&T Bank Corporation
- Lower debt-to-equity (0.45) and debt-to-assets favorable, but interest coverage only slightly better (1.04).
3. Stock Volatility
Fifth Third Bancorp
- Higher beta near 1 (0.988) indicates stock volatility close to market average.
M&T Bank Corporation
- Lower beta (0.583) suggests more stable stock with less sensitivity to market swings.
4. Regulatory & Legal
Fifth Third Bancorp
- Subject to US banking regulations with no recent major regulatory issues reported.
M&T Bank Corporation
- Similarly regulated with no significant legal challenges; operates with conservative risk policies.
5. Supply Chain & Operations
Fifth Third Bancorp
- Extensive branch network and ATM footprint spread across multiple states increases operational complexity.
M&T Bank Corporation
- Fewer branches but concentrated in the Northeast; operational efficiency may benefit from regional focus.
6. ESG & Climate Transition
Fifth Third Bancorp
- Increasing focus on sustainable financing but no clear ESG leadership in the sector.
M&T Bank Corporation
- ESG initiatives ongoing but lagging behind industry leaders; climate transition risks remain moderate.
7. Geopolitical Exposure
Fifth Third Bancorp
- Primarily US-focused with low direct geopolitical risk; some exposure via international trade finance.
M&T Bank Corporation
- US-centric with minor Canadian exposure; geopolitical risks are relatively contained.
Which company shows a better risk-adjusted profile?
M&T Bank Corporation’s lower beta and stronger debt metrics suggest a more stable risk profile. However, both firms reside in the distress zone for Altman Z-scores, raising bankruptcy concerns. Fifth Third’s weaker interest coverage and current ratio highlight liquidity risks. M&T’s moderate leverage and slightly higher interest coverage present a comparatively safer capital structure. The most impactful risk for Fifth Third is its poor liquidity position, evidenced by a current ratio of 0.82. For M&T, stock volatility is less concerning, but its low current ratio at 0.32 indicates substantial liquidity constraints. Overall, M&T’s risk-adjusted profile appears marginally better, supported by its stronger discounted cash flow score and lower market volatility.
Final Verdict: Which stock to choose?
Fifth Third Bancorp’s superpower lies in its improving profitability and operational efficiency, showing a promising upward trajectory despite value destruction concerns. Its notable liquidity constraints remain a point of vigilance. It suits portfolios willing to embrace moderate risk for growth potential.
M&T Bank Corporation commands a strategic moat through its stronger net margins and higher market appreciation, supported by a robust cash flow profile. While its declining profitability trend is worrisome, it offers better balance sheet stability relative to Fifth Third. It fits well in GARP portfolios seeking a balance between growth and safety.
If you prioritize operational improvement and growth momentum, Fifth Third Bancorp is the compelling choice due to its accelerating profitability and efficiency gains. However, if you seek better margin resilience and relative stability, M&T Bank offers superior cash flow strength and market performance, albeit with a caution on its declining ROIC trend.
Disclaimer: Investment carries a risk of loss of initial capital. The past performance is not a reliable indicator of future results. Be sure to understand risks before making an investment decision.
Go Further
I encourage you to read the complete analyses of Fifth Third Bancorp and M&T Bank Corporation to enhance your investment decisions: