Home > Comparison > Financial Services > FITB vs HBAN
The strategic rivalry between Fifth Third Bancorp and Huntington Bancshares defines the regional banking landscape in the U.S. Fifth Third operates a diversified financial services model with a strong commercial banking focus, while Huntington emphasizes a broad mix including vehicle finance and private banking. This head-to-head highlights a contrast between diversified growth and targeted specialty services. This analysis aims to identify which approach offers superior risk-adjusted returns for a balanced portfolio.
Table of contents
Companies Overview
Fifth Third Bancorp and Huntington Bancshares are key regional banks shaping the U.S. financial landscape.
Fifth Third Bancorp: Diversified Financial Powerhouse
Fifth Third Bancorp stands as a diversified financial services company with a stronghold in commercial and consumer banking. It generates revenue through credit intermediation, cash management, and lending products. In 2021, its strategic focus emphasized expanding commercial banking services and wealth management across multiple Midwest and Southeastern states.
Huntington Bancshares: Regional Banking Specialist
Huntington Bancshares operates as a bank holding company specializing in commercial, consumer, and mortgage banking. Its revenue engine revolves around retail and commercial loans, vehicle financing, and wealth management. In 2022, Huntington concentrated on enhancing regional commercial banking and vehicle finance while growing its private client segment in 11 states.
Strategic Collision: Similarities & Divergences
Both banks compete as regional leaders with broad portfolios spanning retail and commercial banking. Fifth Third leans on a more diversified commercial approach, while Huntington focuses sharply on vehicle finance and private wealth. The primary battleground is regional market penetration and client retention. Their investment profiles diverge between broad diversification and targeted niche expertise.
Income Statement Comparison
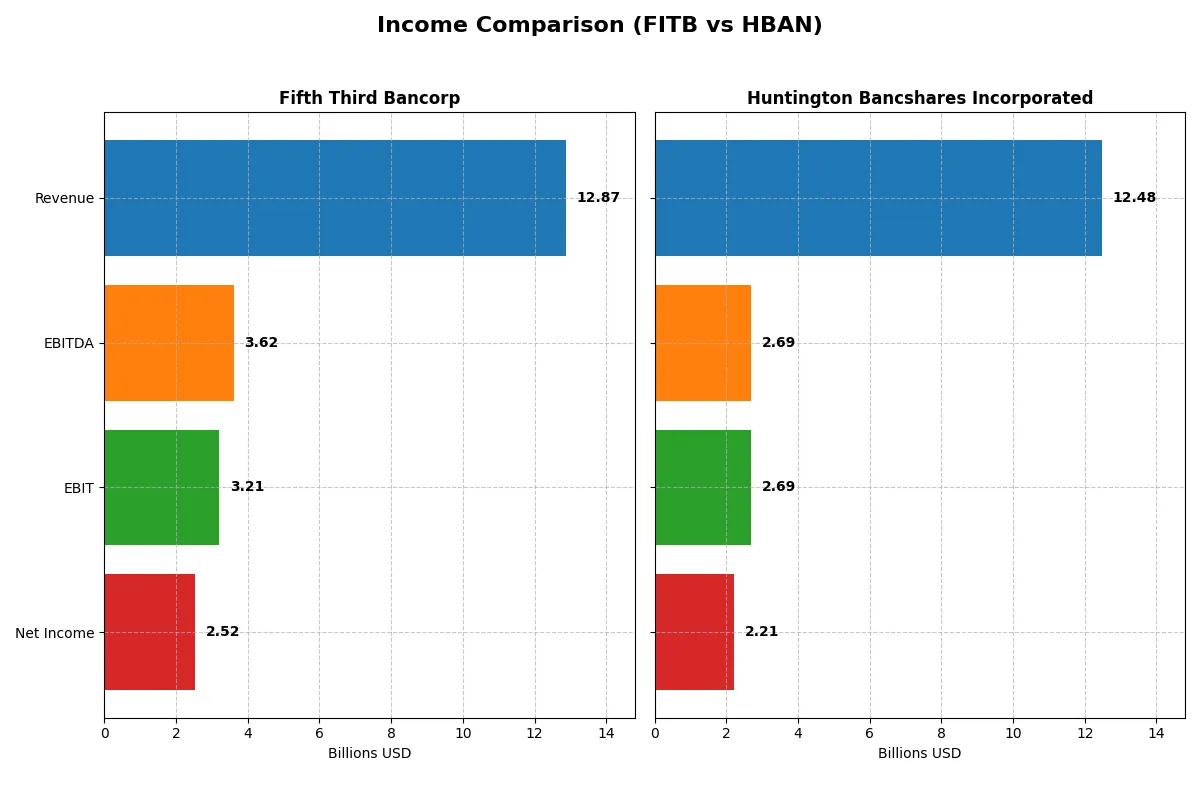
This data dissects the core profitability and scalability of both corporate engines to reveal who dominates the bottom line:
| Metric | Fifth Third Bancorp (FITB) | Huntington Bancshares (HBAN) |
|---|---|---|
| Revenue | 12.87B | 12.49B |
| Cost of Revenue | 4.47B | 4.78B |
| Operating Expenses | 5.19B | 5.02B |
| Gross Profit | 8.40B | 7.70B |
| EBITDA | 3.62B | 2.69B |
| EBIT | 3.21B | 2.69B |
| Interest Expense | 3.92B | 4.32B |
| Net Income | 2.52B | 2.21B |
| EPS | 3.55 | 1.41 |
| Fiscal Year | 2025 | 2025 |
Income Statement Analysis: The Bottom-Line Duel
The following income statement comparison reveals which company operates with stronger efficiency and margin discipline in a competitive banking environment.
Fifth Third Bancorp (FITB) Analysis
FITB’s revenue grew 62% from 2021 to 2025 but dipped 1.4% in the last year to $12.9B. Net income declined nearly 9% overall, settling at $2.52B in 2025. Gross margin remains robust at 65%, while the net margin improved to 19.6%, reflecting strong operational control despite a high interest expense ratio near 30%. Recent margin expansions highlight improving profitability momentum.
Huntington Bancshares Incorporated (HBAN) Analysis
HBAN’s revenue more than doubled over five years, reaching $12.5B in 2025, with a modest 4.4% rise last year. Net income jumped 71% overall to $2.22B, supported by a 17.7% net margin. The gross margin stands at a solid 61.7%, though interest expense consumes over 34% of revenue. EBIT growth and EPS surged in 2025, signaling effective cost management amid revenue expansion.
Margin Strength vs. Growth Momentum
FITB demonstrates superior margin efficiency, especially in gross and net margins, despite a slight revenue contraction last year. HBAN, conversely, shows stronger top-line and net income growth, with rising EPS and solid margin improvement. For investors prioritizing margin power, FITB’s disciplined profitability stands out. Those valuing dynamic growth and expanding earnings may find HBAN’s profile more compelling.
Financial Ratios Comparison
These vital ratios act as a diagnostic tool to expose the underlying fiscal health, valuation premiums, and capital efficiency of the companies compared below:
| Ratios | Fifth Third Bancorp (FITB) | Huntington Bancshares (HBAN) |
|---|---|---|
| ROE | 11.6% | 9.1% |
| ROIC | 8.9% | -1.7% |
| P/E | 12.3 | 11.6 |
| P/B | 1.43 | 1.05 |
| Current Ratio | 0.82 | 0.10 |
| Quick Ratio | 0.82 | 0.10 |
| D/E (Debt-to-Equity) | 0.67 | 0.76 |
| Debt-to-Assets | 6.8% | 8.2% |
| Interest Coverage | 0.82 | 0.62 |
| Asset Turnover | 0.06 | 0.06 |
| Fixed Asset Turnover | 4.14 | 9.45 |
| Payout Ratio | 39.8% | 41.5% |
| Dividend Yield | 3.23% | 3.57% |
| Fiscal Year | 2025 | 2025 |
Efficiency & Valuation Duel: The Vital Signs
Financial ratios form a company’s DNA, exposing hidden risks and operational excellence critical for evaluating investment prospects.
Fifth Third Bancorp
Fifth Third displays a solid 11.61% ROE and a strong 19.61% net margin, signaling decent profitability. Its P/E of 12.33 and P/B of 1.43 suggest the stock is fairly valued, leaning favorable compared to peers. The 3.23% dividend yield rewards shareholders, balancing modest returns with operational stability despite a weak current ratio.
Huntington Bancshares Incorporated
Huntington posts a lower 9.08% ROE and a 17.71% net margin, indicating less efficiency. Its P/E of 11.61 and P/B of 1.05 show a slightly cheaper valuation, but its negative ROIC flags capital allocation concerns. The 3.57% dividend yield compensates investors amid a very low current ratio, highlighting liquidity risk.
Valuation Fairness Meets Operational Soundness
Fifth Third offers a better blend of profitability and valuation metrics, with stable returns and a reasonable price. Huntington’s cheaper valuation masks weaker capital efficiency and liquidity risks. Investors prioritizing operational strength may favor Fifth Third, while those seeking yield at a discount might consider Huntington’s profile.
Which one offers the Superior Shareholder Reward?
I see Fifth Third Bancorp (FITB) delivers a 3.2% dividend yield with a moderate 40% payout ratio, balancing income and reinvestment. Huntington Bancshares (HBAN) offers a slightly higher 3.6% yield and a 41% payout, but with less free cash flow coverage. FITB’s buyback program is more aggressive and sustainable, fueling long-term value. HBAN’s smaller buybacks limit total return upside. I conclude FITB offers a superior shareholder reward in 2026 due to its balanced, cash-covered dividends and robust buyback activity.
Comparative Score Analysis: The Strategic Profile
The radar chart reveals the fundamental DNA and trade-offs of Fifth Third Bancorp and Huntington Bancshares, highlighting their financial strengths and valuation nuances:
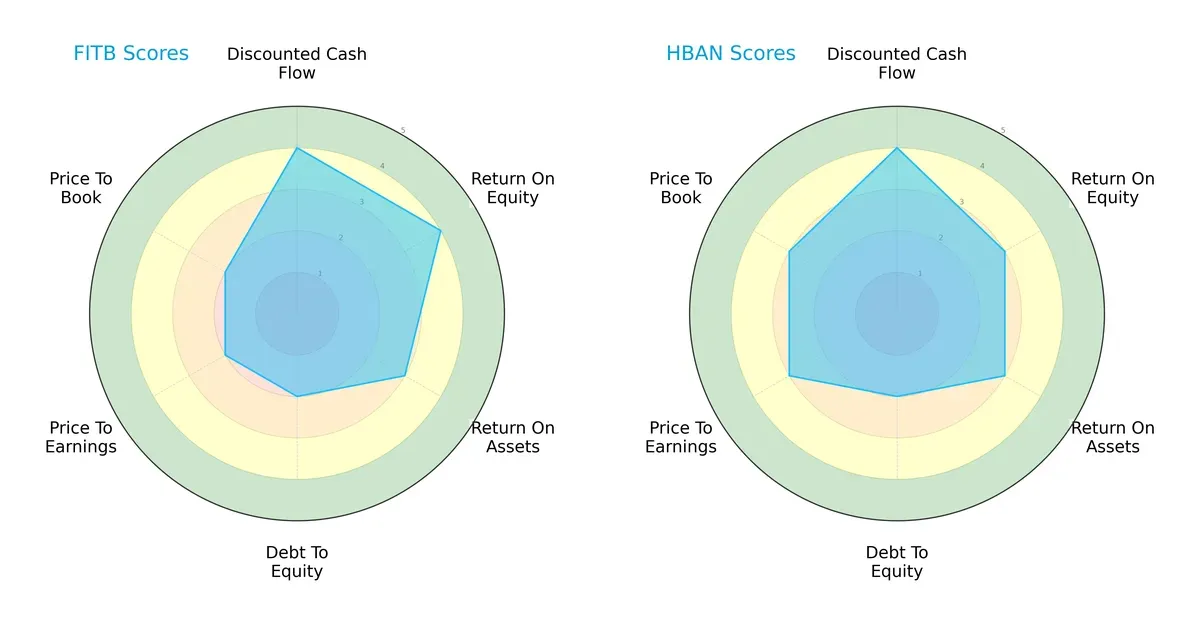
Fifth Third Bancorp shows higher scores in Return on Equity (4 vs. 3) and Return on Assets (3 vs. 3 tied), indicating superior profitability efficiency. Both firms share identical Debt/Equity scores (2), reflecting moderate leverage risk. Huntington edges out in valuation metrics (P/E and P/B scores of 3 vs. 2), suggesting better market pricing. Fifth Third presents a more balanced profitability profile, while Huntington leans on valuation advantages.
Bankruptcy Risk: Solvency Showdown
The Altman Z-Scores position both banks in the distress zone, signaling elevated bankruptcy risk amid current market pressures:
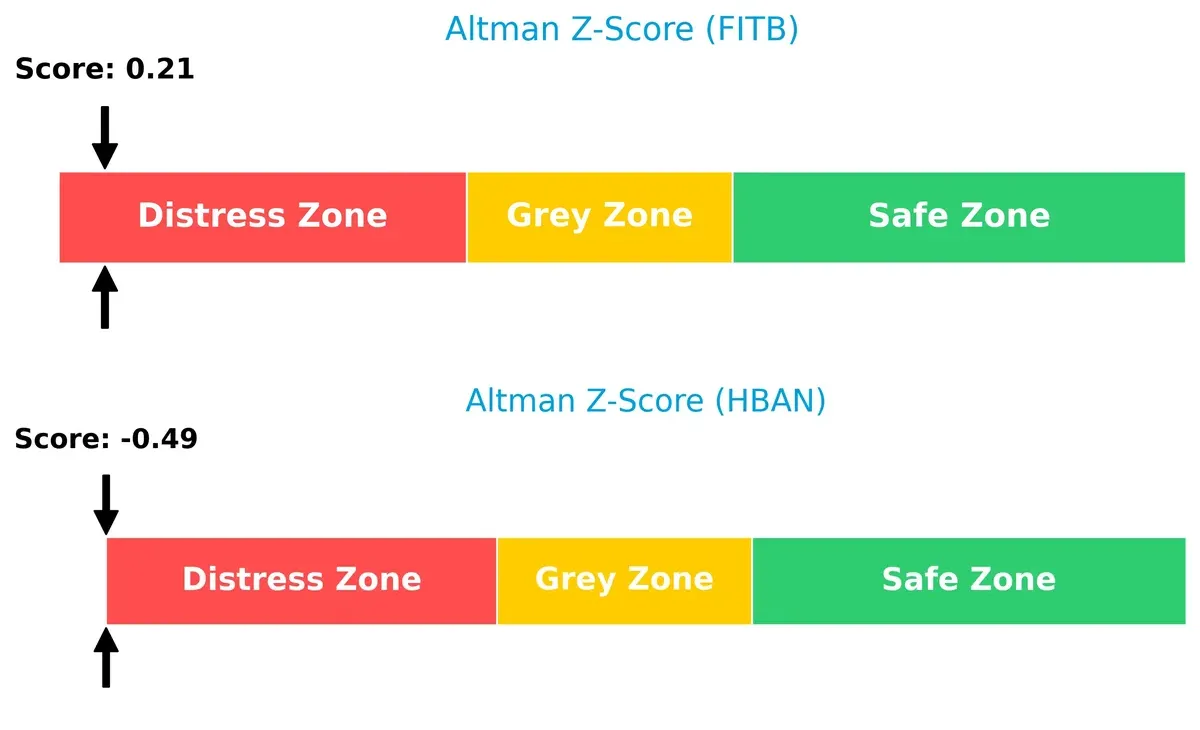
Fifth Third scores 0.21, slightly above Huntington’s -0.49, but both fall well below the safe-zone threshold of 3. This warns investors to be cautious, as neither firm currently demonstrates strong long-term solvency resilience.
Financial Health: Quality of Operations
Fifth Third’s Piotroski F-Score of 8 signals very strong financial health, outperforming Huntington’s average score of 5:
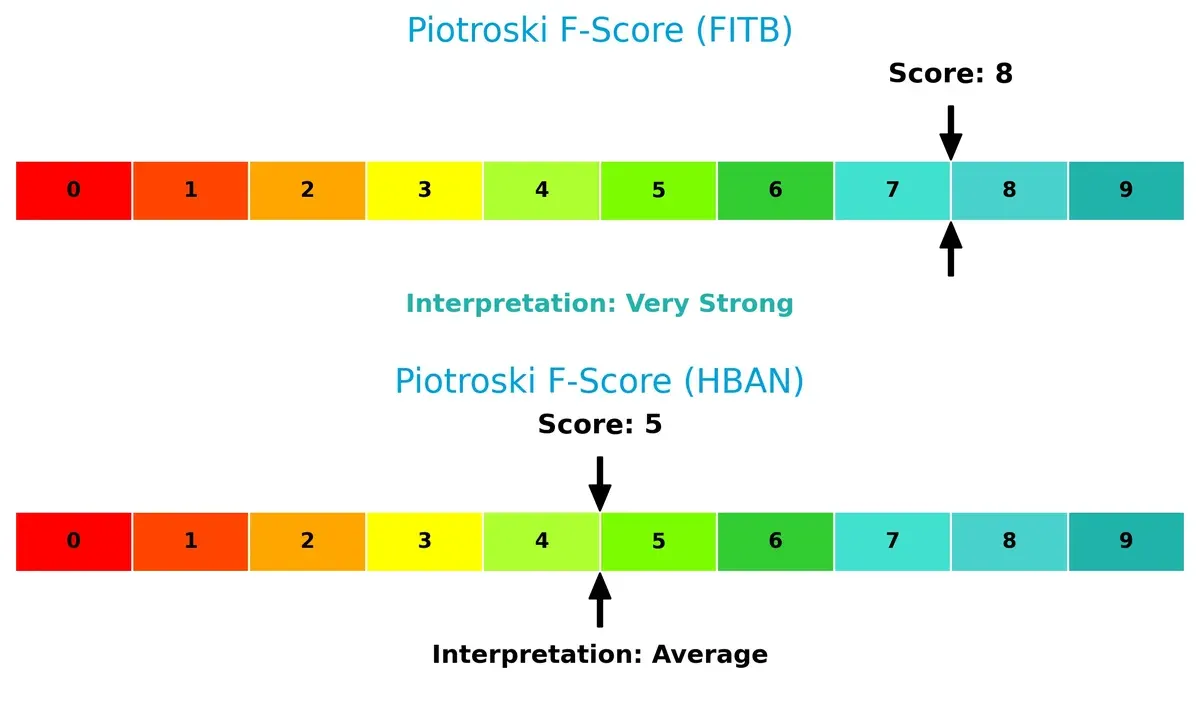
This disparity highlights Fifth Third’s superior internal operations and balance sheet quality. Huntington’s moderate score raises red flags about operational weaknesses that could impair value creation in a challenging cycle.
How are the two companies positioned?
This section dissects the operational DNA of Fifth Third Bancorp and Huntington Bancshares by comparing their revenue distribution and internal dynamics. The goal is to confront their economic moats to identify which business model offers the most resilient competitive advantage today.
Revenue Segmentation: The Strategic Mix
This visual comparison dissects how Fifth Third Bancorp and Huntington Bancshares diversify their income streams and where their primary sector bets lie:
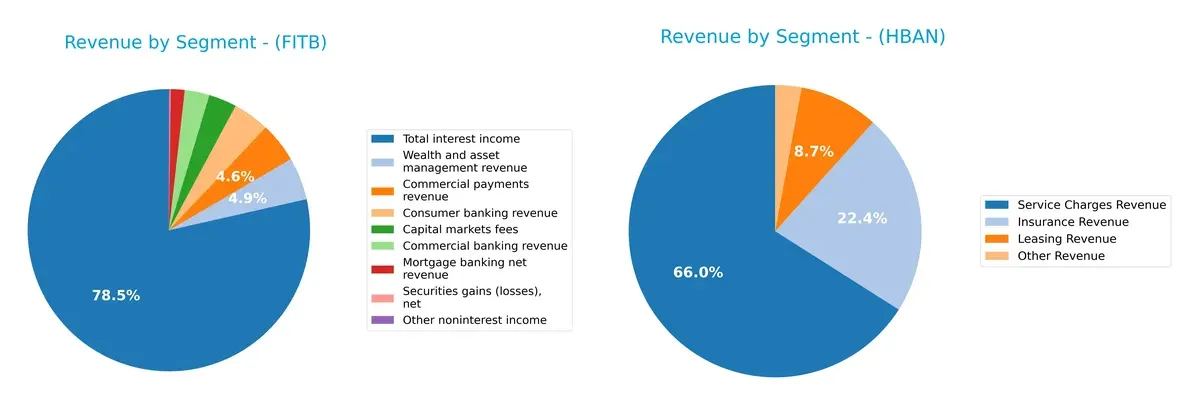
Fifth Third Bancorp heavily anchors its revenue on $10.4B interest income, dwarfing other segments like wealth management at $647M. Huntington Bancshares displays a more balanced mix, with top segments—service charges at $227M and cards/payments at $348M—closely matched by trust and insurance revenues. Fifth Third’s concentration signals reliance on traditional banking interest margins, while Huntington’s diversity mitigates concentration risk and supports ecosystem lock-in.
Strengths and Weaknesses Comparison
This table compares the strengths and weaknesses of Fifth Third Bancorp (FITB) and Huntington Bancshares Incorporated (HBAN):
FITB Strengths
- Higher net margin at 19.61%
- Favorable PE and PB ratios
- Lower debt-to-assets ratio at 6.77%
- Strong fixed asset turnover at 4.14
- Diversified revenue streams including commercial and consumer banking, wealth management, capital markets
HBAN Strengths
- Favorable net margin at 17.71%
- Favorable PE and PB ratios
- Higher fixed asset turnover at 9.45
- Dividend yield slightly higher at 3.57%
- Diverse revenue with cards, payments, insurance, and trust services
FITB Weaknesses
- WACC at 12.33% exceeds ROIC at 8.9%, indicating capital inefficiency
- Current ratio low at 0.82
- Interest coverage below 1 at 0.82
- Asset turnover weak at 0.06
- ROE neutral at 11.61%
HBAN Weaknesses
- Negative ROIC at -1.69%, signaling value destruction
- Very low current and quick ratios at 0.1
- Interest coverage very low at 0.62
- ROE at 9.08% unfavorable
- Higher debt-to-assets ratio at 8.21%
Overall, FITB shows a better balance between profitability and capital efficiency despite some liquidity concerns. HBAN faces significant profitability and liquidity challenges that may impact strategic flexibility. Both companies exhibit varied revenue diversification supporting their market presence.
The Moat Duel: Analyzing Competitive Defensibility
A structural moat is the only thing protecting long-term profits from relentless competition erosion. Let’s dissect how two regional banks defend their turf:
Fifth Third Bancorp: Gradually Strengthening Profitability Amid Value Challenges
Fifth Third’s moat stems from cost advantages and diversified financial services. Its ROIC trails WACC, signaling value destruction, but a rising ROIC trend hints at improving operational efficiency in 2026.
Huntington Bancshares Incorporated: Shrinking Profitability Weakens Competitive Edge
Huntington relies on scale and regional reach but faces a steep ROIC decline below WACC. This signals weakening capital efficiency and a deteriorating moat, unlike Fifth Third’s slowly recovering profitability.
Value Creation vs. Profitability Momentum in Regional Banking
Fifth Third shows a deeper moat with improving ROIC despite current value loss. Huntington’s sharp ROIC drop marks a fading competitive edge. Fifth Third is better positioned to defend market share in 2026’s competitive landscape.
Which stock offers better returns?
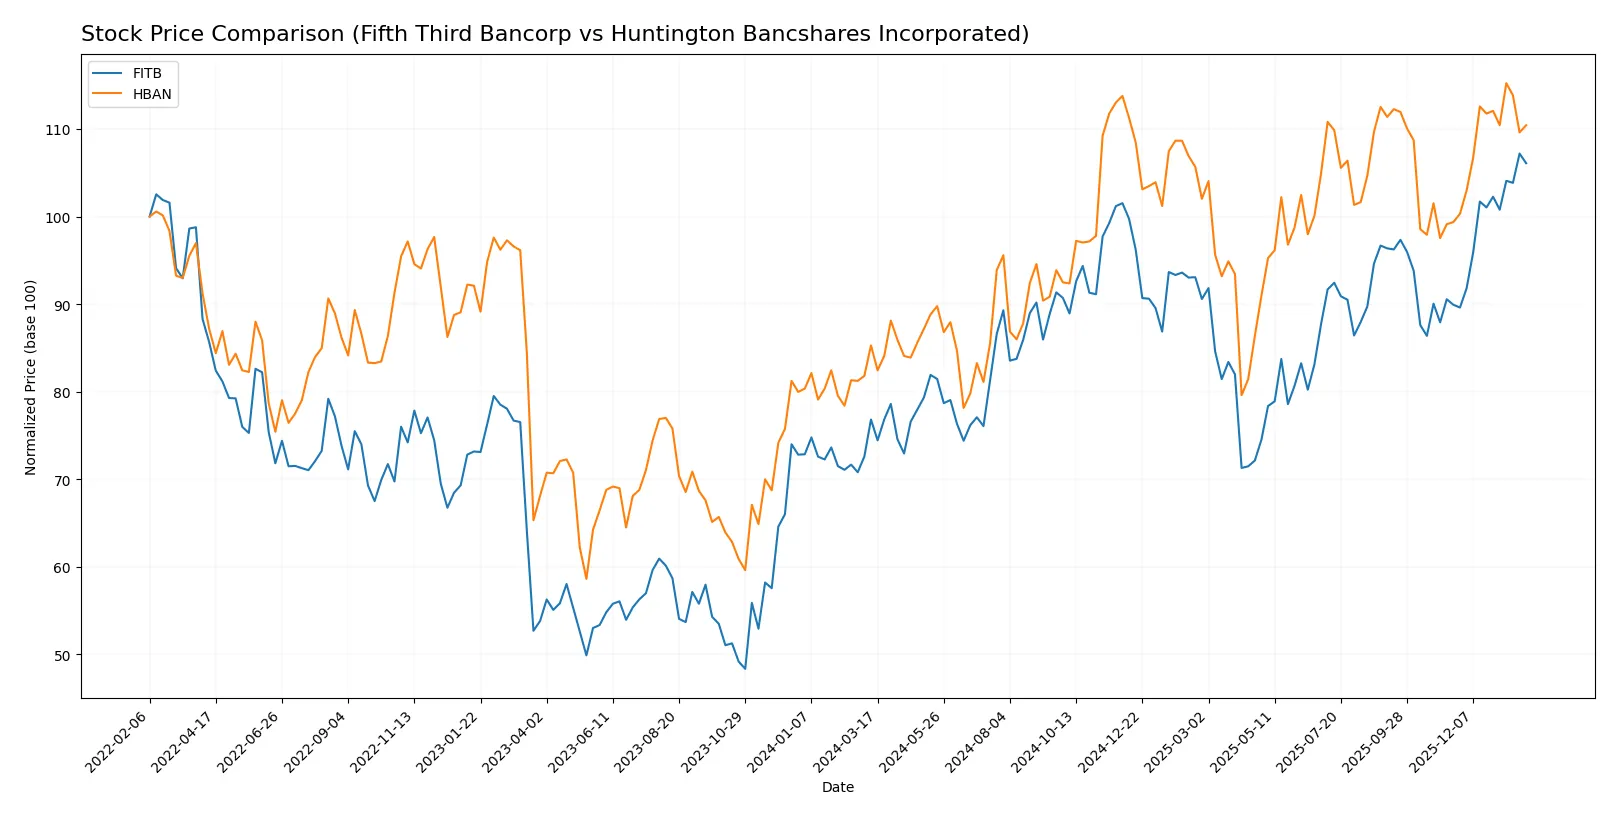
Over the past year, both Fifth Third Bancorp and Huntington Bancshares show strong upward price momentum, with Fifth Third exhibiting a sharper acceleration and wider price range.
Trend Comparison
Fifth Third Bancorp’s stock rose 38.08% over the past 12 months, marking a bullish trend with accelerating momentum and a high volatility of 4.08%. The price peaked at 50.74 and stayed above 33.75.
Huntington Bancshares gained 29.48% over the same period, also bullish with acceleration but lower volatility at 1.59%. Its highest price reached 18.24, with a floor of 12.37.
Fifth Third Bancorp outperformed Huntington Bancshares, delivering the highest market performance with stronger price appreciation and volatility.
Target Prices
Analysts present a clear consensus on price targets for Fifth Third Bancorp and Huntington Bancshares Incorporated.
| Company | Target Low | Target High | Consensus |
|---|---|---|---|
| Fifth Third Bancorp | 50 | 61 | 56.2 |
| Huntington Bancshares | 16 | 23 | 20 |
The consensus target prices suggest moderate upside for both banks versus current prices: FITB trades near its low target, while HBAN sits slightly below consensus. Analyst expectations indicate cautious optimism.

Don’t Let Luck Decide Your Entry Point
Optimize your entry points with our advanced ProRealTime indicators. You’ll get efficient buy signals with precise price targets for maximum performance. Start outperforming now!
How do institutions grade them?
The institutional grades for Fifth Third Bancorp and Huntington Bancshares Incorporated are as follows:
Fifth Third Bancorp Grades
The table below summarizes recent grades from reputable financial institutions for Fifth Third Bancorp.
| Grading Company | Action | New Grade | Date |
|---|---|---|---|
| Truist Securities | Maintain | Buy | 2026-01-26 |
| DA Davidson | Maintain | Buy | 2026-01-26 |
| Citigroup | Maintain | Neutral | 2026-01-23 |
| Keefe, Bruyette & Woods | Maintain | Market Perform | 2026-01-21 |
| RBC Capital | Maintain | Outperform | 2026-01-21 |
| TD Cowen | Maintain | Buy | 2026-01-07 |
| Barclays | Maintain | Overweight | 2026-01-05 |
| Truist Securities | Maintain | Buy | 2025-12-22 |
| Keefe, Bruyette & Woods | Maintain | Market Perform | 2025-12-17 |
| Piper Sandler | Maintain | Overweight | 2025-12-10 |
Huntington Bancshares Incorporated Grades
The table below displays recent institutional grades for Huntington Bancshares Incorporated.
| Grading Company | Action | New Grade | Date |
|---|---|---|---|
| Truist Securities | Maintain | Buy | 2026-01-26 |
| Morgan Stanley | Maintain | Overweight | 2026-01-23 |
| Keefe, Bruyette & Woods | Maintain | Market Perform | 2026-01-23 |
| Barclays | Maintain | Equal Weight | 2026-01-05 |
| RBC Capital | Maintain | Outperform | 2025-12-19 |
| Piper Sandler | Maintain | Underweight | 2025-12-10 |
| DA Davidson | Maintain | Buy | 2025-10-28 |
| Keefe, Bruyette & Woods | Maintain | Market Perform | 2025-10-20 |
| Raymond James | Maintain | Strong Buy | 2025-10-20 |
| TD Cowen | Maintain | Buy | 2025-10-20 |
Which company has the best grades?
Huntington Bancshares holds slightly stronger top-end grades, including a recent “Strong Buy” from Raymond James. Fifth Third Bancorp shows consistent “Buy” and “Outperform” ratings but lacks a “Strong Buy.” Investors may view Huntington’s higher peak ratings as a signal of greater upside potential, while Fifth Third offers steady institutional confidence.
Risks specific to each company
The following categories identify the critical pressure points and systemic threats facing both firms in the 2026 market environment:
1. Market & Competition
Fifth Third Bancorp (FITB)
- Faces intense competition from regional banks and fintech challengers, requiring innovation to maintain market share.
Huntington Bancshares Incorporated (HBAN)
- Competes aggressively in overlapping regions with FITB, with pressure to differentiate via specialized services.
2. Capital Structure & Debt
Fifth Third Bancorp (FITB)
- Debt-to-assets ratio at 6.77% is favorable, but interest coverage below 1 signals risk in meeting debt expenses.
Huntington Bancshares Incorporated (HBAN)
- Slightly higher debt-to-assets at 8.21%, with weaker interest coverage (0.62), indicating vulnerability to rising rates.
3. Stock Volatility
Fifth Third Bancorp (FITB)
- Beta near 0.99 suggests market-neutral volatility, aligning closely with the Nasdaq benchmark.
Huntington Bancshares Incorporated (HBAN)
- Beta of 0.97 also indicates market-level volatility, but average volume spikes heighten trading unpredictability.
4. Regulatory & Legal
Fifth Third Bancorp (FITB)
- Operating in multiple states exposes FITB to diverse regulatory regimes, increasing compliance complexity.
Huntington Bancshares Incorporated (HBAN)
- Similar multi-state footprint, but HBAN’s consumer lending focus heightens scrutiny under evolving consumer protection laws.
5. Supply Chain & Operations
Fifth Third Bancorp (FITB)
- Branch network and ATM operations require robust IT infrastructure; risks lie in cybersecurity and operational disruptions.
Huntington Bancshares Incorporated (HBAN)
- Slightly smaller branch network demands agile operations; vehicle finance segment adds complexity and operational risk.
6. ESG & Climate Transition
Fifth Third Bancorp (FITB)
- ESG initiatives are critical as investors demand transparency; lagging ESG may affect capital costs and reputation.
Huntington Bancshares Incorporated (HBAN)
- Faces pressure to align vehicle finance with climate goals; ESG integration remains a key challenge for sustainable growth.
7. Geopolitical Exposure
Fifth Third Bancorp (FITB)
- Domestic focus limits direct geopolitical risks but macroeconomic shocks can impact credit quality and loan demand.
Huntington Bancshares Incorporated (HBAN)
- Similarly domestic, yet regional economic disparities within operating states could affect portfolio performance unevenly.
Which company shows a better risk-adjusted profile?
Fifth Third Bancorp faces its greatest risk in capital structure, especially interest coverage under pressure. Huntington’s primary concern lies in weak profitability and operational risks in vehicle finance. FITB’s slightly favorable financial ratios and stronger Piotroski score (8 vs. 5) suggest a better risk-adjusted profile. However, both companies reside in the distress zone per Altman Z-scores, flagging bankruptcy risk as a critical caution. Recent data shows Huntington’s negative ROIC (-1.69%) heightens concern about capital efficiency and long-term resilience.
Final Verdict: Which stock to choose?
Fifth Third Bancorp (FITB) impresses with its operational efficiency and growing profitability despite a challenging capital cost environment. Its ability to generate solid returns while maintaining a reasonable valuation stands out. However, a current ratio below 1 signals liquidity constraints, a point of vigilance. FITB suits an Aggressive Growth portfolio willing to tolerate short-term balance sheet risks.
Huntington Bancshares Incorporated (HBAN) offers a strategic moat rooted in a stable asset base and consistent dividend yield. It displays superior safety metrics compared to FITB, though its declining return on invested capital raises concerns about long-term value creation. HBAN fits well in a GARP (Growth at a Reasonable Price) portfolio seeking steadier income and moderate growth.
If you prioritize operational momentum and improving profitability, FITB is the compelling choice due to its accelerating price trend and improving returns. However, if you seek better stability with a conservative risk profile, HBAN offers superior dividend yield and a more stable balance sheet despite its profitability headwinds. Both present analytical scenarios catering to distinct investor profiles.
Disclaimer: Investment carries a risk of loss of initial capital. The past performance is not a reliable indicator of future results. Be sure to understand risks before making an investment decision.
Go Further
I encourage you to read the complete analyses of Fifth Third Bancorp and Huntington Bancshares Incorporated to enhance your investment decisions: