Home > Comparison > Technology > FIS vs WIT
The strategic rivalry between Fidelity National Information Services, Inc. (FIS) and Wipro Limited defines the current trajectory of the global information technology services sector. FIS operates as a capital-intensive technology solutions provider for financial institutions, while Wipro focuses on IT consulting and business process services with a vast employee base. This analysis pits FIS’s scale and vertical integration against Wipro’s diversified service model to identify which offers the superior risk-adjusted outlook for a diversified portfolio.
Table of contents
Companies Overview
Fidelity National Information Services and Wipro represent key pillars in global IT services, each commanding significant market influence.
Fidelity National Information Services, Inc.: Global Fintech Powerhouse
Fidelity National Information Services dominates the financial technology services sector, generating revenue from Merchant, Banking, and Capital Market Solutions. Its Merchant segment leads with enterprise acquiring and e-commerce platforms. In 2026, its strategic focus sharpens on expanding digital payment ecosystems and enhancing risk management technologies. This firm leverages a strong US market position and deep fintech expertise.
Wipro Limited: IT & Consulting Giant
Wipro Limited stands as a global leader in IT services and consulting, with robust offerings in digital strategy, cloud, and infrastructure. It drives revenue across three segments: IT Services, IT Products, and India State Run Enterprise Services. In 2026, Wipro prioritizes cloud adoption, AI integration, and expanding government IT contracts in India. Its scale and diversified client base underpin its competitive advantage.
Strategic Collision: Similarities & Divergences
Both companies thrive in the technology services space but diverge in approach: Fidelity focuses on highly specialized fintech solutions, while Wipro embraces broad IT consulting and infrastructure services. They compete primarily in digital transformation and cloud services, targeting financial institutions and enterprises. Fidelity’s investment profile leans on innovation in payments, whereas Wipro’s hinges on scale and diversified service lines.
Income Statement Comparison
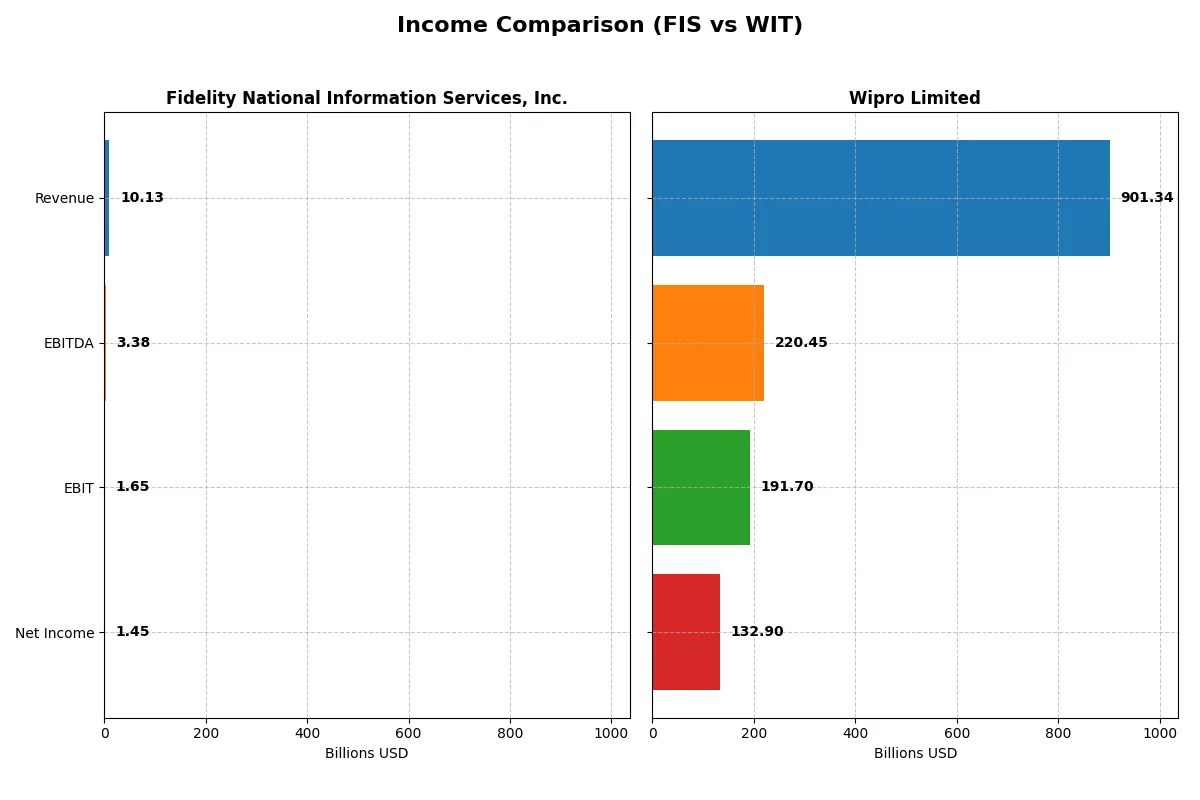
This data dissects the core profitability and scalability of both corporate engines to reveal who dominates the bottom line:
| Metric | Fidelity National Information Services, Inc. (FIS) | Wipro Limited (WIT) |
|---|---|---|
| Revenue | 10.13B | 901.3B INR |
| Cost of Revenue | 6.32B | 625.1B INR |
| Operating Expenses | 2.10B | 122.7B INR |
| Gross Profit | 3.80B | 276.3B INR |
| EBITDA | 3.39B | 220.5B INR |
| EBIT | 1.65B | 191.7B INR |
| Interest Expense | 351M | 14.9B INR |
| Net Income | 1.45B | 132.9B INR |
| EPS | 1.42 | 12.56 |
| Fiscal Year | 2024 | 2025 |
Income Statement Analysis: The Bottom-Line Duel
This income statement comparison reveals which company runs a more efficient and profitable corporate engine in recent years.
Fidelity National Information Services, Inc. Analysis
FIS’s revenue showed mixed trends but grew modestly by 3% in 2024. Its net income surged from negative territory to $1.45B, driven by a strong net margin of 14.3%. Gross margin held steady around 37.6%, while EBIT margin improved significantly to 16.3%, reflecting operational efficiency gains despite rising expenses.
Wipro Limited Analysis
Wipro’s revenue declined slightly by 0.24% in fiscal 2025 but demonstrated solid profitability with a net margin of 14.7%. Gross margin at 30.7% and EBIT margin at 21.3% indicate robust cost control and operational leverage. Net income grew 19.8% year-over-year to ₹133B, supported by effective capital allocation and margin expansion.
Margin Efficiency vs. Revenue Resilience
FIS rebounded impressively from prior losses, showing stronger margin improvement and net income growth. Wipro maintains higher EBIT margin and steadier revenue growth over the period. For investors prioritizing margin efficiency and rapid profit recovery, FIS leads. Those valuing consistent revenue and operational leverage may prefer Wipro’s profile.
Financial Ratios Comparison
These vital ratios act as a diagnostic tool to expose the underlying fiscal health, valuation premiums, and capital efficiency of the companies compared below:
| Ratios | Fidelity National Information Services, Inc. (FIS) | Wipro Limited (WIT) |
|---|---|---|
| ROE | 9.2% | 16.0% |
| ROIC | 4.0% | 10.5% |
| P/E | 30.8 | 20.6 |
| P/B | 2.85 | 3.30 |
| Current Ratio | 0.85 | 2.72 |
| Quick Ratio | 0.85 | 2.71 |
| D/E | 0.74 | 0.23 |
| Debt-to-Assets | 34.2% | 14.9% |
| Interest Coverage | 4.87 | 10.28 |
| Asset Turnover | 0.30 | 0.70 |
| Fixed Asset Turnover | 11.56 | 8.48 |
| Payout ratio | 55.2% | 47.2% |
| Dividend yield | 1.79% | 2.29% |
| Fiscal Year | 2024 | 2025 |
Efficiency & Valuation Duel: The Vital Signs
Financial ratios function as a company’s DNA, exposing hidden risks and operational strengths shaping investment outcomes.
Fidelity National Information Services, Inc.
FIS posts a modest 9.24% ROE against a stretched 30.8 P/E, signaling expensive valuation despite solid 14.32% net margin. The 1.79% dividend yield offers steady shareholder returns, while neutral leverage and weak asset turnover reflect operational inefficiencies that raise caution.
Wipro Limited
Wipro demonstrates robust profitability with 16.04% ROE and favorable 10.49% ROIC, paired with a reasonable 20.6 P/E. Its strong current ratio of 2.72 and low debt support financial health. A 2.29% dividend yield complements growth investments in R&D, revealing a balanced capital allocation strategy.
Premium Valuation vs. Operational Safety
Wipro delivers a superior balance of profitability, valuation, and liquidity compared to FIS’s stretched multiples and weaker returns. Investors prioritizing financial resilience and efficient capital use may find Wipro’s profile more fitting, while FIS’s riskier metrics call for cautious scrutiny.
Which one offers the Superior Shareholder Reward?
I compare Fidelity National Information Services (FIS) and Wipro Limited (WIT) on dividends, payout ratios, and buybacks to identify the superior shareholder reward. FIS offers a 1.79% dividend yield with a 55% payout ratio, supported by strong free cash flow (FCF) coverage, reflecting a sustainable income model. It also pursues moderate buybacks, enhancing total returns. WIT yields 2.29% but pays only 47% of earnings as dividends, preserving cash for growth and buybacks, which are more aggressive relative to its earnings. I observe WIT’s conservative payout and robust buybacks balance income and capital appreciation, ideal in the current growth cycle. I conclude WIT offers a more attractive total return profile in 2026 due to its sustainable dividend reinvestment and intense buyback strategy, outperforming FIS’s steadier but less growth-oriented distribution approach.
Comparative Score Analysis: The Strategic Profile
The radar chart reveals the fundamental DNA and trade-offs of Fidelity National Information Services and Wipro Limited, highlighting their financial strengths and weaknesses:
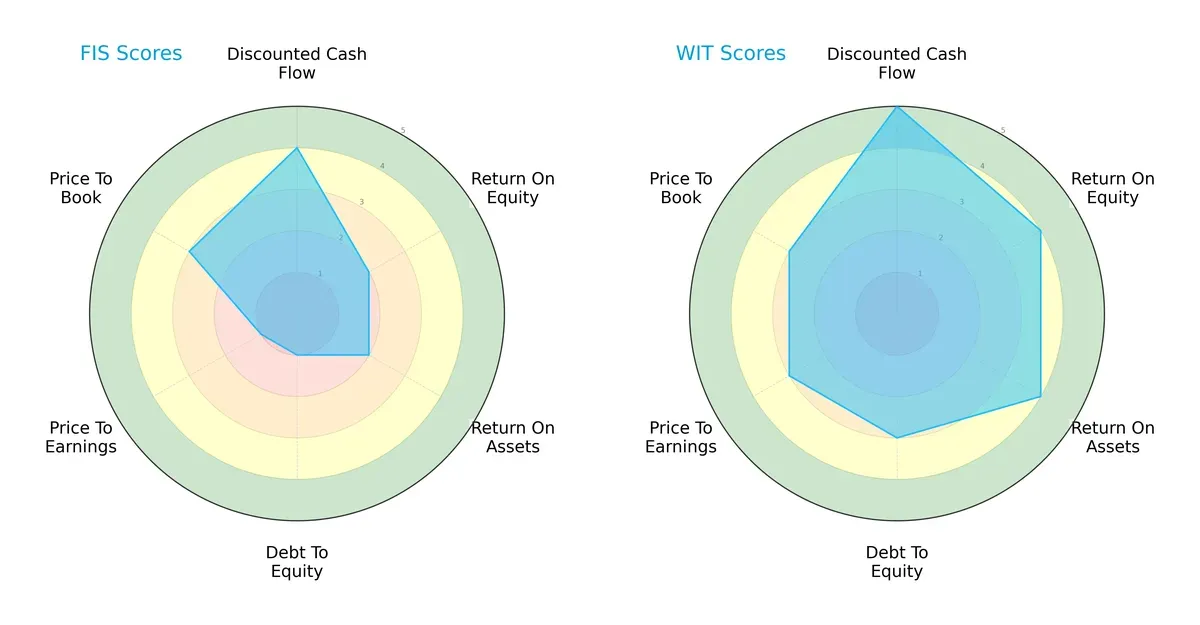
Wipro exhibits a more balanced profile with strong scores in DCF (5), ROE (4), and ROA (4), reflecting efficient asset use and profitability. Fidelity relies on a specific edge in discounted cash flow (4) but struggles with debt-to-equity (1) and valuation metrics (PE 1), indicating financial risk and potential overvaluation.
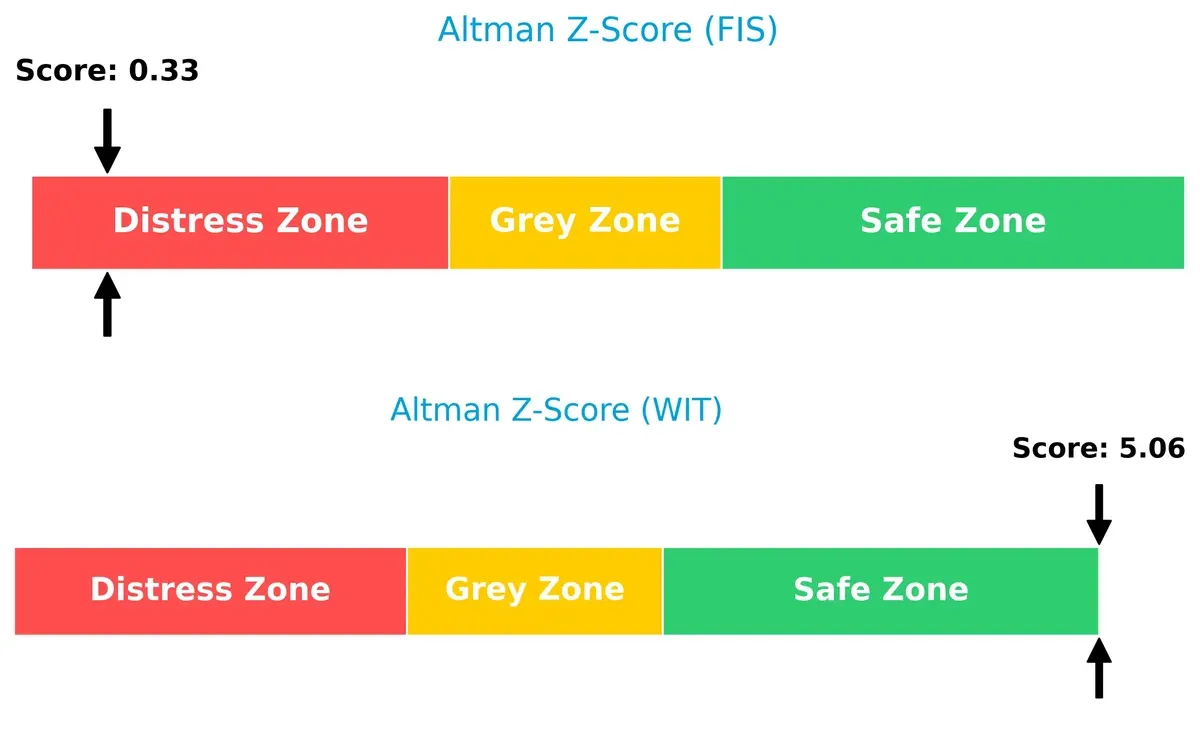
Bankruptcy Risk: Solvency Showdown
The Altman Z-Score gap signals a stark contrast in bankruptcy risk: Wipro’s 5.06 places it safely above distress, while Fidelity’s 0.33 signals acute financial distress risking long-term survival:
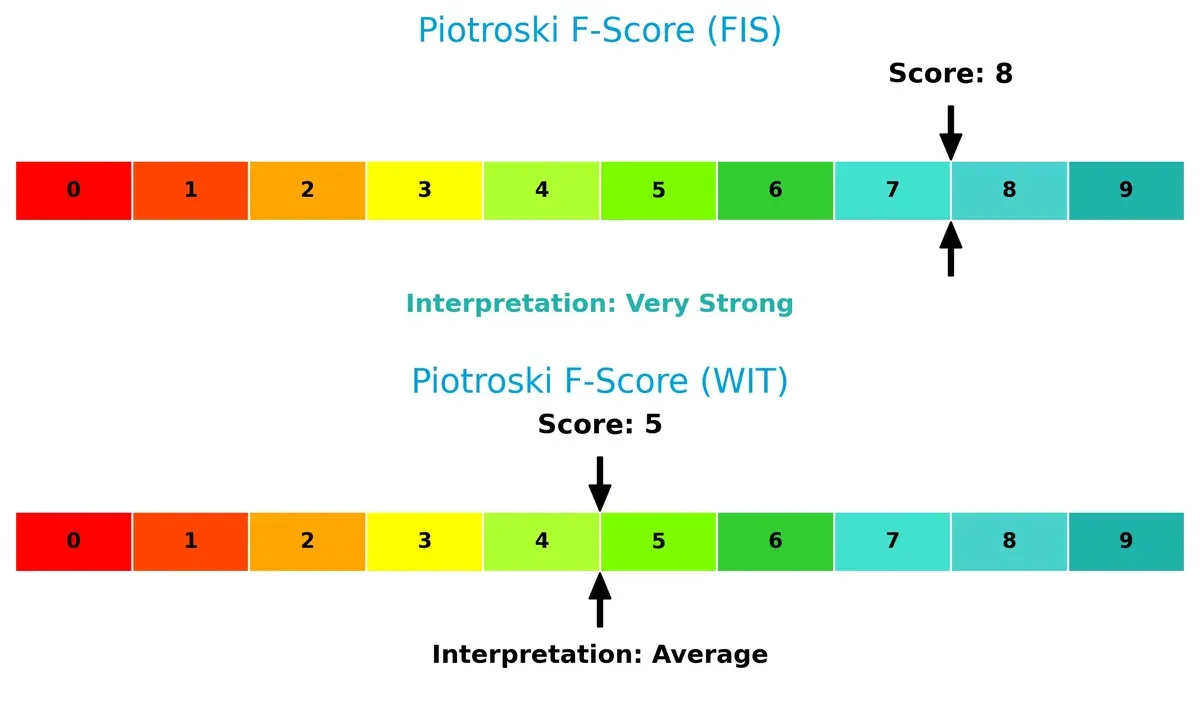
Financial Health: Quality of Operations
Fidelity’s Piotroski F-Score of 8 indicates very strong financial health and robust internal metrics. Wipro’s score of 5 is average, suggesting caution and room for operational improvement:
How are the two companies positioned?
This section dissects FIS and WIT’s operational DNA by comparing their revenue distribution and internal dynamics. The goal is to confront their economic moats to identify which model offers the most resilient, sustainable advantage today.
Revenue Segmentation: The Strategic Mix
The following visual comparison dissects how both firms diversify their income streams and where their primary sector bets lie:
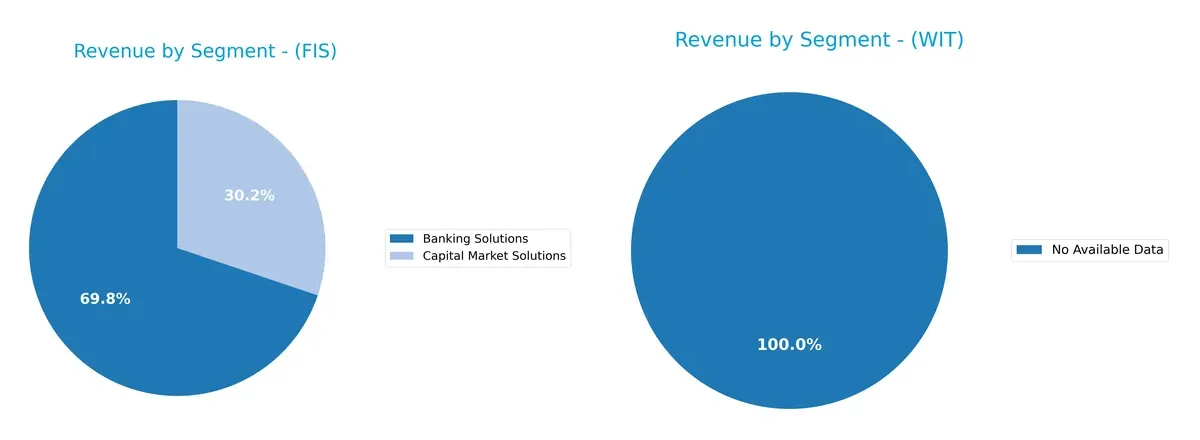
Fidelity National Information Services, Inc. (FIS) anchors its revenue with Banking Solutions at $6.9B in 2024, supplemented by $3B from Capital Market Solutions. This mix shows moderate diversification but leans heavily on banking infrastructure, signaling ecosystem lock-in. Wipro Limited lacks available segmentation data, preventing a direct comparison. FIS’s concentration carries infrastructure dominance benefits but also concentration risk if banking faces disruption.
Strengths and Weaknesses Comparison
This table compares the Strengths and Weaknesses of Fidelity National Information Services, Inc. (FIS) and Wipro Limited (WIT):
FIS Strengths
- Diverse revenue streams from Banking, Capital Market, and Merchant Solutions
- Strong North American presence with $7.85B revenue in 2024
- Favorable net margin at 14.32%
- WACC lower than ROIC signaling cost-efficient capital
- High fixed asset turnover at 11.56
WIT Strengths
- Favorable profitability metrics: net margin 14.74%, ROE 16.04%, ROIC 10.49%
- Strong liquidity with current ratio 2.72 and quick ratio 2.71
- Low leverage: debt-to-assets 14.93% and debt-to-equity 0.23
- High interest coverage ratio of 12.83
- Favorable dividend yield at 2.29%
FIS Weaknesses
- Unfavorable ROE (9.24%) and ROIC (3.99%) below WACC
- Low current ratio at 0.85 signals liquidity risk
- Asset turnover low at 0.3, indicating inefficient use of assets
- PE ratio high at 30.8, may reflect overvaluation
- Neutral to unfavorable debt metrics and interest coverage
WIT Weaknesses
- Unfavorable price-to-book ratio at 3.3 may reflect valuation concerns
- Asset turnover neutral at 0.7, showing moderate efficiency
- Limited disclosed geographic diversification data
- Neutral PE ratio at 20.6
Overall, FIS shows strength in segment diversification and asset utilization but struggles with profitability and liquidity metrics. WIT demonstrates robust profitability, liquidity, and low leverage, though valuation and asset efficiency warrant monitoring. These profiles suggest differing strategic priorities around growth, capital efficiency, and risk management.
The Moat Duel: Analyzing Competitive Defensibility
A structural moat is the only lasting shield protecting long-term profits from relentless competitive erosion. Here’s how these two giants compare:
Fidelity National Information Services, Inc. (FIS): Cost Advantage with Growing Profitability
FIS’s moat stems from scale-driven cost advantages and integrated financial technology platforms. Despite a slightly unfavorable ROIC vs. WACC, its ROIC growth signals improving capital efficiency. New digital banking solutions in 2026 could deepen its moat.
Wipro Limited (WIT): Value Creation Amid Declining ROIC
Wipro’s moat centers on its diversified IT services and consulting expertise, creating value above WACC. However, its declining ROIC trend warns of margin pressures. Expansion into cloud and AI consulting could offset this in 2026.
Scale-Driven Cost Advantage vs. Service Expertise: The Moat Showdown
FIS suffers from value destruction but shows rising profitability momentum. Wipro creates value but faces shrinking returns. I see FIS’s improving ROIC trend as a stronger moat foundation, better positioning it to defend market share long term.
Which stock offers better returns?
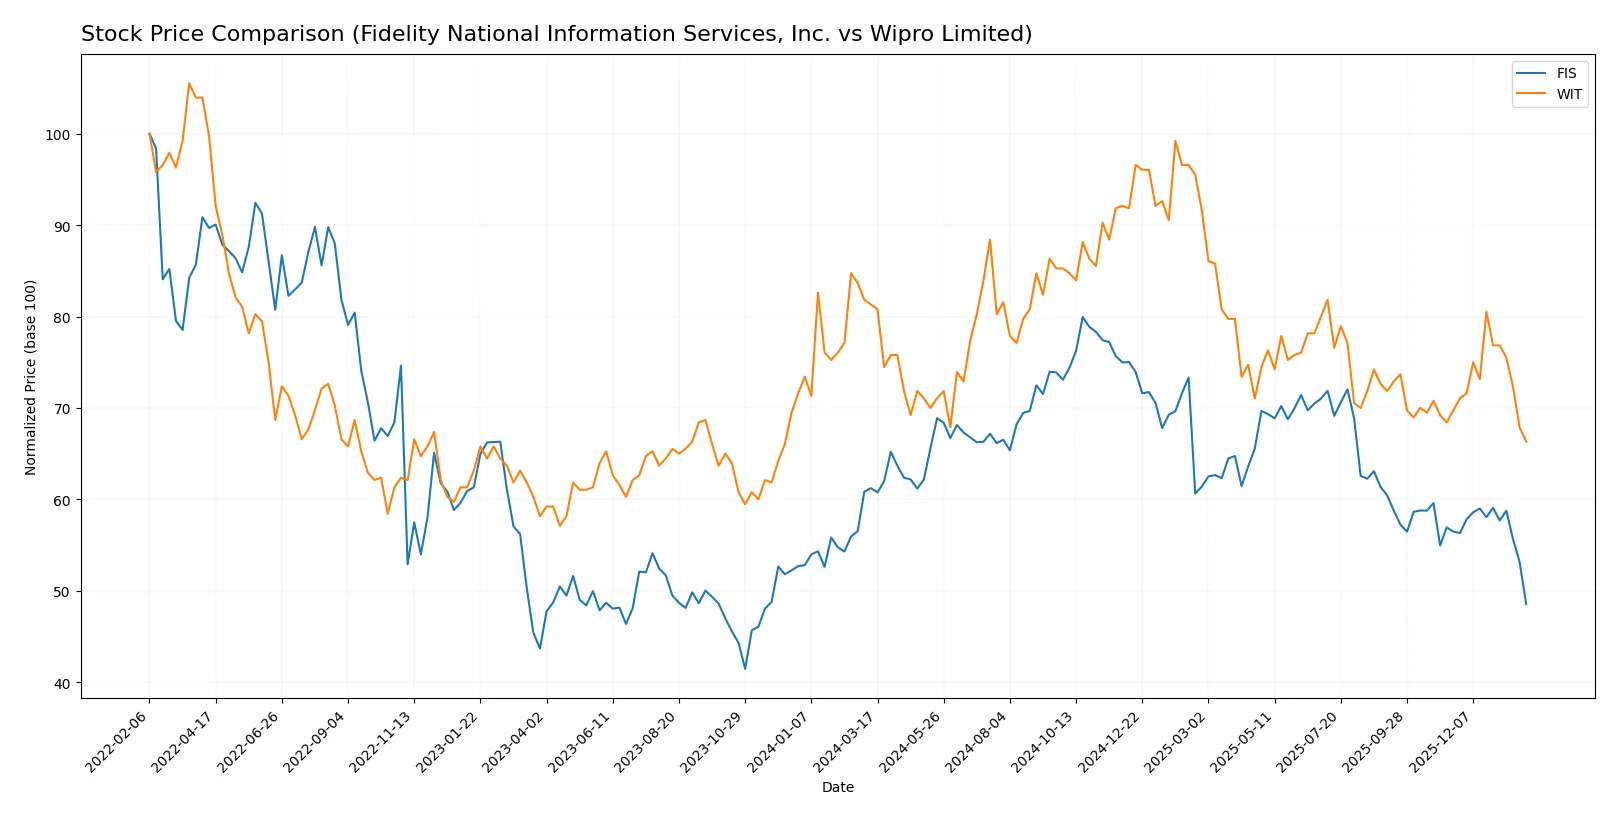
Over the past year, both Fidelity National Information Services, Inc. and Wipro Limited have exhibited bearish price trends, with notable declines and decelerating momentum in their stock performance.
Trend Comparison
Fidelity National Information Services, Inc. stock declined 20.67% over the last 12 months, showing a bearish trend with decelerating losses and a high volatility level (7.34 std deviation). The stock peaked at 90.95 and bottomed at 55.25.
Wipro Limited’s shares fell 18.45% during the same period, also bearish with deceleration. Volatility was low (0.31 std deviation). The highest price reached was 3.77 and the lowest 2.52, reflecting a more stable trading range.
Comparing both, Fidelity’s stock experienced a slightly steeper decline but higher volatility, while Wipro’s trend shows a milder fall with steadier price movement. Fidelity delivered the lower market performance over the year.
Target Prices
Analysts present a cautiously optimistic consensus for Fidelity National Information Services, Inc. and Wipro Limited.
| Company | Target Low | Target High | Consensus |
|---|---|---|---|
| Fidelity National Information Services, Inc. | 69 | 85 | 75.43 |
| Wipro Limited | 7 | 7.7 | 7.35 |
The target consensus for FIS implies a significant upside from its current 55.25 price, reflecting confidence in its technology services. Wipro’s consensus target at 7.35 far exceeds its current 2.52 price, indicating strong expected growth despite recent market volatility.

Don’t Let Luck Decide Your Entry Point
Optimize your entry points with our advanced ProRealTime indicators. You’ll get efficient buy signals with precise price targets for maximum performance. Start outperforming now!
How do institutions grade them?
Fidelity National Information Services, Inc. Grades
The following table summarizes recent institutional grades for Fidelity National Information Services, Inc.:
| Grading Company | Action | New Grade | Date |
|---|---|---|---|
| Truist Securities | Maintain | Hold | 2025-11-19 |
| JP Morgan | Maintain | Overweight | 2025-11-06 |
| RBC Capital | Maintain | Outperform | 2025-11-06 |
| UBS | Maintain | Buy | 2025-11-06 |
| Truist Securities | Maintain | Hold | 2025-10-24 |
| Keefe, Bruyette & Woods | Maintain | Outperform | 2025-10-01 |
| UBS | Upgrade | Buy | 2025-09-30 |
| Keefe, Bruyette & Woods | Maintain | Outperform | 2025-08-06 |
| UBS | Maintain | Neutral | 2025-08-06 |
| Truist Securities | Maintain | Hold | 2025-07-17 |
Wipro Limited Grades
The following table summarizes recent institutional grades for Wipro Limited:
| Grading Company | Action | New Grade | Date |
|---|---|---|---|
| UBS | Upgrade | Neutral | 2025-01-02 |
| Wedbush | Maintain | Underperform | 2024-01-16 |
| JP Morgan | Maintain | Underweight | 2023-05-24 |
| Bernstein | Downgrade | Underperform | 2023-03-22 |
| Bernstein | Downgrade | Underperform | 2023-03-21 |
| Goldman Sachs | Upgrade | Buy | 2022-09-13 |
| Goldman Sachs | Upgrade | Buy | 2022-09-12 |
| Morgan Stanley | Downgrade | Underweight | 2022-07-14 |
| Morgan Stanley | Downgrade | Underweight | 2022-07-13 |
| Macquarie | Upgrade | Outperform | 2022-06-02 |
Which company has the best grades?
Fidelity National Information Services, Inc. consistently receives higher grades, including Buy and Outperform ratings. Wipro Limited’s grades lean toward Neutral and Underperform. This disparity may influence investor confidence and portfolio positioning.
Risks specific to each company
The following categories identify critical pressure points and systemic threats facing Fidelity National Information Services, Inc. (FIS) and Wipro Limited (WIT) in the 2026 market environment:
1. Market & Competition
Fidelity National Information Services, Inc. (FIS)
- Faces intense competition in global IT services with pressure on margins from fintech innovation.
Wipro Limited (WIT)
- Competes in a highly fragmented IT services market with strong presence in India and expansion challenges abroad.
2. Capital Structure & Debt
Fidelity National Information Services, Inc. (FIS)
- Moderate leverage with debt-to-equity at 0.74; interest coverage is acceptable but debt risks remain elevated.
Wipro Limited (WIT)
- Low leverage with debt-to-equity at 0.23; strong interest coverage indicates robust financial stability.
3. Stock Volatility
Fidelity National Information Services, Inc. (FIS)
- Beta near 0.94 indicates moderate sensitivity to market swings; price range volatility is significant.
Wipro Limited (WIT)
- Lower beta at 0.56 shows relative stability; tighter trading range suggests less price fluctuation.
4. Regulatory & Legal
Fidelity National Information Services, Inc. (FIS)
- Subject to stringent US financial regulations impacting banking and capital market solutions.
Wipro Limited (WIT)
- Faces regulatory complexities in India and global data privacy laws, especially in multinational contracts.
5. Supply Chain & Operations
Fidelity National Information Services, Inc. (FIS)
- Relies on technology infrastructure and vendor networks vulnerable to disruptions or cyber threats.
Wipro Limited (WIT)
- Large workforce and diverse service lines increase operational complexity but allow flexibility.
6. ESG & Climate Transition
Fidelity National Information Services, Inc. (FIS)
- Increasing pressure to improve ESG disclosures and reduce carbon footprint in US markets.
Wipro Limited (WIT)
- Proactive ESG initiatives in India, though adaptation to global climate policies remains challenging.
7. Geopolitical Exposure
Fidelity National Information Services, Inc. (FIS)
- US-centric operations sensitive to domestic policy shifts and international trade tensions.
Wipro Limited (WIT)
- Exposure to India’s regulatory environment and global market uncertainties, including US-India relations.
Which company shows a better risk-adjusted profile?
FIS’s key risk is its distressed financial stability, reflected by a low Altman Z-score and unfavorable leverage. Wipro faces moderate operational complexity but maintains strong financial health and low debt. Wipro’s very favorable financial ratios and higher Altman Z-score signal a superior risk-adjusted profile. Recent data highlight FIS’s liquidity weakness and high P/E as caution flags, whereas Wipro’s robust current ratio and interest coverage underscore resilience. Overall, Wipro manages risks more prudently in a volatile 2026 landscape.
Final Verdict: Which stock to choose?
Fidelity National Information Services, Inc. (FIS) boasts a superpower in steadily improving profitability and impressive operational margins despite a challenging market. Its main point of vigilance is its weak liquidity position, which could pressure short-term flexibility. FIS might suit investors targeting aggressive growth with tolerance for financial risks.
Wipro Limited (WIT) commands a strategic moat through strong capital efficiency and solid financial stability, reflected in favorable debt metrics and liquidity ratios. Compared to FIS, WIT appears safer and more reliable, appealing to investors seeking growth balanced with prudent risk management. It fits well in a GARP (Growth at a Reasonable Price) portfolio.
If you prioritize aggressive growth and can weather liquidity headwinds, FIS is the compelling choice due to its rising profitability and operational strength. However, if you seek better financial stability and a more consistent value-creation profile, WIT offers superior balance sheet health and a durable moat, despite its slightly declining profitability trend.
Disclaimer: Investment carries a risk of loss of initial capital. The past performance is not a reliable indicator of future results. Be sure to understand risks before making an investment decision.
Go Further
I encourage you to read the complete analyses of Fidelity National Information Services, Inc. and Wipro Limited to enhance your investment decisions: