Fidelity National Information Services, Inc. (FIS) and Jack Henry & Associates, Inc. (JKHY) are two prominent players in the information technology services sector, specializing in financial technology solutions. Both companies serve banks and financial institutions but differ in scale and innovation strategies, with FIS focusing on global markets and comprehensive solutions, while JKHY targets U.S. community and credit union sectors. This article will help you determine which company is the more compelling investment opportunity in 2026.

Table of contents
Companies Overview
I will begin the comparison between Fidelity National Information Services, Inc. (FIS) and Jack Henry & Associates, Inc. (JKHY) by providing an overview of these two companies and their main differences.
Fidelity National Information Services, Inc. Overview
FIS provides technology solutions globally for merchants, banks, and capital markets firms. Its business segments include Merchant Solutions, Banking Solutions, and Capital Market Solutions, covering services from payment processing to wealth management. Founded in 1968 and headquartered in Jacksonville, Florida, FIS is a major player in information technology services with approximately 50,000 employees.
Jack Henry & Associates, Inc. Overview
JKHY offers technology solutions and payment processing mainly for U.S. financial services organizations. Its operations span four segments: Core, Payments, Complementary, and Corporate. Founded in 1976 and based in Monett, Missouri, JKHY serves banks and credit unions with specialized core processing and digital products, employing around 7,170 people.
Key similarities and differences
Both FIS and JKHY operate in the information technology services sector, focusing on financial institutions with payment processing and core banking solutions. However, FIS has a broader global reach and larger workforce, while JKHY concentrates primarily on the U.S. market with a more specialized product suite. Their business models overlap in banking technology but differ in scale and segment diversification.
Income Statement Comparison
This table presents a side-by-side comparison of key income statement metrics for Fidelity National Information Services, Inc. (FIS) and Jack Henry & Associates, Inc. (JKHY) based on their most recent fiscal year data.
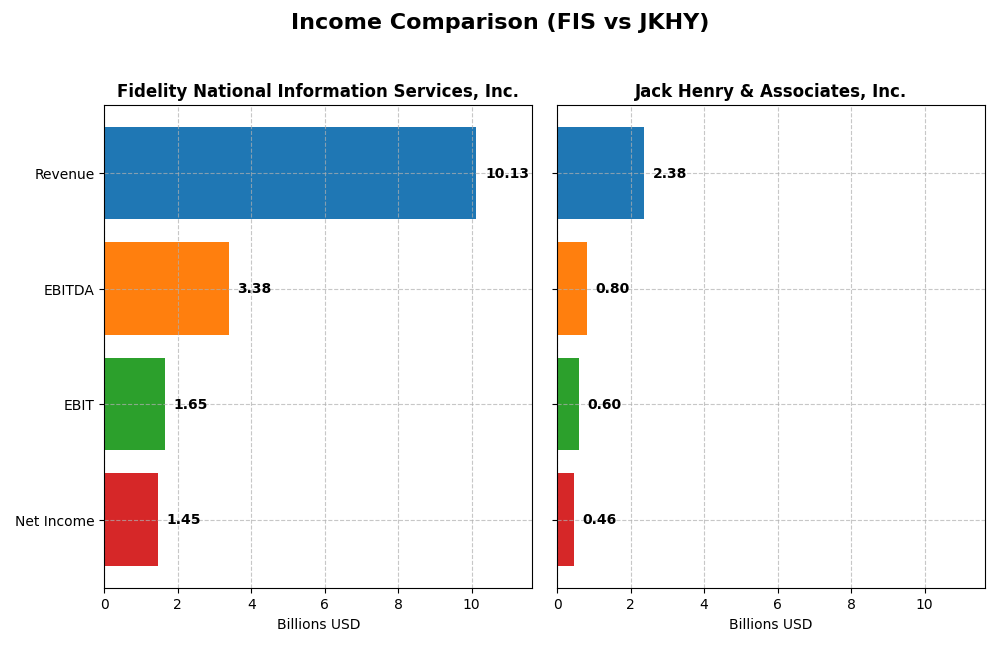
| Metric | Fidelity National Information Services, Inc. (FIS) | Jack Henry & Associates, Inc. (JKHY) |
|---|---|---|
| Market Cap | 33.1B | 14.0B |
| Revenue | 10.13B | 2.38B |
| EBITDA | 3.39B | 801M |
| EBIT | 1.65B | 596M |
| Net Income | 1.45B | 456M |
| EPS | 1.42 | 6.24 |
| Fiscal Year | 2024 | 2025 |
Income Statement Interpretations
Fidelity National Information Services, Inc.
FIS experienced a declining revenue trend over 2020-2024, dropping from $12.55B to $10.13B, while net income showed a dramatic recovery from heavy losses in 2022 and 2023 to a positive $1.45B in 2024. Gross and net margins improved significantly, with net margin reaching 14.3%. The latest year showed revenue growth slowing to 3%, but net income and EPS surged, reflecting margin recovery and expense control.
Jack Henry & Associates, Inc.
JKHY displayed consistent revenue growth from $1.76B in 2021 to $2.38B in 2025, alongside steady net income increases, reaching $456M in 2025. Margins remained strong, with a 42.7% gross margin and 19.2% net margin in the latest year. Recent performance indicates favorable growth in revenue, gross profit, EBIT, and net margin, supported by disciplined operating expenses and improving EPS.
Which one has the stronger fundamentals?
JKHY exhibits stronger fundamentals with robust revenue growth of 35.1% over five years, higher and stable margins, and consistent profitability increases. FIS, despite recent margin recovery and net income turnaround, faces an overall revenue decline and greater volatility due to past heavy losses and discontinued operations. Both show favorable income statement evaluations, but JKHY’s steadier growth and margin profile appear more resilient.
Financial Ratios Comparison
The table below presents a comparison of key financial ratios for Fidelity National Information Services, Inc. (FIS) and Jack Henry & Associates, Inc. (JKHY) based on the most recent fiscal year data available.
| Ratios | Fidelity National Information Services, Inc. (FIS) | Jack Henry & Associates, Inc. (JKHY) |
|---|---|---|
| ROE | 9.24% | 21.39% |
| ROIC | 3.99% | 17.63% |
| P/E | 30.80 | 28.88 |
| P/B | 2.85 | 6.18 |
| Current Ratio | 0.85 | 1.27 |
| Quick Ratio | 0.85 | 1.27 |
| D/E | 0.74 | 0 (no debt) |
| Debt-to-Assets | 34.16% | 0% |
| Interest Coverage | 4.87 | 54.49 |
| Asset Turnover | 0.30 | 0.78 |
| Fixed Asset Turnover | 11.56 | 10.75 |
| Payout Ratio | 55.17% | 36.13% |
| Dividend Yield | 1.79% | 1.25% |
Interpretation of the Ratios
Fidelity National Information Services, Inc. (FIS)
FIS shows mixed financial ratios with some strengths like a favorable net margin of 14.32% and a strong fixed asset turnover of 11.56, counterbalanced by weaker return on equity at 9.24%, return on invested capital at 3.99%, and a low current ratio of 0.85. Dividend yield stands at 1.79%, indicating moderate returns, supported by dividend payments, but concerns arise from slightly unfavorable leverage and valuation metrics, suggesting cautious monitoring of payout sustainability.
Jack Henry & Associates, Inc. (JKHY)
JKHY exhibits primarily favorable ratios including a strong net margin of 19.19%, return on equity of 21.39%, and return on invested capital of 17.63%, alongside a solid interest coverage ratio of 57.14 and zero debt-to-equity, reflecting financial robustness. The dividend yield is 1.25%, with consistent dividend payments and no debt burden, which supports shareholder returns without excessive financial risk, although valuation ratios like price-to-book remain high.
Which one has the best ratios?
Comparing both, JKHY presents a more favorable overall financial profile, with a higher proportion of favorable ratios (64.29%) compared to FIS’s 21.43%. JKHY’s strong profitability, low leverage, and liquidity contrast with FIS’s mixed performance and several unfavorable indicators, suggesting JKHY currently maintains stronger financial health and operational efficiency based on these metrics.
Strategic Positioning
This section compares the strategic positioning of Fidelity National Information Services, Inc. (FIS) and Jack Henry & Associates, Inc. (JKHY) in terms of Market position, Key segments, and Exposure to technological disruption:
FIS
- Large market cap of 33B with global presence, serving merchants, banks, and capital markets.
- Diverse segments: Merchant, Banking, and Capital Market Solutions driving revenue growth.
- Exposure includes digital and fraud risk management but no explicit major disruption noted.
JKHY
- Smaller market cap of 14B, focused primarily on US financial services organizations.
- Concentrated segments: Core, Payments, Complementary, emphasizing banking and credit unions.
- Provides integrated digital and payment solutions with focus on specialized financial services.
FIS vs JKHY Positioning
FIS adopts a diversified global approach across payments, banking, and capital markets, offering broad technology solutions. JKHY concentrates on US financial institutions with specialized core and payment systems. FIS’s scale is larger but JKHY’s niche focus supports stable growth.
Which has the best competitive advantage?
JKHY shows a very favorable MOAT with ROIC consistently above WACC and growing profitability, indicating a durable competitive advantage. FIS has a slightly unfavorable MOAT, shedding value despite improving ROIC trends.
Stock Comparison
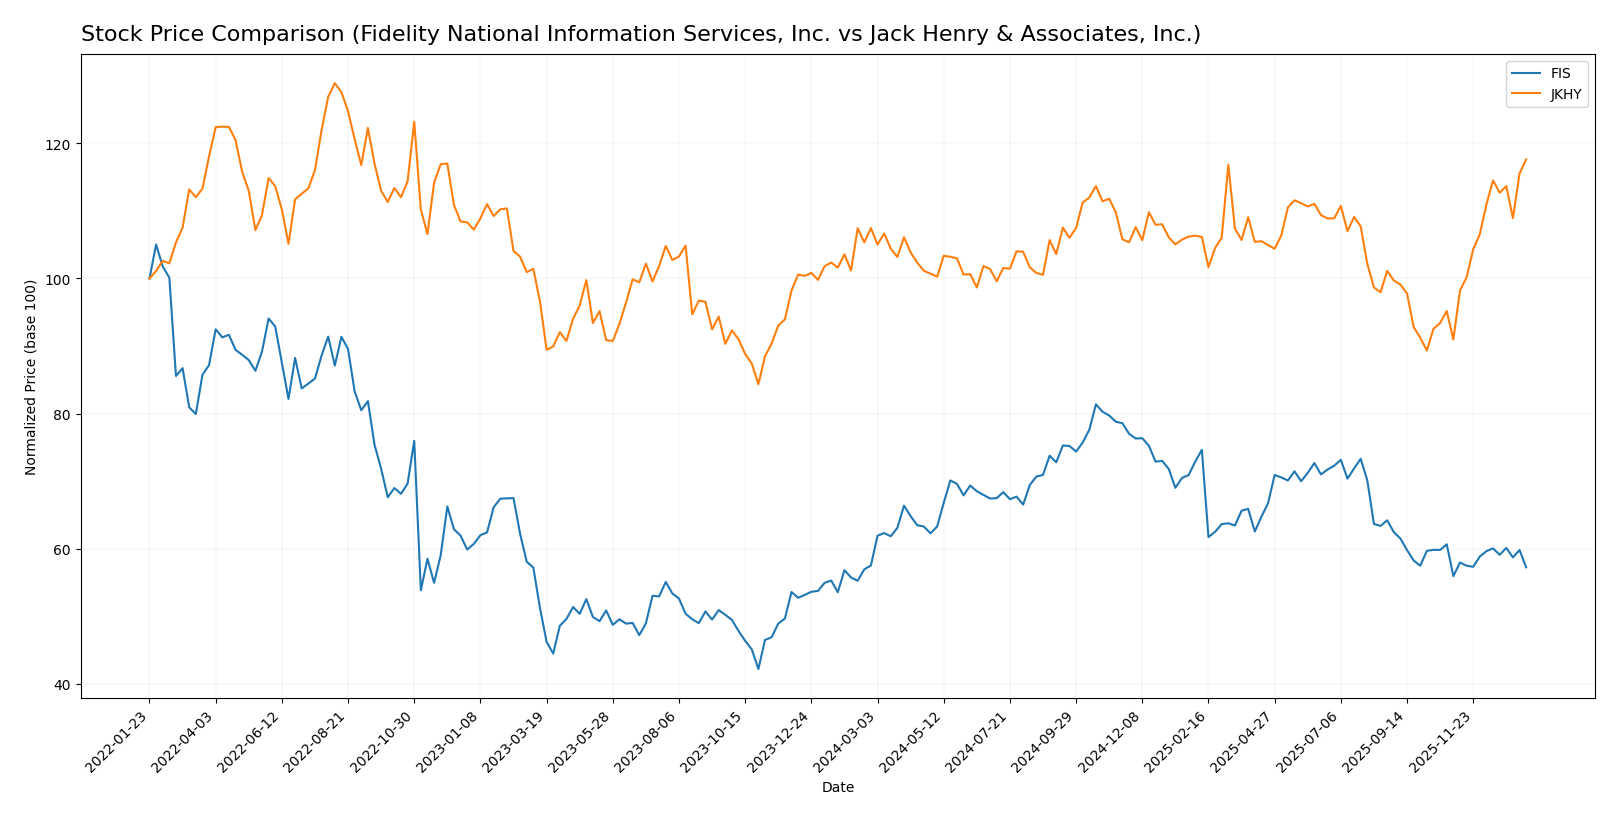
The stock price movements of Fidelity National Information Services, Inc. (FIS) and Jack Henry & Associates, Inc. (JKHY) over the past year reveal distinct trading dynamics, with FIS showing a slight overall decline but recent gains, while JKHY demonstrates strong bullish momentum and accelerating growth.
Trend Analysis
FIS experienced a marginal bearish trend with a -0.47% price change over the past 12 months, showing acceleration despite moderate volatility (7.01 std dev) and recent positive momentum of +2.34% since November 2025.
JKHY displayed a clear bullish trend with a 9.46% price increase over the past year, marked by acceleration and higher volatility (9.15 std dev) alongside a robust recent gain of 29.31% from November 2025.
Comparing both stocks, JKHY has delivered the highest market performance, significantly outperforming FIS in price appreciation and buyer dominance during the recent period.
Target Prices
Analysts provide a confident consensus on target prices for Fidelity National Information Services, Inc. and Jack Henry & Associates, Inc.
| Company | Target High | Target Low | Consensus |
|---|---|---|---|
| Fidelity National Information Services, Inc. | 82 | 69 | 75.5 |
| Jack Henry & Associates, Inc. | 220 | 161 | 196 |
The target consensus suggests upside potential for both stocks compared to current prices: FIS trades at 63.98 versus a 75.5 consensus, and JKHY trades near 192.6 versus a 196 consensus. This indicates moderate bullish expectations.
Analyst Opinions Comparison
This section compares analysts’ ratings and grades for Fidelity National Information Services, Inc. (FIS) and Jack Henry & Associates, Inc. (JKHY):
Rating Comparison
FIS Rating
- Rating: C+ with a “Very Favorable” status, indicating moderate strength.
- Discounted Cash Flow Score: 4, considered “Favorable” for valuation assessment.
- ROE Score: 2, “Moderate” efficiency in generating profit from equity.
- ROA Score: 2 with a “Moderate” status indicating average asset utilization.
- Debt To Equity Score: 1, “Very Unfavorable,” indicating higher financial risk.
- Overall Score: 2, rated as “Moderate” financial standing.
JKHY Rating
- Rating: A- with a “Very Favorable” status, reflecting strong analyst confidence.
- Discounted Cash Flow Score: 4, also “Favorable,” suggesting fair valuation.
- ROE Score: 4, “Favorable,” showing better profit generation efficiency.
- ROA Score: 5, “Very Favorable,” reflecting superior asset use.
- Debt To Equity Score: 4, “Favorable,” indicating lower financial risk.
- Overall Score: 4, rated “Favorable,” indicating stronger overall financials.
Which one is the best rated?
Based strictly on the provided data, JKHY is better rated than FIS. JKHY holds higher scores across ROE, ROA, debt-to-equity, and overall metrics, reflecting stronger financial health and analyst confidence.
Scores Comparison
Here is a comparison of the Altman Z-Score and Piotroski Score for both companies:
FIS Scores
- Altman Z-Score: 0.46, in distress zone indicating a high bankruptcy risk.
- Piotroski Score: 8, considered very strong financial health.
JKHY Scores
- Altman Z-Score: 12.58, in safe zone indicating low bankruptcy risk.
- Piotroski Score: 8, also considered very strong financial health.
Which company has the best scores?
JKHY shows significantly stronger financial stability with a safe zone Altman Z-Score of 12.58 compared to FIS’s distress zone score of 0.46. Both companies share equally strong Piotroski Scores of 8.
Grades Comparison
The following section compares the latest grades from reputable grading companies for Fidelity National Information Services, Inc. and Jack Henry & Associates, Inc.:
Fidelity National Information Services, Inc. Grades
This table shows recent grades assigned by major financial institutions for FIS:
| Grading Company | Action | New Grade | Date |
|---|---|---|---|
| Truist Securities | Maintain | Hold | 2025-11-19 |
| RBC Capital | Maintain | Outperform | 2025-11-06 |
| JP Morgan | Maintain | Overweight | 2025-11-06 |
| UBS | Maintain | Buy | 2025-11-06 |
| Truist Securities | Maintain | Hold | 2025-10-24 |
| Keefe, Bruyette & Woods | Maintain | Outperform | 2025-10-01 |
| UBS | Upgrade | Buy | 2025-09-30 |
| UBS | Maintain | Neutral | 2025-08-06 |
| Keefe, Bruyette & Woods | Maintain | Outperform | 2025-08-06 |
| Truist Securities | Maintain | Hold | 2025-07-17 |
Overall, FIS has consistently maintained positive ratings, predominantly “Buy,” “Outperform,” and “Hold,” with a clear tendency toward bullish sentiment across multiple firms.
Jack Henry & Associates, Inc. Grades
This table presents recent grades from recognized analysts for JKHY:
| Grading Company | Action | New Grade | Date |
|---|---|---|---|
| Wolfe Research | Upgrade | Outperform | 2026-01-08 |
| UBS | Maintain | Neutral | 2026-01-08 |
| RBC Capital | Upgrade | Outperform | 2025-12-16 |
| Baird | Maintain | Neutral | 2025-12-15 |
| Keefe, Bruyette & Woods | Upgrade | Outperform | 2025-12-08 |
| Goldman Sachs | Maintain | Neutral | 2025-11-07 |
| Wells Fargo | Maintain | Equal Weight | 2025-11-06 |
| Compass Point | Upgrade | Buy | 2025-11-06 |
| DA Davidson | Maintain | Buy | 2025-10-29 |
| Goldman Sachs | Maintain | Neutral | 2025-10-13 |
JKHY shows an upward trend with multiple upgrades to “Outperform” and a stable base of “Neutral” ratings, indicating growing confidence among analysts.
Which company has the best grades?
Both companies have a “Buy” consensus, but Fidelity National Information Services, Inc. has a higher number of “Buy” ratings (22) and a “Strong Buy” from one analyst, whereas Jack Henry & Associates, Inc. has fewer “Buy” ratings (11) and no “Strong Buy.” This suggests FIS currently commands slightly stronger analyst support, which could influence investor sentiment and portfolio positioning.
Strengths and Weaknesses
Below is a comparison of key strengths and weaknesses for Fidelity National Information Services, Inc. (FIS) and Jack Henry & Associates, Inc. (JKHY) based on the most recent financial and strategic data.
| Criterion | Fidelity National Information Services, Inc. (FIS) | Jack Henry & Associates, Inc. (JKHY) |
|---|---|---|
| Diversification | Strong product segmentation across Banking, Capital Market, and Merchant Solutions segments, generating multi-billion revenues | Balanced revenue streams from Core, Payments, and Complementary segments with steady growth |
| Profitability | Moderate net margin (14.32%) but unfavorable ROIC (3.99%) below WACC (6.54%), indicating value destruction | High net margin (19.19%) and robust ROIC (17.63%) well above WACC (7.17%), signaling value creation |
| Innovation | Improving ROIC trend (+210%) suggests growing operational efficiency, though overall value destruction persists | Consistent growth in ROIC (+7.97%) with strong financial health supports continued innovation and competitive advantage |
| Global presence | Large global footprint with billions in financial solutions revenue, yet operational efficiency challenges | Strong U.S.-focused presence with solid financials and expanding payments segment, less global but highly efficient |
| Market Share | Significant market share in banking and capital markets, but pressured by operational inefficiencies | Smaller scale but highly profitable niche with strong market position in core financial services and payments |
In summary, JKHY presents a more favorable investment profile with strong profitability, efficient capital use, and a durable competitive advantage. FIS, while diversified and growing in profitability, currently struggles with value destruction and operational efficiency challenges that require cautious consideration.
Risk Analysis
Below is a comparison table highlighting key risk factors for Fidelity National Information Services, Inc. (FIS) and Jack Henry & Associates, Inc. (JKHY) based on the most recent data available from 2025 and 2024.
| Metric | Fidelity National Information Services, Inc. (FIS) | Jack Henry & Associates, Inc. (JKHY) |
|---|---|---|
| Market Risk | Beta 0.94, moderate market sensitivity | Beta 0.73, lower market volatility |
| Debt level | Debt-to-equity 0.74, moderate leverage | Debt-to-equity 0, no debt reported |
| Regulatory Risk | Moderate, financial services tech sector regulated | Moderate, US financial tech compliance |
| Operational Risk | Higher complexity with global operations | Lower complexity, focused US market |
| Environmental Risk | Moderate, typical for IT services | Moderate, IT sector standard |
| Geopolitical Risk | Exposure to global markets, moderate risk | Primarily US-focused, lower risk |
FIS shows higher operational and leverage risks due to its global scale and moderate debt level, with a beta close to 1 indicating average market risk. JKHY benefits from negligible debt and lower market volatility, reducing financial and market risks. The most impactful risks likely stem from FIS’s debt and operational complexity, while JKHY’s focused domestic presence limits its geopolitical exposure. Investors should weigh FIS’s growth potential against its financial leverage and operational challenges.
Which Stock to Choose?
Fidelity National Information Services, Inc. (FIS) shows a favorable income statement with strong net margin growth of 121.15% over one year, yet mixed financial ratios indicate slight unfavorable conditions, including a moderate debt level and below-average returns on equity and invested capital. Its rating is moderate with a C+ grade, and the company appears to be shedding value despite a growing ROIC trend.
Jack Henry & Associates, Inc. (JKHY) presents a consistently favorable income evolution with solid revenue and net income growth, accompanied by strong financial ratios, including a high return on equity of 21.39% and zero debt. Its rating is very favorable with an A- grade, supported by a very favorable moat evaluation indicating efficient capital use and durable competitive advantage.
Considering the ratings and comprehensive financial evaluation, JKHY could be seen as more favorable for investors seeking quality and value creation, whereas FIS might appear suitable for those who may tolerate more risk amid improving profitability metrics. The choice may depend on the investor’s risk tolerance and focus on growth versus stability.
Disclaimer: Investment carries a risk of loss of initial capital. The past performance is not a reliable indicator of future results. Be sure to understand risks before making an investment decision.
Go Further
I encourage you to read the complete analyses of Fidelity National Information Services, Inc. and Jack Henry & Associates, Inc. to enhance your investment decisions: