Home > Comparison > Technology > IBM vs FIS
The strategic rivalry between International Business Machines Corporation (IBM) and Fidelity National Information Services, Inc. (FIS) shapes the evolving Technology sector’s competitive landscape. IBM operates as a diversified, capital-intensive technology services provider with a strong focus on hybrid cloud and AI software. FIS, by contrast, specializes in high-margin financial technology solutions for merchants and banks. This analysis will evaluate which business model delivers a superior risk-adjusted return for a diversified portfolio in today’s dynamic market environment.
Table of contents
Companies Overview
International Business Machines Corporation and Fidelity National Information Services, Inc. stand as pivotal players in the technology services sector.
International Business Machines Corporation: Integrated Technology Solutions Leader
IBM commands the information technology services market with a diversified business model spanning software, consulting, infrastructure, and financing. Its core revenue stems from hybrid cloud platforms, AI-driven software, and enterprise consulting services. In 2026, IBM sharpens its strategic focus on hybrid cloud infrastructure and AI integration to enhance client digital transformation.
Fidelity National Information Services, Inc.: Financial Technology Innovator
FIS drives growth through technology solutions tailored for merchants, banks, and capital markets. Its revenue engine relies on merchant acquiring, banking core processing, and capital market solutions. The company prioritizes expanding digital payment capabilities and risk management tools to capture market share in global financial technology.
Strategic Collision: Similarities & Divergences
IBM and FIS both serve enterprise clients with technology-driven solutions but diverge philosophically: IBM emphasizes a hybrid cloud and AI platform, while FIS focuses on financial technology and payment systems. Their battleground lies in the intersection of cloud services and financial software. IBM offers a broader tech services profile; FIS presents a specialized fintech investment case.
Income Statement Comparison
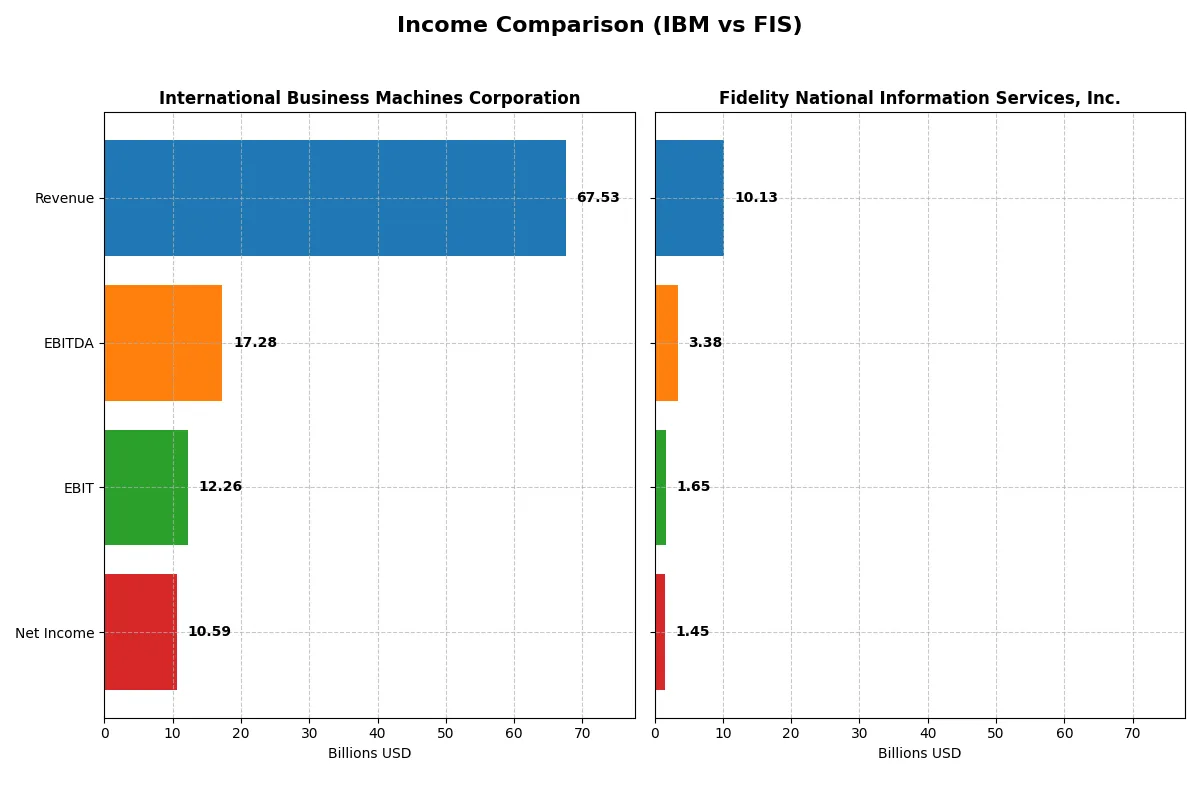
This data dissects the core profitability and scalability of both corporate engines to reveal who dominates the bottom line:
| Metric | International Business Machines Corporation (IBM) | Fidelity National Information Services, Inc. (FIS) |
|---|---|---|
| Revenue | 67.5B | 10.1B |
| Cost of Revenue | 27.4B | 6.3B |
| Operating Expenses | 29.9B | 2.1B |
| Gross Profit | 40.2B | 3.8B |
| EBITDA | 17.3B | 3.4B |
| EBIT | 12.3B | 1.6B |
| Interest Expense | 1.9B | 351M |
| Net Income | 10.6B | 1.5B |
| EPS | 11.36 | 1.42 |
| Fiscal Year | 2025 | 2024 |
Income Statement Analysis: The Bottom-Line Duel
This income statement comparison reveals which company runs a more efficient and profitable corporate engine under current market conditions.
International Business Machines Corporation Analysis
IBM’s revenue steadily grew from 57.4B in 2021 to 67.5B in 2025, showing a 17.8% increase over five years. Net income surged from 5.7B to nearly 10.6B, reflecting strong margin expansion. The 2025 net margin stands at a robust 15.7%, supported by a favorable gross margin near 60%. IBM’s operating income and EPS growth demonstrate significant efficiency gains and momentum.
Fidelity National Information Services, Inc. Analysis
FIS posted a modest revenue growth to 10.1B in 2024, up from 9.8B in 2023 but down from its 13.9B peak in 2021. Net income rebounded sharply to 1.45B in 2024 after a steep loss in 2023, driven by improved net margin of 14.3%. Despite historical revenue volatility, FIS’s recent earnings recovery and margin improvements highlight operational leverage and profit growth potential.
Margin Power vs. Recovery Momentum
IBM delivers consistent revenue growth and superior margin stability, with a net margin advantage over 15%. FIS faces revenue contraction but compensates with a remarkable net income turnaround and margin expansion. IBM’s profile suits investors seeking steady profit growth; FIS appeals to those betting on a strong earnings recovery amid cyclical challenges.
Financial Ratios Comparison
These vital ratios act as a diagnostic tool to expose the underlying fiscal health, valuation premiums, and capital efficiency of the companies compared below:
| Ratios | International Business Machines Corporation (IBM) | Fidelity National Information Services, Inc. (FIS) |
|---|---|---|
| ROE | 22.06% (2024) | 9.24% (2024) |
| ROIC | 9.17% (2024) | 3.99% (2024) |
| P/E | 34.21 (2024) | 30.80 (2024) |
| P/B | 7.54 (2024) | 2.85 (2024) |
| Current Ratio | 1.04 (2024) | 0.85 (2024) |
| Quick Ratio | 1.00 (2024) | 0.85 (2024) |
| D/E | 2.14 (2024) | 0.74 (2024) |
| Debt-to-Assets | 42.57% (2024) | 34.16% (2024) |
| Interest Coverage | 5.88 (2024) | 4.87 (2024) |
| Asset Turnover | 0.46 (2024) | 0.30 (2024) |
| Fixed Asset Turnover | 7.03 (2024) | 11.56 (2024) |
| Payout ratio | 102.06% (2024) | 55.17% (2024) |
| Dividend yield | 2.98% (2024) | 1.79% (2024) |
| Fiscal Year | 2024 | 2024 |
Efficiency & Valuation Duel: The Vital Signs
Financial ratios act as a company’s DNA, exposing hidden risks and revealing operational excellence behind market valuations.
International Business Machines Corporation
IBM shows mixed profitability with a strong net margin of 15.69% but lacks return on equity and invested capital, signaling inefficiency. Its P/E of 26.07 suggests a stretched valuation relative to earnings. IBM supports shareholders with a 2.27% dividend yield, reflecting stable returns amid reinvestment for growth.
Fidelity National Information Services, Inc.
FIS posts a solid 14.32% net margin but modest 9.24% ROE and 3.99% ROIC indicate limited capital efficiency. The stock trades at a higher P/E of 30.8, signaling premium pricing. Dividend yield of 1.79% is lower, with reinvestment likely focused on operational improvements and future expansion.
Premium Valuation vs. Operational Safety
IBM offers a better margin and dividend cushion but struggles with capital returns, while FIS trades at a higher valuation with moderate efficiency. IBM suits income-focused investors, whereas FIS appeals to those prioritizing growth potential despite valuation risk.
Which one offers the Superior Shareholder Reward?
I compare IBM and FIS on dividends, payout ratios, and buybacks. IBM yields 2.27–4.9% with a high payout near 59–102%, supported by strong free cash flow coverage above 1.7x, indicating sustainable dividends. IBM also executes significant share buybacks, boosting shareholder returns. FIS yields 0.99–3.5% with a lower payout ratio around 55%, also covered comfortably by free cash flow. However, FIS’s dividend history includes losses and negative net margins, signaling risk. Its buyback program is less intensive than IBM’s. I see IBM’s balanced high yield, solid FCF coverage, and aggressive buybacks as a more sustainable and rewarding model in 2026. Investors seeking superior total returns should favor IBM.
Comparative Score Analysis: The Strategic Profile
The radar chart reveals the fundamental DNA and trade-offs of both firms, highlighting their operational strengths and valuation challenges:
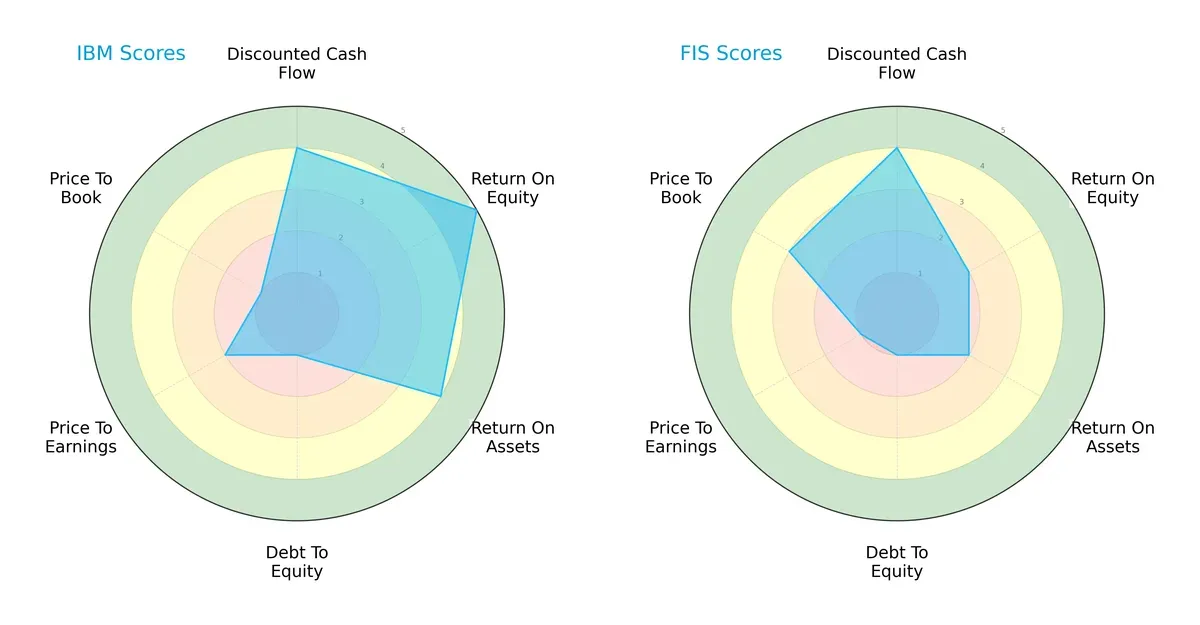
IBM showcases a well-rounded profile with strong profitability metrics—ROE at 5 and ROA at 4—indicating efficient asset use and shareholder returns. FIS, while matching IBM on discounted cash flow with a 4, lags in profitability (ROE and ROA both 2). Both firms suffer from weak debt management (score 1), but FIS fares slightly better on price-to-book valuation (3 vs. IBM’s 1). IBM relies on operational efficiency, while FIS appears more dependent on valuation arbitrage.
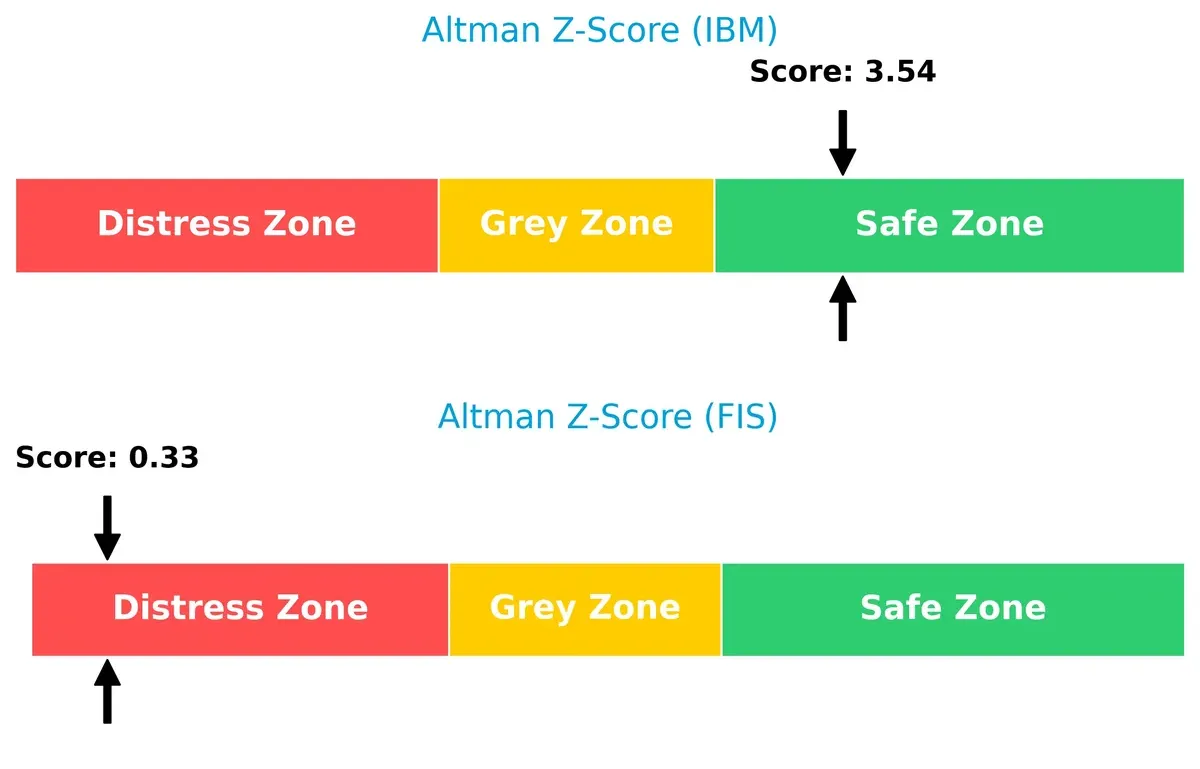
Bankruptcy Risk: Solvency Showdown
IBM’s Altman Z-Score of 3.54 places it firmly in the safe zone, signaling robust long-term solvency and low bankruptcy risk in this cycle. FIS, at 0.33, sits deep in the distress zone, indicating a high risk of financial distress:
Financial Health: Quality of Operations
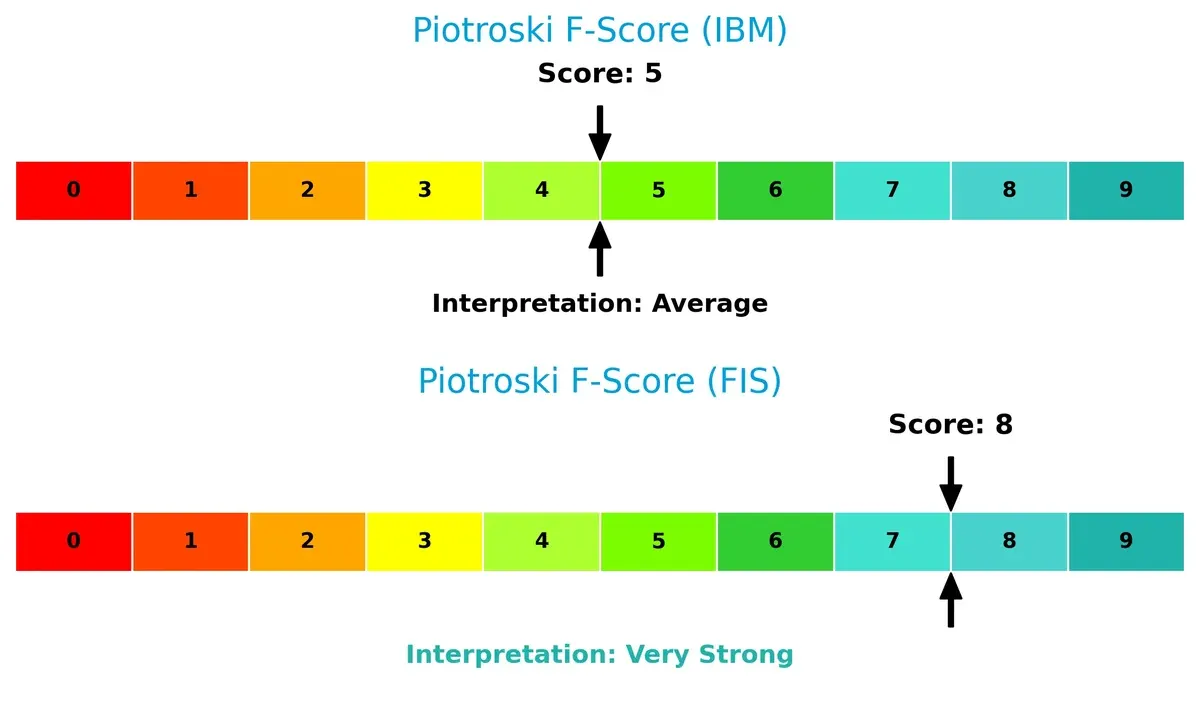
FIS scores an impressive 8 on the Piotroski F-Score, signaling very strong internal financial health and operational quality. IBM’s score of 5 is only average, suggesting some red flags or weaker execution compared to FIS:
How are the two companies positioned?
This section dissects IBM and FIS’s operational DNA by comparing their revenue distribution and internal dynamics. The goal is to confront their economic moats and identify which model offers the most resilient competitive advantage today.
Revenue Segmentation: The Strategic Mix
This visual comparison dissects how International Business Machines Corporation and Fidelity National Information Services, Inc. diversify their income streams and where their primary sector bets lie:
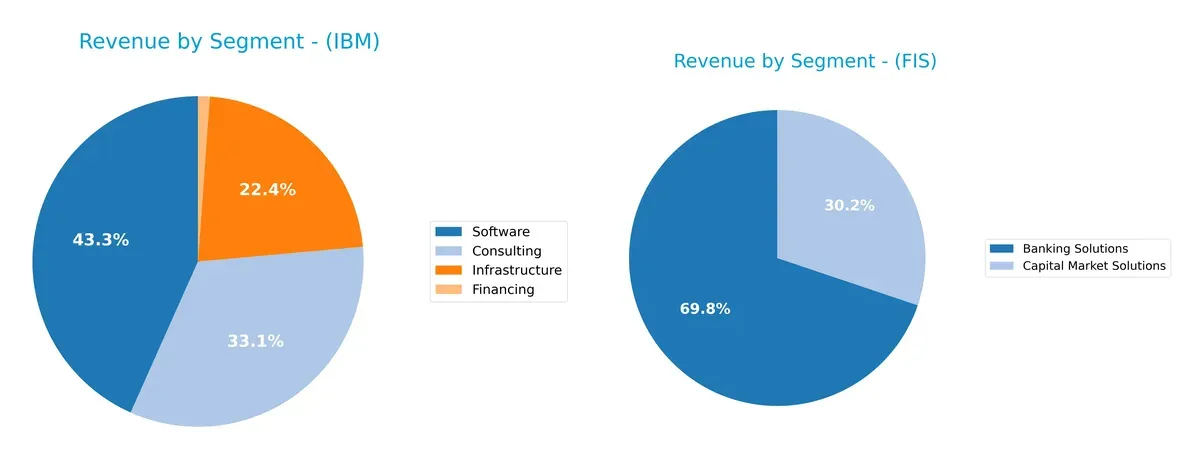
IBM shows a highly diversified revenue mix with Software at $27B, Consulting $21B, and Infrastructure $14B in 2024. FIS leans heavily on Banking Solutions at $6.9B and Capital Market Solutions at $3B, revealing a more concentrated model. IBM’s broad portfolio supports ecosystem lock-in and risk mitigation, while FIS’s focus on financial services signals infrastructure dominance but higher concentration risk.
Strengths and Weaknesses Comparison
This table compares the Strengths and Weaknesses of IBM and FIS based on diversification, profitability, financials, innovation, global presence, and market share:
IBM Strengths
- Diversified revenue streams across Software, Consulting, Infrastructure, and Financing
- Strong net margin at 15.69%
- Favorable debt-to-equity and debt-to-assets ratios
- Solid interest coverage ratio at 6.34
- Dividend yield of 2.27% supports shareholder returns
- Global presence with significant revenues in Americas, EMEA, and Asia Pacific
FIS Strengths
- Focused product segments with Banking and Capital Market Solutions
- Favorable weighted average cost of capital (6.42%) supports capital allocation
- Strong fixed asset turnover at 11.56 signals operational efficiency
- Neutral debt ratios indicate balanced leverage
- Global reach mainly in North America with Non-North America exposure
IBM Weaknesses
- Unfavorable return on equity (0%) and return on invested capital (0%) raise profitability concerns
- Unavailable WACC limits cost of capital analysis
- Unfavorable liquidity ratios (current and quick ratios at 0) present red flags
- High price-to-earnings ratio (26.07) may indicate overvaluation
- Asset turnover and fixed asset turnover ratios are unfavorable
- Overall slightly unfavorable global ratios at 42.86% favorable vs. 50% unfavorable
FIS Weaknesses
- Lower net margin at 14.32% compared to IBM
- Unfavorable ROE (9.24%) and ROIC (3.99%) below typical benchmarks
- Price-to-earnings ratio high at 30.8, suggesting valuation risk
- Current ratio below 1 (0.85) implies liquidity constraints
- Neutral interest coverage at 4.7 could pressure debt servicing
- Overall slightly unfavorable global ratios with 21.43% favorable and 35.71% unfavorable
IBM’s strength lies in its diversified revenue base and strong balance sheet metrics. FIS shows operational efficiency but faces challenges in profitability and liquidity. Both companies exhibit valuation risks and moderate global presence differences, which may influence their strategic focus going forward.
The Moat Duel: Analyzing Competitive Defensibility
A structural moat is the only reliable shield protecting long-term profits from relentless competitive erosion. Let’s dissect the moats of two tech giants:
International Business Machines Corporation: Intangible Assets and Hybrid Cloud Dominance
IBM’s moat rests on its intangible assets—especially proprietary hybrid cloud software and AI platforms like Red Hat. This drives stable 18% EBIT margins and robust profit growth. In 2026, expanding AI-driven automation could deepen this edge, though legacy infrastructure risks persist.
Fidelity National Information Services, Inc.: Scale and Network Effects in Fintech
FIS leverages network effects and scale in payment processing and banking solutions, fueling a growing ROIC trend despite current value destruction. Its narrower 16% EBIT margin contrasts IBM’s but improving profitability and digital innovation signal potential for market disruption and expansion.
Intangible Assets vs. Network Effects: Which Moat Holds Stronger?
IBM’s deep intangible asset base offers a wider moat with proven margin stability and profit growth. FIS shows a promising ROIC rebound but remains slightly value destructive. IBM is better positioned to defend and grow its market share long-term.
Which stock offers better returns?
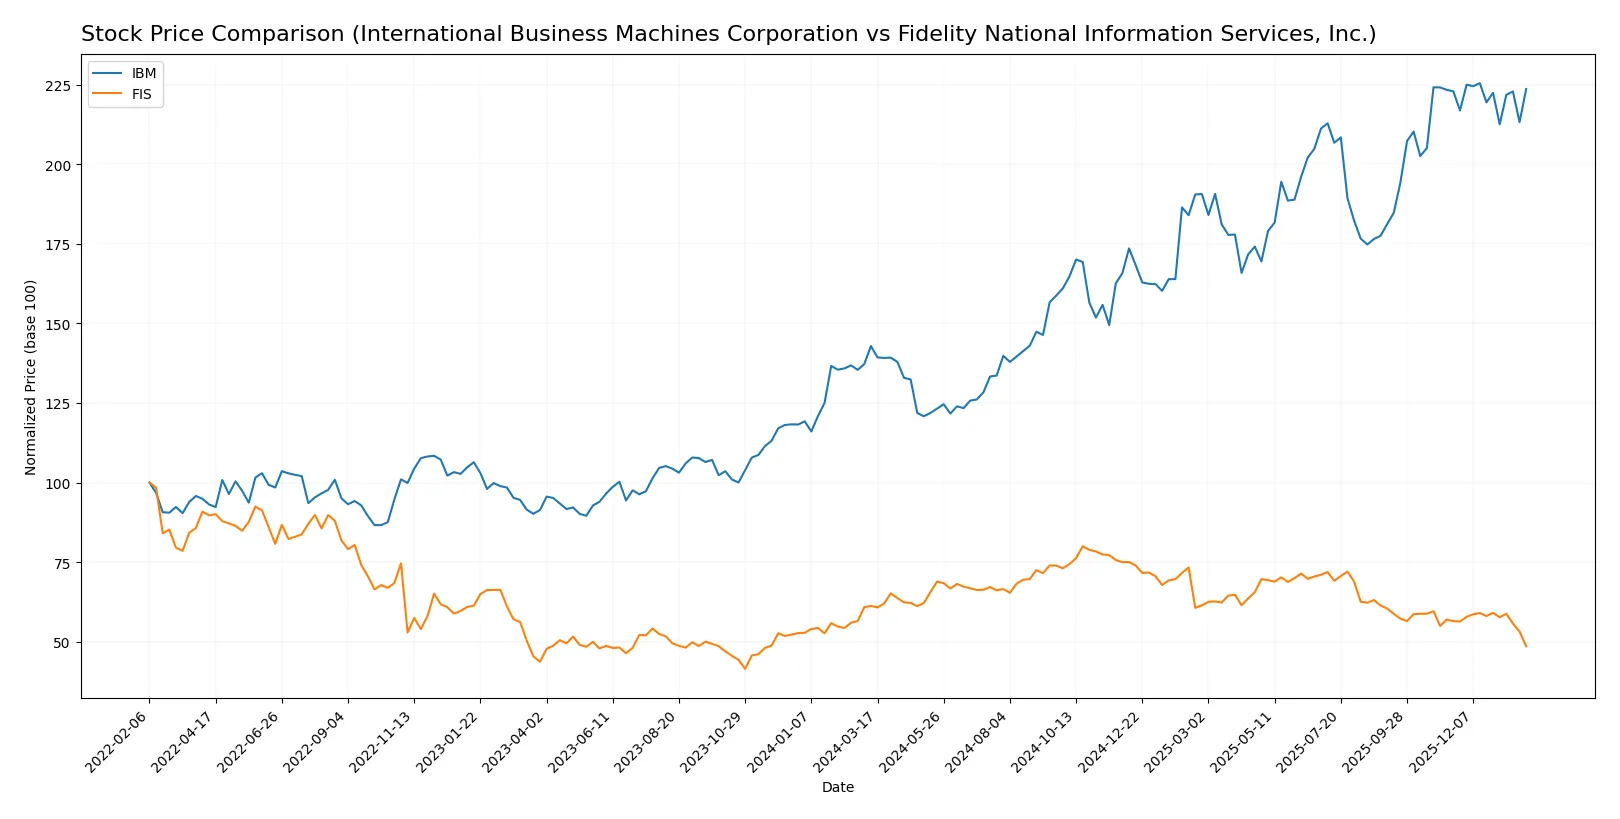
Over the past year, IBM’s stock surged sharply by 56.5% despite decelerating momentum, while FIS experienced a notable 20.7% decline with slowing downside pressure.
Trend Comparison
IBM’s stock gained 56.5% over the past 12 months, showing a bullish trend with decelerating acceleration and high volatility. It peaked at 309.24 and bottomed at 165.71.
FIS’s stock fell 20.7% over the same period, reflecting a bearish trend with decelerating decline and moderate volatility. Its highest price was 90.95, lowest 55.25.
IBM outperformed FIS with a strong bullish trend versus FIS’s bearish slide, delivering the highest market performance in the past year.
Target Prices
Analysts present a bullish consensus for IBM and FIS with target prices comfortably above current levels.
| Company | Target Low | Target High | Consensus |
|---|---|---|---|
| International Business Machines Corporation | 304 | 380 | 349.5 |
| Fidelity National Information Services, Inc. | 69 | 85 | 75.43 |
IBM’s target consensus at 349.5 exceeds its current 306.7 price, signaling upside potential. FIS shows even greater relative upside, with a consensus target of 75.43 versus its 55.25 price.

Don’t Let Luck Decide Your Entry Point
Optimize your entry points with our advanced ProRealTime indicators. You’ll get efficient buy signals with precise price targets for maximum performance. Start outperforming now!
How do institutions grade them?
International Business Machines Corporation Grades
Here are the latest institutional grades for International Business Machines Corporation:
| Grading Company | Action | New Grade | Date |
|---|---|---|---|
| Wedbush | Maintain | Outperform | 2026-01-29 |
| RBC Capital | Maintain | Outperform | 2026-01-29 |
| Stifel | Maintain | Buy | 2026-01-29 |
| JP Morgan | Maintain | Neutral | 2026-01-29 |
| UBS | Maintain | Sell | 2026-01-29 |
| Evercore ISI Group | Maintain | Outperform | 2026-01-29 |
| Jefferies | Maintain | Buy | 2026-01-29 |
| JP Morgan | Maintain | Neutral | 2026-01-21 |
| Evercore ISI Group | Maintain | Outperform | 2026-01-20 |
| B of A Securities | Maintain | Buy | 2026-01-13 |
Fidelity National Information Services, Inc. Grades
Below are the recent institutional grades for Fidelity National Information Services, Inc.:
| Grading Company | Action | New Grade | Date |
|---|---|---|---|
| Truist Securities | Maintain | Hold | 2025-11-19 |
| JP Morgan | Maintain | Overweight | 2025-11-06 |
| RBC Capital | Maintain | Outperform | 2025-11-06 |
| UBS | Maintain | Buy | 2025-11-06 |
| Truist Securities | Maintain | Hold | 2025-10-24 |
| Keefe, Bruyette & Woods | Maintain | Outperform | 2025-10-01 |
| UBS | Upgrade | Buy | 2025-09-30 |
| Keefe, Bruyette & Woods | Maintain | Outperform | 2025-08-06 |
| UBS | Maintain | Neutral | 2025-08-06 |
| Truist Securities | Maintain | Hold | 2025-07-17 |
Which company has the best grades?
International Business Machines Corporation shows a mix of Outperform and Buy ratings, with some Neutral and one Sell from UBS. Fidelity National Information Services, Inc. mostly holds Outperform, Buy, and Overweight grades, but also includes multiple Hold ratings. IBM’s higher concentration of Outperform and Buy grades may signal stronger institutional confidence compared to FIS, potentially influencing investor sentiment more positively.
Risks specific to each company
The following categories identify critical pressure points and systemic threats facing International Business Machines Corporation (IBM) and Fidelity National Information Services, Inc. (FIS) in the 2026 market environment:
1. Market & Competition
International Business Machines Corporation
- Faces intense competition in hybrid cloud and AI software markets, requiring continuous innovation to maintain leadership.
Fidelity National Information Services, Inc.
- Competes in fintech with pressure from emerging digital payment platforms and evolving banking technology demands.
2. Capital Structure & Debt
International Business Machines Corporation
- Shows a favorable debt-to-equity profile with strong interest coverage, signaling solid financial stability.
Fidelity National Information Services, Inc.
- Exhibits moderate leverage with a debt-to-equity ratio of 0.74 and neutral interest coverage, implying moderate financial risk.
3. Stock Volatility
International Business Machines Corporation
- Demonstrates low beta (0.698), indicating less sensitivity to market swings and lower stock volatility.
Fidelity National Information Services, Inc.
- Has a higher beta (0.939), closer to market volatility, exposing shareholders to greater price fluctuations.
4. Regulatory & Legal
International Business Machines Corporation
- Operates in heavily regulated sectors such as data security and cloud services, facing ongoing compliance costs.
Fidelity National Information Services, Inc.
- Faces regulatory scrutiny in financial services technology, including data privacy and anti-fraud regulations.
5. Supply Chain & Operations
International Business Machines Corporation
- Relies on complex global supply chains for hardware components, vulnerable to disruptions and cost inflation.
Fidelity National Information Services, Inc.
- Depends on stable IT infrastructure and vendor networks; operational risks include service outages and integration challenges.
6. ESG & Climate Transition
International Business Machines Corporation
- Invests in sustainable data centers and green technologies, but faces pressure to meet aggressive ESG targets.
Fidelity National Information Services, Inc.
- Works on embedding ESG principles in fintech solutions; however, climate transition risks remain less material but increasing.
7. Geopolitical Exposure
International Business Machines Corporation
- Has significant international operations; geopolitical tensions could disrupt global contracts and supply chains.
Fidelity National Information Services, Inc.
- Primarily US-focused but increasingly exposed to global markets, facing risks from trade policies and regulatory divergence.
Which company shows a better risk-adjusted profile?
IBM’s strongest risk lies in market competition due to rapid innovation demands in hybrid cloud and AI. FIS’s major concern is its precarious financial health, indicated by a distress-zone Altman Z-score, despite a strong Piotroski score. IBM’s lower stock volatility and superior interest coverage suggest a better risk-adjusted profile. Notably, IBM’s Altman Z-score of 3.54 places it safely away from bankruptcy risk, whereas FIS’s 0.33 warns of financial distress, underscoring my caution for FIS’s credit risk.
Final Verdict: Which stock to choose?
International Business Machines Corporation (IBM) stands out with its robust income growth and consistent cash generation, showcasing a superpower in operational efficiency and improving profitability. Its point of vigilance lies in a declining ROIC trend, signaling caution on capital allocation. IBM fits well in an Aggressive Growth portfolio seeking turnaround potential.
Fidelity National Information Services, Inc. (FIS) leverages a strategic moat rooted in its specialized financial services platform, offering recurring revenue and digital payment solutions. While its value creation is currently under pressure, its improving ROIC trend suggests a path toward enhanced profitability. FIS provides a safer profile relative to IBM, suitable for a GARP (Growth at a Reasonable Price) strategy.
If you prioritize dynamic operational improvements and income growth, IBM is the compelling choice due to its strong income statement momentum and bullish stock trend. However, if you seek strategic resilience with improving capital efficiency and a more defensive stance, FIS offers better stability despite its recent bearish price action. Both present nuanced opportunities depending on your risk tolerance and investment horizon.
Disclaimer: Investment carries a risk of loss of initial capital. The past performance is not a reliable indicator of future results. Be sure to understand risks before making an investment decision.
Go Further
I encourage you to read the complete analyses of International Business Machines Corporation and Fidelity National Information Services, Inc. to enhance your investment decisions: