In the fast-evolving world of information technology services, Fidelity National Information Services, Inc. (FIS) and Globant S.A. (GLOB) stand out as innovative leaders. Both companies operate in overlapping markets, offering cutting-edge digital and cloud solutions that drive transformation for businesses worldwide. This comparison explores their strategies and growth potential, guiding investors toward the most compelling opportunity in this dynamic sector. Let’s uncover which stock deserves a spot in your portfolio.
Table of contents
Companies Overview
I will begin the comparison between Fidelity National Information Services, Inc. (FIS) and Globant S.A. (GLOB) by providing an overview of these two companies and their main differences.
Fidelity National Information Services, Inc. Overview
FIS operates in the technology sector, providing comprehensive technology solutions for merchants, banks, and capital markets worldwide. Its offerings include enterprise acquiring, digital banking, fraud and risk management, and capital market solutions. Founded in 1968 and headquartered in Jacksonville, Florida, FIS serves a broad client base through Merchant, Banking, and Capital Market Solutions segments with 50,000 employees.
Globant S.A. Overview
Globant is a technology services company headquartered in Luxembourg, specializing in digital transformation and innovation through a wide range of services including e-commerce, cloud transformation, data analytics, and cybersecurity. Founded in 2003, Globant employs approximately 31,280 people and supports industries such as healthcare, media, and finance with platforms and agile delivery models to drive digital reinvention globally.
Key similarities and differences
Both FIS and Globant operate in the information technology services sector, focusing on digital solutions and technology-driven innovation. FIS emphasizes financial technology solutions for banking and capital markets, while Globant offers broader digital transformation services across multiple industries. FIS has a larger workforce and market capitalization of 33B USD compared to Globant’s 3B USD, reflecting their differing scales and market focuses.
Income Statement Comparison
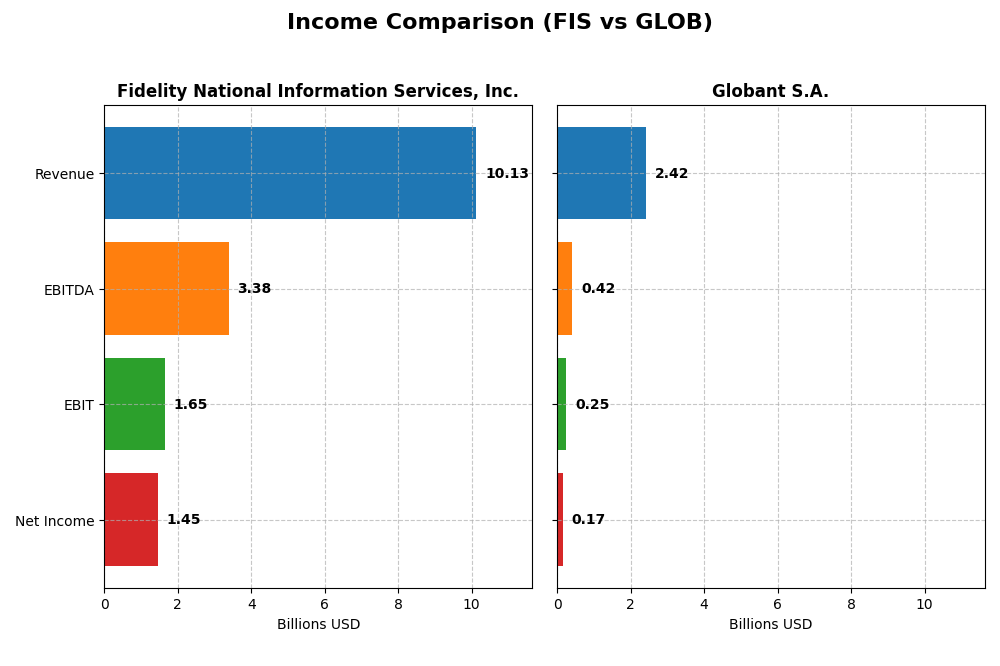
The table below compares the key income statement metrics for Fidelity National Information Services, Inc. and Globant S.A. for the fiscal year 2024.
| Metric | Fidelity National Information Services, Inc. | Globant S.A. |
|---|---|---|
| Market Cap | 33.1B USD | 2.99B USD |
| Revenue | 10.13B USD | 2.42B USD |
| EBITDA | 3.39B USD | 417M USD |
| EBIT | 1.65B USD | 254M USD |
| Net Income | 1.45B USD | 166M USD |
| EPS | 1.42 USD | 3.82 USD |
| Fiscal Year | 2024 | 2024 |
Income Statement Interpretations
Fidelity National Information Services, Inc.
FIS’s revenue showed a slight decline over the 2020-2024 period, dropping by 19.3%, while net income improved dramatically with an 818% increase. Margins improved notably, with a 14.3% net margin in 2024 and a favorable gross margin of 37.6%. The latest year marked a recovery with net income turning positive after prior losses, driven by a 20% EBIT growth.
Globant S.A.
Globant experienced strong revenue growth of nearly 197% from 2020 to 2024, with net income rising by 206%. Margins remain favorable, with a 35.7% gross margin and a 6.9% net margin in the latest year. Revenue and profitability both expanded significantly in 2024, although net margin saw a minor decline of 9.3% compared to the previous year.
Which one has the stronger fundamentals?
Both companies display favorable fundamentals, but differ in scale and growth dynamics. FIS shows robust margin improvements and net income recovery despite revenue contraction, reflecting operational efficiency. Globant delivers strong top-line growth and expanding net income, though with thinner margins. The assessment depends on whether margin strength or revenue growth is prioritized.
Financial Ratios Comparison
The table below presents a side-by-side comparison of key financial ratios for Fidelity National Information Services, Inc. (FIS) and Globant S.A. (GLOB) based on their most recent fiscal year data (2024).
| Ratios | Fidelity National Information Services, Inc. (FIS) | Globant S.A. (GLOB) |
|---|---|---|
| ROE | 9.24% | 8.44% |
| ROIC | 3.99% | 6.82% |
| P/E | 30.8 | 57.6 |
| P/B | 2.85 | 4.86 |
| Current Ratio | 0.85 | 1.54 |
| Quick Ratio | 0.85 | 1.54 |
| D/E (Debt-to-Equity) | 0.74 | 0.21 |
| Debt-to-Assets | 34.2% | 12.95% |
| Interest Coverage | 4.87 | 7.87 |
| Asset Turnover | 0.30 | 0.76 |
| Fixed Asset Turnover | 11.56 | 8.70 |
| Payout ratio | 55.17% | 0% |
| Dividend yield | 1.79% | 0% |
Interpretation of the Ratios
Fidelity National Information Services, Inc. (FIS)
FIS shows mixed financial strength with a favorable net margin of 14.32% but unfavorable returns on equity (9.24%) and invested capital (3.99%). Its liquidity is a concern, with a current ratio of 0.85. Dividend yield stands at 1.79%, indicating regular payouts, but investors should monitor payout sustainability due to some unfavorable ratios and cash flow challenges.
Globant S.A. (GLOB)
Globant’s ratios reflect moderate operational efficiency with a neutral net margin of 6.86% and slightly unfavorable return on equity at 8.44%. Liquidity metrics are strong, shown by a current ratio of 1.54 and low debt-to-assets at 12.95%. The company does not pay dividends, likely prioritizing reinvestment and growth, consistent with its high valuation multiples.
Which one has the best ratios?
Globant demonstrates a more favorable overall ratio profile, with stronger liquidity, lower leverage, and better interest coverage, despite some valuation concerns. FIS struggles with liquidity and return metrics but offers dividend income. The choice depends on the investor’s focus on stability versus income and growth potential.
Strategic Positioning
This section compares the strategic positioning of Fidelity National Information Services, Inc. (FIS) and Globant S.A. (GLOB) in terms of Market position, Key segments, and Exposure to technological disruption:
FIS
- Large market cap with established presence in global financial technology services.
- Focuses on Merchant, Banking, and Capital Market Solutions as key revenue drivers.
- Exposure involves evolving financial tech but no explicit mention of disruptive threats.
GLOB
- Smaller market cap, positioned as a global technology services company with diverse offerings.
- Offers broad IT services including digital transformation, cloud, data, and industry-specific.
- Embraces cutting-edge tech like blockchain, AI, cloud, and metaverse, implying higher disruption exposure.
FIS vs GLOB Positioning
FIS has a diversified financial technology portfolio focused on banking and capital markets, while GLOB concentrates on a wide range of technology services including digital innovation and cloud. FIS benefits from scale and specialization; GLOB offers breadth in emerging tech fields.
Which has the best competitive advantage?
Both companies show slightly unfavorable MOAT evaluations due to ROIC below WACC but with growing profitability trends. Neither currently demonstrates a strong competitive advantage based on the provided MOAT data.
Stock Comparison
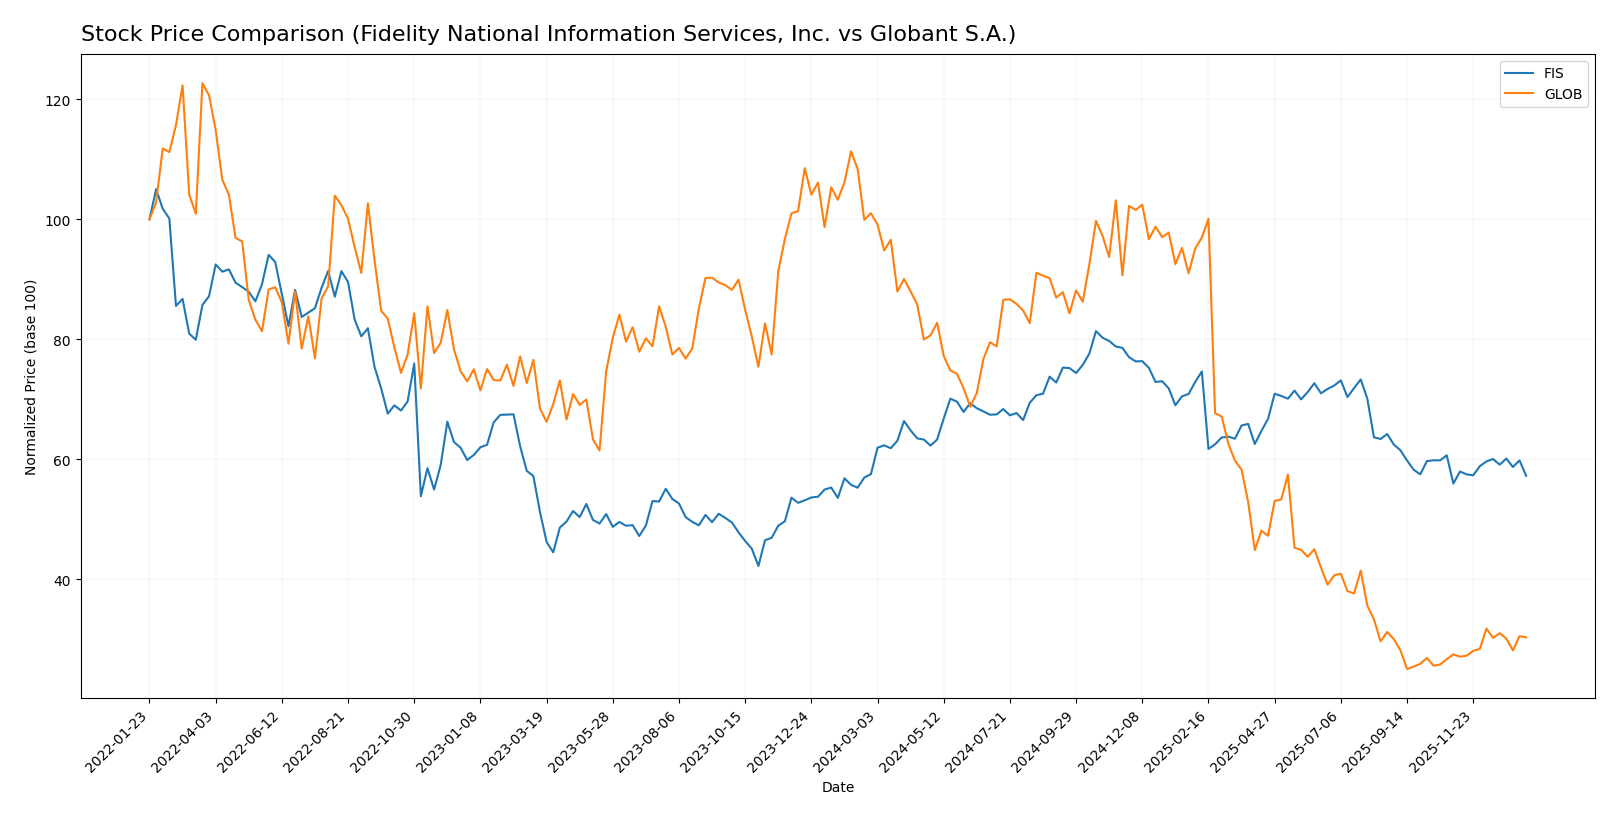
The stock price movements of Fidelity National Information Services, Inc. (FIS) and Globant S.A. (GLOB) over the past year reveal contrasting patterns in market performance and trading dynamics, with notable fluctuations in price and volume activity.
Trend Analysis
FIS exhibited a slight bearish trend over the past 12 months with a -0.47% price change, showing accelerating downward momentum and a standard deviation of 7.01. The stock ranged between $62.52 and $90.95.
GLOB experienced a pronounced bearish trend with a -70.01% price decline in the same period, marked by acceleration and significant volatility reflected in a 61.44 standard deviation, with prices falling from $231.36 to $56.11.
Comparing both, FIS posted the highest market performance with a minor price decrease versus GLOB’s severe drop, despite recent short-term gains in both stocks.
Target Prices
Analysts present a positive outlook on these technology service companies, with target prices suggesting potential upside from current levels.
| Company | Target High | Target Low | Consensus |
|---|---|---|---|
| Fidelity National Information Services, Inc. | 82 | 69 | 75.5 |
| Globant S.A. | 80 | 68 | 72.5 |
The consensus target prices for Fidelity National Information Services and Globant S.A. exceed their current stock prices of 63.98 and 67.93 respectively, indicating expected appreciation in the medium term.
Analyst Opinions Comparison
This section compares analysts’ ratings and grades for Fidelity National Information Services, Inc. (FIS) and Globant S.A. (GLOB):
Rating Comparison
FIS Rating
- Rating: C+ indicating a very favorable rating status.
- Discounted Cash Flow Score: 4, considered favorable for valuation.
- ROE Score: 2, moderate efficiency in generating profit from equity.
- ROA Score: 2, moderate asset utilization effectiveness.
- Debt To Equity Score: 1, very unfavorable, indicating higher financial risk.
- Overall Score: 2, moderate overall financial standing.
GLOB Rating
- Rating: A- reflecting a very favorable rating status.
- Discounted Cash Flow Score: 5, very favorable, suggesting strong cash flow.
- ROE Score: 3, moderate efficiency but higher than FIS.
- ROA Score: 3, moderate asset use, outperforming FIS.
- Debt To Equity Score: 3, moderate financial risk, stronger balance sheet.
- Overall Score: 4, favorable overall financial position.
Which one is the best rated?
Based strictly on provided data, GLOB is better rated overall with an A- rating and higher scores in discounted cash flow, ROE, ROA, debt-to-equity, and overall score compared to FIS’s C+ rating and lower scores.
Scores Comparison
Here is a comparison of the Altman Z-Score and Piotroski Score for Fidelity National Information Services, Inc. (FIS) and Globant S.A. (GLOB):
FIS Scores
- Altman Z-Score: 0.46, indicating financial distress and risk.
- Piotroski Score: 8, reflecting very strong financial health.
GLOB Scores
- Altman Z-Score: 3.05, indicating a safe zone with low bankruptcy risk.
- Piotroski Score: 5, reflecting average financial strength.
Which company has the best scores?
Based strictly on the provided data, GLOB has a stronger Altman Z-Score indicating lower bankruptcy risk, while FIS has a higher Piotroski Score indicating stronger financial health. Each excels in different score categories.
Grades Comparison
Here is a comparison of the recent grades assigned to Fidelity National Information Services, Inc. and Globant S.A.:
Fidelity National Information Services, Inc. Grades
The table below shows recent grades from recognized financial institutions for FIS:
| Grading Company | Action | New Grade | Date |
|---|---|---|---|
| Truist Securities | Maintain | Hold | 2025-11-19 |
| RBC Capital | Maintain | Outperform | 2025-11-06 |
| JP Morgan | Maintain | Overweight | 2025-11-06 |
| UBS | Maintain | Buy | 2025-11-06 |
| Truist Securities | Maintain | Hold | 2025-10-24 |
| Keefe, Bruyette & Woods | Maintain | Outperform | 2025-10-01 |
| UBS | Upgrade | Buy | 2025-09-30 |
| UBS | Maintain | Neutral | 2025-08-06 |
| Keefe, Bruyette & Woods | Maintain | Outperform | 2025-08-06 |
| Truist Securities | Maintain | Hold | 2025-07-17 |
FIS shows a consistent pattern of positive ratings, with multiple institutions maintaining Outperform, Buy, or Overweight grades, indicating a generally favorable outlook.
Globant S.A. Grades
Below are recent grades from recognized financial institutions for GLOB:
| Grading Company | Action | New Grade | Date |
|---|---|---|---|
| Jefferies | Downgrade | Hold | 2025-11-20 |
| UBS | Maintain | Neutral | 2025-11-18 |
| JP Morgan | Maintain | Neutral | 2025-11-14 |
| Needham | Maintain | Buy | 2025-11-14 |
| Canaccord Genuity | Maintain | Hold | 2025-11-14 |
| Goldman Sachs | Maintain | Neutral | 2025-10-09 |
| UBS | Maintain | Neutral | 2025-08-20 |
| Goldman Sachs | Maintain | Neutral | 2025-08-18 |
| Needham | Maintain | Buy | 2025-08-15 |
| JP Morgan | Downgrade | Neutral | 2025-08-15 |
GLOB’s grades show a more mixed to neutral trend, with several downgrades and a majority of Hold or Neutral ratings, suggesting moderate investor confidence.
Which company has the best grades?
FIS has received generally stronger and more positive grades than GLOB, with multiple Buy and Outperform recommendations versus GLOB’s predominance of Neutral and Hold ratings. This divergence may impact investor sentiment, favoring FIS for perceived growth potential and stability.
Strengths and Weaknesses
Below is a comparison of key strengths and weaknesses for Fidelity National Information Services, Inc. (FIS) and Globant S.A. (GLOB) based on the most recent financial and operational data.
| Criterion | Fidelity National Information Services, Inc. (FIS) | Globant S.A. (GLOB) |
|---|---|---|
| Diversification | Strong diversification with Banking, Capital Market, and Merchant Solutions generating multi-billion revenues. | Less diversified, focused primarily on digital consulting and software development services. |
| Profitability | Moderate net margin at 14.32%, but ROIC (3.99%) below WACC (6.54%), indicating value destruction. | Lower net margin at 6.86%, ROIC (6.82%) below WACC (8.92%), also shedding value but improving. |
| Innovation | Moderate innovation evidenced by slight ROIC growth, but overall profitability challenges. | Growing ROIC trend suggests improving innovation and operational efficiency. |
| Global presence | Significant global financial solutions footprint, especially in banking and capital markets. | Global IT and consulting presence, but less market penetration compared to FIS in financial sectors. |
| Market Share | Established market share in financial services technology with robust fixed asset turnover (11.56). | Smaller market share with favorable liquidity ratios but higher valuation multiples (PE 57.64, PB 4.86). |
Key takeaways: Both companies currently exhibit slightly unfavorable economic moats due to ROIC below WACC. FIS benefits from diversification and scale but struggles with value creation. Globant shows improving profitability trends and stronger liquidity but faces high valuation risks. Investors should weigh growth potential against current profitability challenges carefully.
Risk Analysis
Below is a summary table of key risks for Fidelity National Information Services, Inc. (FIS) and Globant S.A. (GLOB) based on their latest 2024 financial and operational data:
| Metric | Fidelity National Information Services, Inc. (FIS) | Globant S.A. (GLOB) |
|---|---|---|
| Market Risk | Moderate (Beta 0.94, range $59.51-$83.97) | Higher (Beta 1.20, range $54.36-$228.98) |
| Debt Level | Moderate (Debt/Equity 0.74, Debt to Assets 34.16%) | Low (Debt/Equity 0.21, Debt to Assets 12.95%) |
| Regulatory Risk | Moderate (Financial services tech sector exposure) | Moderate (Global IT services, diverse regulations) |
| Operational Risk | Moderate (50K employees, complex legacy systems) | Moderate (31K employees, rapid tech innovation) |
| Environmental Risk | Low (Technology sector, limited direct impact) | Low (Technology sector, limited direct impact) |
| Geopolitical Risk | Moderate (US-based, global client exposure) | Elevated (Luxembourg-based, international operations) |
The most likely and impactful risks include Globant’s higher market volatility and geopolitical exposure, given its broad global footprint and high share price fluctuation. FIS faces moderate leverage and operational complexity risks, compounded by a low liquidity ratio and a distressed Altman Z-Score, signaling caution regarding financial stability. Investors should weigh Globant’s strong liquidity and low debt against its valuation and market risk, while considering FIS’s financial distress signals despite its solid dividend yield and stable market presence.
Which Stock to Choose?
Fidelity National Information Services, Inc. (FIS) shows a favorable income statement with strong net margin growth of 121.15% in one year, but overall revenue declined by 19.32% over five years. Financial ratios reveal a slightly unfavorable profile due to weak ROE and ROIC, and a current ratio below 1. Debt levels are moderate, with a net debt to EBITDA of 3.16, and the company holds a very favorable C+ rating overall.
Globant S.A. (GLOB) exhibits favorable income growth, with a 15.26% revenue increase in one year and nearly 197% over five years. Its financial ratios are slightly favorable, driven by solid liquidity and low leverage, despite a high P/E ratio and moderate profitability metrics. Debt is low, with a net debt to EBITDA of 0.64, and it maintains a very favorable A- rating.
For investors, GLOB’s stronger income growth and favorable financial ratios may appeal to those seeking growth with moderate risk, while FIS’s improving income quality but slightly unfavorable ratios could attract those focusing on income stability and established market presence. The choice might depend on risk tolerance and investment strategy preferences.
Disclaimer: Investment carries a risk of loss of initial capital. The past performance is not a reliable indicator of future results. Be sure to understand risks before making an investment decision.
Go Further
I encourage you to read the complete analyses of Fidelity National Information Services, Inc. and Globant S.A. to enhance your investment decisions: