Home > Comparison > Technology > FIS vs G
The strategic rivalry between Fidelity National Information Services, Inc. (FIS) and Genpact Limited shapes the dynamics of the technology sector’s IT services industry. FIS operates as a capital-intensive provider of financial technology solutions, while Genpact excels as a high-scale business process outsourcing and IT services specialist. This analysis pits FIS’s integrated tech model against Genpact’s diversified service approach to identify which offers superior risk-adjusted returns for a diversified portfolio.
Table of contents
Companies Overview
Fidelity National Information Services and Genpact Limited both wield significant influence in the global information technology services market.
Fidelity National Information Services, Inc.: Global Fintech Powerhouse
Fidelity National Information Services dominates as a technology solutions provider for merchants, banks, and capital markets worldwide. Its revenue stems from three core segments: Merchant Solutions, Banking Solutions, and Capital Market Solutions. In 2026, it strategically focuses on expanding digital banking and risk management services, reinforcing its competitive edge in financial technology infrastructure.
Genpact Limited: Business Process Outsourcing Leader
Genpact Limited excels as a business process outsourcing and IT services firm with a global footprint across Asia, the Americas, and Europe. It generates revenue through diversified services including finance and accounting, supply chain advisory, and digital transformation. In 2026, the company emphasizes ESG services and analytics, aligning growth with sustainability trends and technology-driven operational efficiencies.
Strategic Collision: Similarities & Divergences
Both companies operate within the IT services sector but differ fundamentally in approach. Fidelity National Information Services builds a closed ecosystem centered on financial technology, while Genpact pursues an open infrastructure across multiple industries with a broader service scope. Their primary battleground lies in digital transformation solutions. Investors must weigh Fidelity’s specialized fintech dominance against Genpact’s diversified outsourcing growth.
Income Statement Comparison
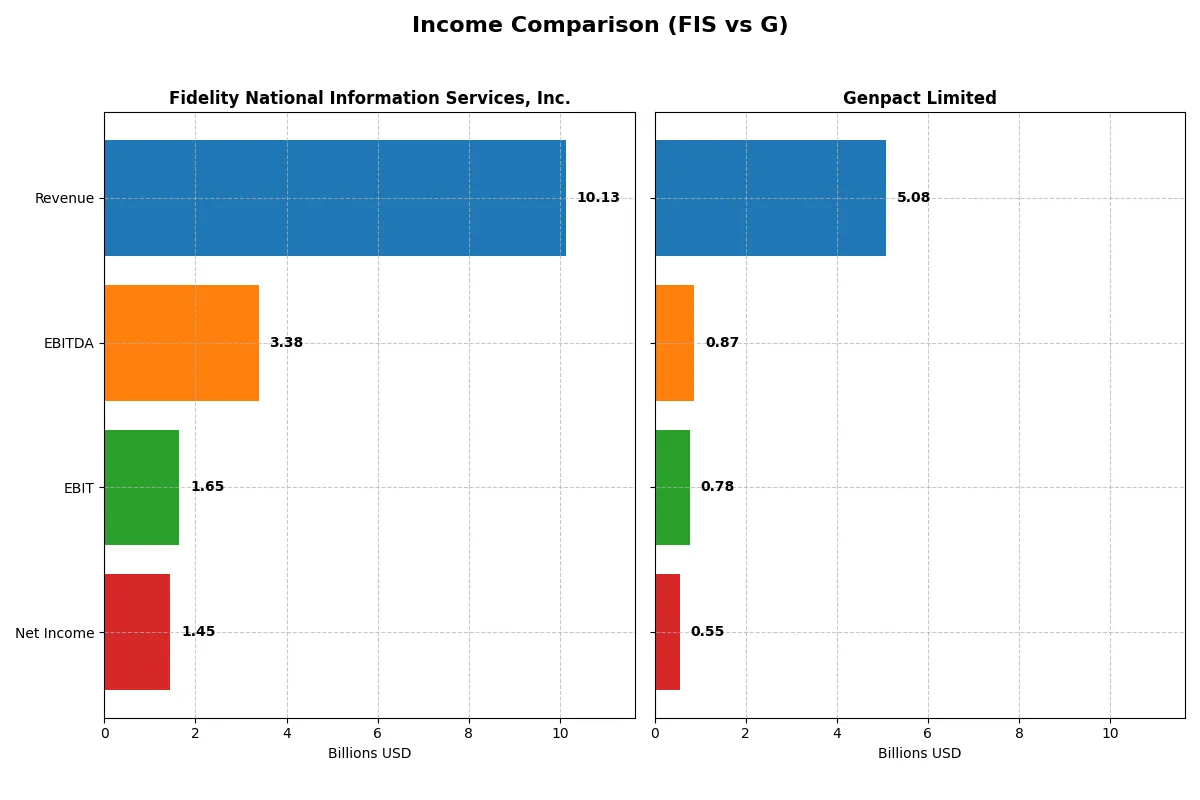
This data dissects the core profitability and scalability of both corporate engines to reveal who dominates the bottom line:
| Metric | Fidelity National Information Services, Inc. (FIS) | Genpact Limited (G) |
|---|---|---|
| Revenue | 10.13B | 5.08B |
| Cost of Revenue | 6.32B | 3.25B |
| Operating Expenses | 2.10B | 1.05B |
| Gross Profit | 3.80B | 1.83B |
| EBITDA | 3.39B | 875M |
| EBIT | 1.65B | 780M |
| Interest Expense | 351M | 50M |
| Net Income | 1.45B | 552M |
| EPS | 1.42 | 3.18 |
| Fiscal Year | 2024 | 2025 |
Income Statement Analysis: The Bottom-Line Duel
This income statement comparison reveals which company operates with superior efficiency and momentum in their core financial engine.
Fidelity National Information Services, Inc. Analysis
FIS’s revenue slightly rebounded to 10.1B in 2024 after a dip, with net income surging to 1.45B, driven by a strong turnaround from prior losses. Gross margin remains healthy at 37.6%, while net margin expanded impressively to 14.3%, reflecting improved operational leverage and disciplined expense control in the latest year.
Genpact Limited Analysis
Genpact’s revenue grew steadily to 5.1B in 2025 with net income rising to 552M, continuing a consistent upward trajectory. Gross margin holds firm at 36.0%, and net margin at 10.9%, showing solid profitability. The company maintains balanced expense growth aligned with revenue, supporting stable EBIT margin and moderate earnings momentum.
Margin Strength vs. Revenue Momentum
FIS outpaces Genpact in net margin and earnings growth, recovering swiftly from past losses with a more efficient cost structure. Genpact delivers steadier revenue growth and reliable profitability at a smaller scale. Investors seeking accelerated margin expansion may favor FIS, while those prioritizing consistent top-line growth might lean toward Genpact’s profile.
Financial Ratios Comparison
These vital ratios act as a diagnostic tool to expose the underlying fiscal health, valuation premiums, and capital efficiency of the companies compared below:
| Ratios | Fidelity National Information Services, Inc. (FIS) | Genpact Limited (G) |
|---|---|---|
| ROE | 9.2% | 21.7% |
| ROIC | 4.0% | 12.3% |
| P/E | 30.8 | 14.7 |
| P/B | 2.85 | 3.19 |
| Current Ratio | 0.85 | 1.66 |
| Quick Ratio | 0.85 | 1.66 |
| D/E | 0.74 | 0.23 |
| Debt-to-Assets | 34.2% | 9.9% |
| Interest Coverage | 4.87 | 15.32 |
| Asset Turnover | 0.30 | 0.87 |
| Fixed Asset Turnover | 11.56 | 13.65 |
| Payout ratio | 55.2% | 21.3% |
| Dividend yield | 1.79% | 1.45% |
| Fiscal Year | 2024 | 2025 |
Efficiency & Valuation Duel: The Vital Signs
Financial ratios act as a company’s DNA, exposing hidden risks and revealing operational strengths critical for investment decisions.
Fidelity National Information Services, Inc.
FIS shows moderate profitability with a 9.24% ROE and a solid 14.32% net margin, but its 30.8 P/E signals an expensive valuation. The company maintains a neutral dividend yield of 1.79%, balancing shareholder returns with reinvestment. However, its low current ratio at 0.85 flags liquidity concerns, dampening operational efficiency.
Genpact Limited
Genpact posts strong profitability: a 21.67% ROE and 10.88% net margin coupled with a reasonable 14.72 P/E, indicating an efficient valuation. It benefits from robust financial health, including a high current ratio of 1.66 and low debt levels. The dividend yield is modest at 1.45%, reflecting steady returns alongside growth investments.
Premium Valuation vs. Operational Safety
Genpact offers a superior balance of profitability, valuation, and financial stability compared to FIS’s stretched multiples and liquidity risks. Investors favoring operational safety and solid returns may find Genpact’s profile more fitting, while FIS presents a riskier, more expensive proposition.
Which one offers the Superior Shareholder Reward?
I compare Fidelity National Information Services, Inc. (FIS) and Genpact Limited (G) by examining their dividend yields, payout ratios, and share buyback strategies. FIS yields 1.79% with a high payout ratio of 55%, signaling a significant portion of earnings returned to shareholders but raising sustainability concerns. Its free cash flow per share stands at $3.57, supporting dividends yet limiting aggressive buybacks. Genpact yields 1.45% with a conservative 21% payout ratio, retaining more earnings for growth and acquisitions. Genpact’s free cash flow per share is $4.22, enabling steady dividends and robust buybacks. Historically, Genpact’s lower leverage (debt/assets 10%) versus FIS’s 34% suggests a more flexible capital allocation. I conclude Genpact offers a superior total shareholder return profile in 2026, balancing steady income and growth potential more sustainably than FIS.
Comparative Score Analysis: The Strategic Profile
The radar chart reveals the fundamental DNA and financial trade-offs of Fidelity National Information Services, Inc. and Genpact Limited:
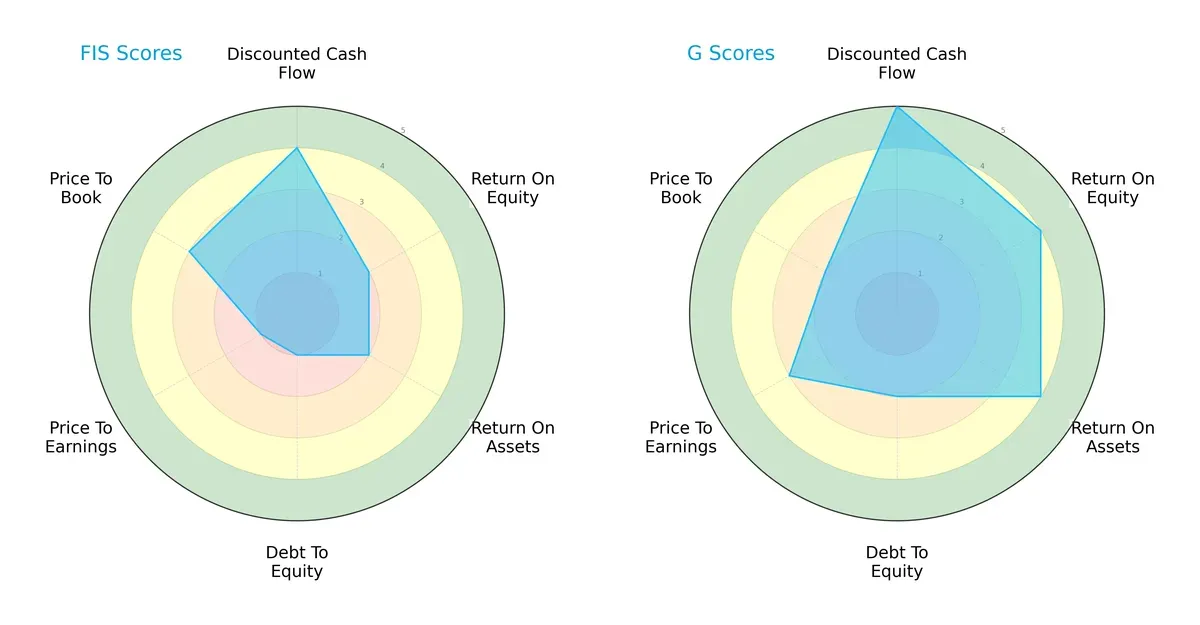
Genpact exhibits a more balanced profile with very favorable DCF (5) and solid ROE (4) and ROA (4) scores. Fidelity National Information Services relies heavily on discounted cash flow strength (4) but scores poorly on debt management (1) and valuation metrics (PE 1, PB 3). Genpact’s moderate debt score (2) slightly weakens its profile but outperforms Fidelity in profitability and valuation, suggesting greater operational efficiency and market confidence.
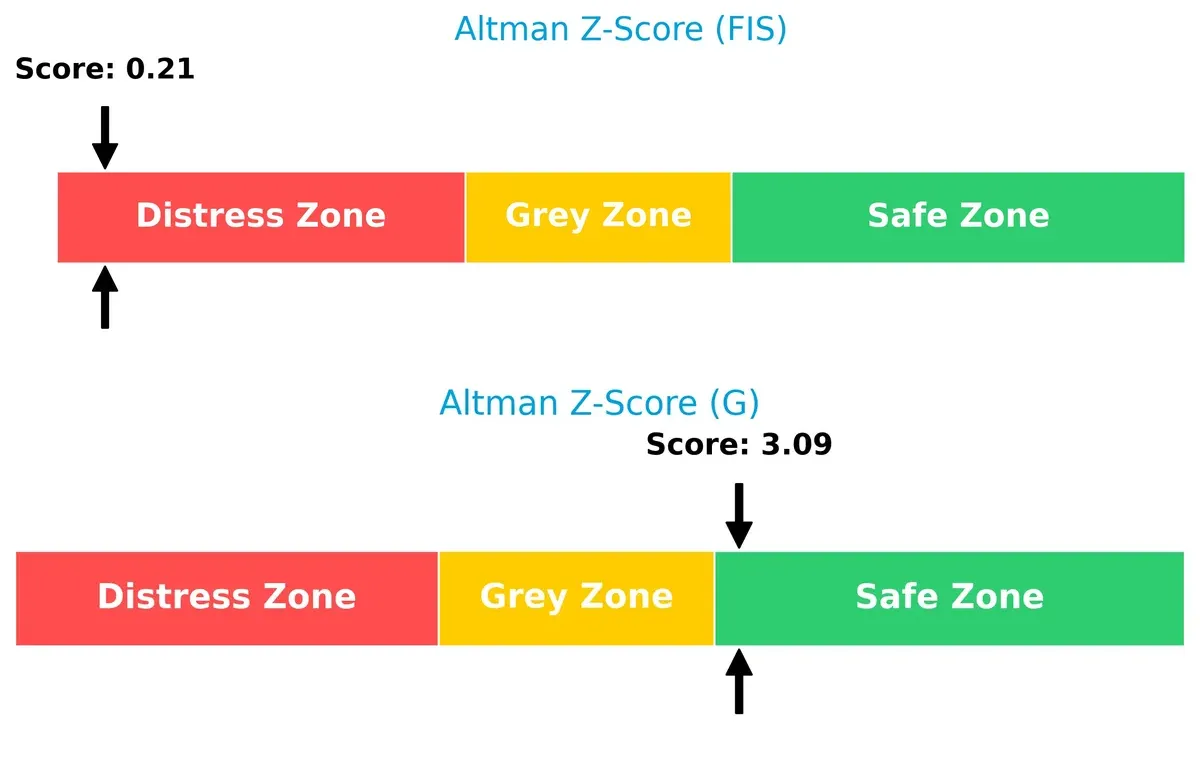
Bankruptcy Risk: Solvency Showdown
Genpact’s Altman Z-Score (3.09) places it safely above the distress threshold, signaling strong long-term solvency. Fidelity National Information Services, at 0.21, falls deep into distress, indicating high bankruptcy risk in this cycle:
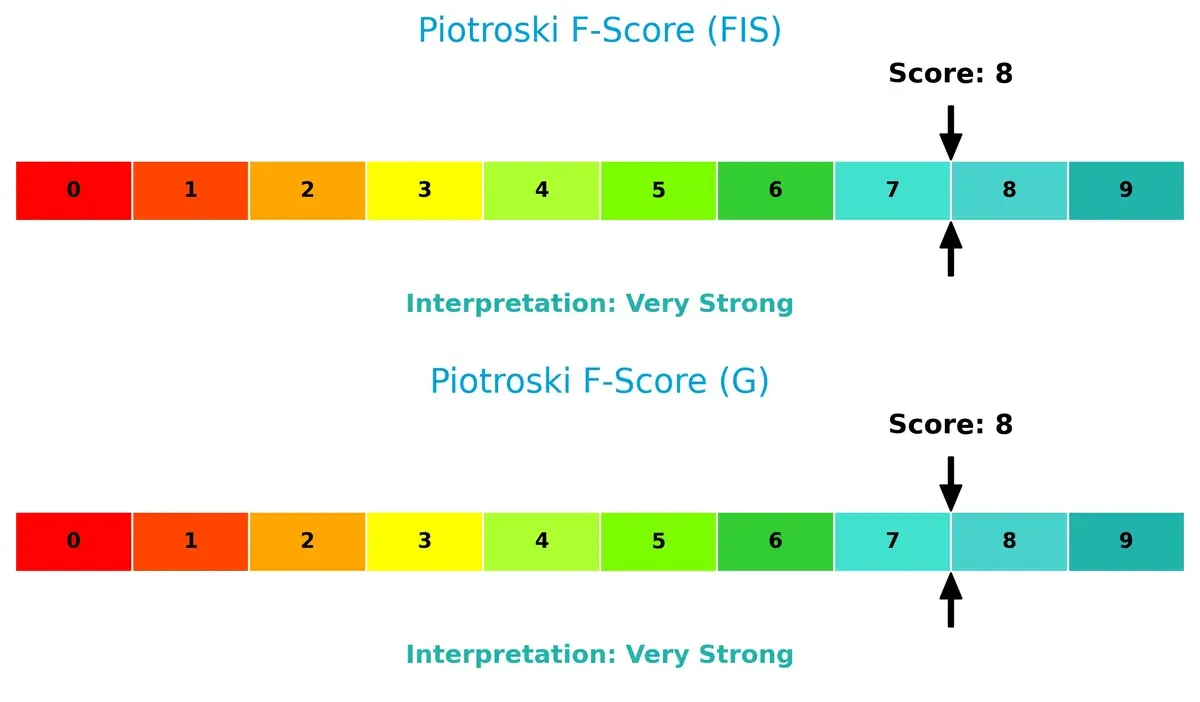
Financial Health: Quality of Operations
Both companies score an 8 on the Piotroski F-Score, reflecting very strong financial health. Neither shows red flags, but given Fidelity’s solvency risk, this operational strength may face stress under adverse conditions:
How are the two companies positioned?
This section dissects the operational DNA of FIS and G by comparing their revenue distribution by segment alongside their internal strengths and weaknesses. The goal is to confront their economic moats and reveal which business model delivers the most resilient, sustainable competitive advantage today.
Revenue Segmentation: The Strategic Mix
The following visual comparison dissects how both firms diversify their income streams and where their primary sector bets lie:
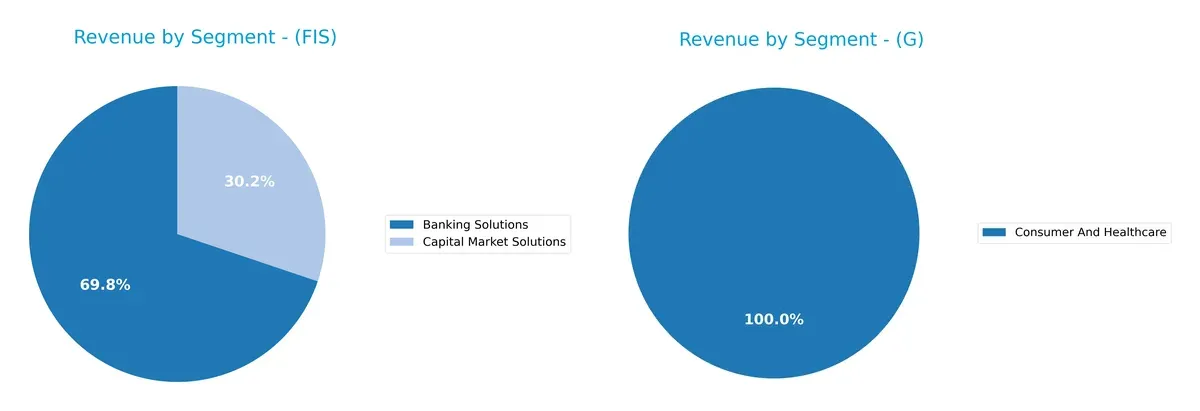
Fidelity National Information Services, Inc. (FIS) anchors its revenue in Banking Solutions with $6.9B in 2024, supplemented by Capital Market Solutions at $3B. This mix shows moderate diversification within financial tech. Genpact Limited (G) pivots heavily on Consumer and Healthcare, generating $1.7B, with no other sizable segments reported in 2024, signaling concentration risk. FIS leverages infrastructure dominance, while Genpact’s narrow focus could limit resilience against sector volatility.
Strengths and Weaknesses Comparison
This table compares the strengths and weaknesses of Fidelity National Information Services, Inc. (FIS) and Genpact Limited (G):
FIS Strengths
- Diversified revenue from Banking and Capital Market Solutions
- Strong presence in North America with $7.85B revenue
- Favorable net margin at 14.32%
- Favorable fixed asset turnover at 11.56
G Strengths
- Diverse business segments including Consumer, Healthcare, and High Tech
- Global footprint with significant revenue from India, Americas, and Europe
- Favorable ROE at 21.67% and ROIC at 12.32%
- Strong liquidity with current ratio 1.66
FIS Weaknesses
- Low current ratio at 0.85 indicates liquidity risk
- Unfavorable ROE (9.24%) and ROIC (3.99%) below WACC
- High P/E ratio at 30.8 suggests overvaluation
- Lower asset turnover at 0.3 signals inefficiency
G Weaknesses
- Unfavorable price-to-book ratio at 3.19
- Moderate asset turnover at 0.87
- Dividend yield slightly lower at 1.45%
FIS exhibits strength in North American market share and solid margins but faces liquidity and efficiency challenges. G demonstrates superior profitability and liquidity supported by global diversification, though valuation and asset utilization metrics warrant monitoring.
The Moat Duel: Analyzing Competitive Defensibility
Structural moats protect long-term profits from relentless competition erosion. Only a durable moat ensures sustainable excess returns:
Fidelity National Information Services, Inc. (FIS): Network Effects and Integrated Solutions
FIS leverages network effects through its extensive banking and merchant platforms, showing margin stability with a 14.3% net margin. However, its ROIC trails WACC, signaling value destruction despite improving profitability in 2026.
Genpact Limited (G): Cost Advantage and Process Efficiency
Genpact’s moat stems from cost advantages and scalable business process outsourcing. It consistently creates value, with ROIC exceeding WACC by 5%, and steadily growing margins, positioning it well for expanding digital transformation services.
Network Effects vs. Cost Leadership: Who Holds the Deeper Moat?
Genpact’s cost efficiency and positive ROIC beat FIS’s network-driven but value-destroying model. I see Genpact better equipped to defend and expand its market share in a competitive IT services landscape.
Which stock offers better returns?
The stock price movements over the past year reveal contrasting trends between Fidelity National Information Services, Inc. and Genpact Limited, with notable shifts in momentum and trading volumes shaping their trajectories.
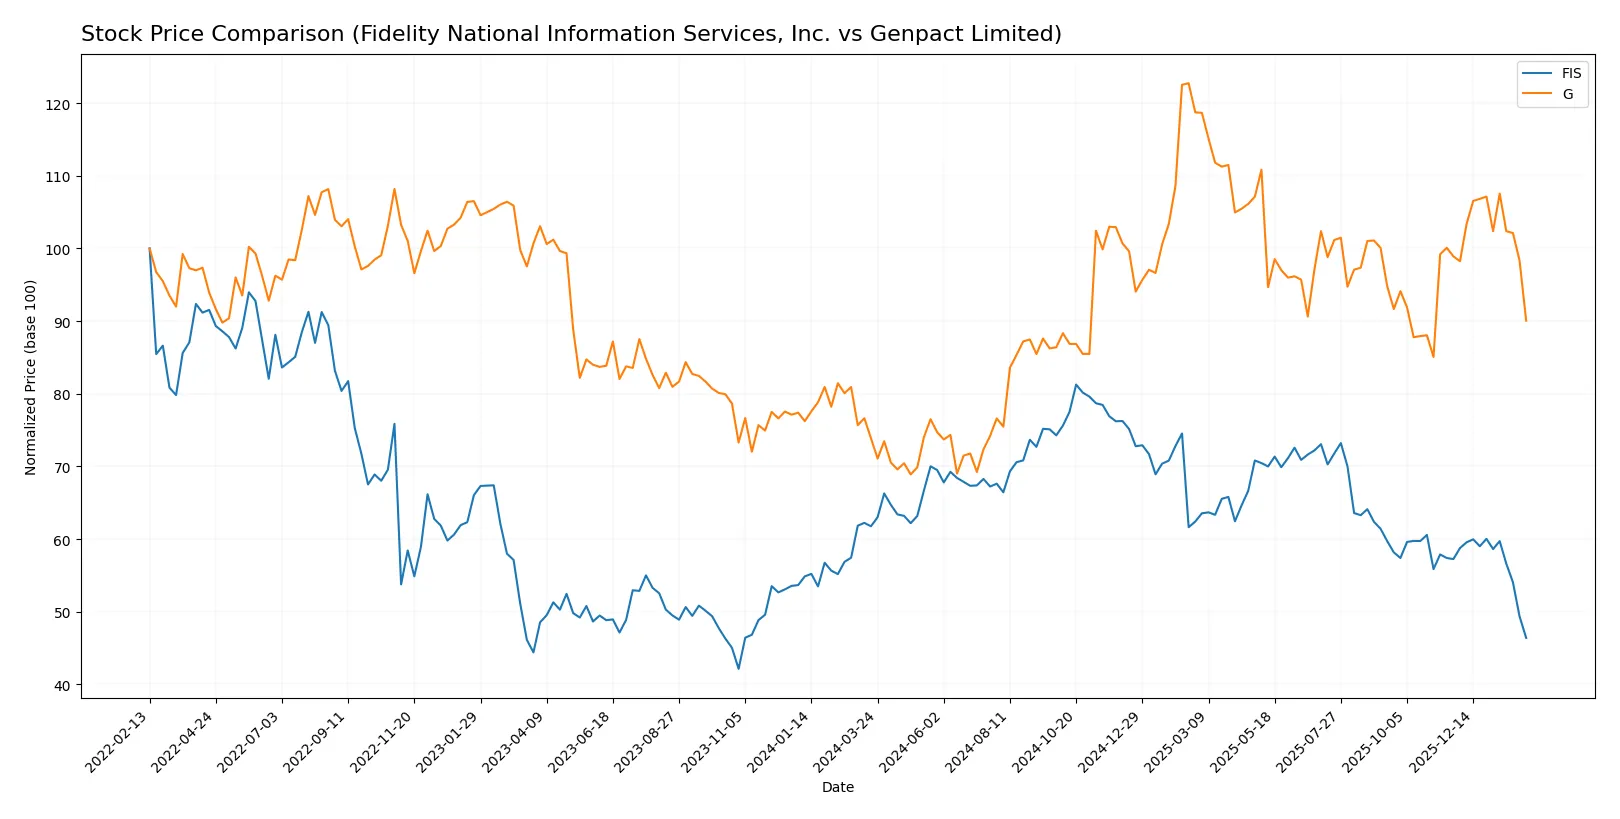
Trend Comparison
Fidelity National Information Services, Inc. (FIS) shows a bearish trend over the past 12 months with a -24.87% price decline. The trend decelerates amid a standard deviation of 7.68, hitting a high of 90.95 and a low of 51.93.
Genpact Limited (G) records a bullish trend over the same period, appreciating by 21.95%. Despite deceleration in momentum and a standard deviation of 6.04, it reached a high of 55.05 and a low of 30.9.
Comparing both, Genpact Limited outperformed Fidelity National Information Services with positive market returns, while FIS experienced a significant downturn over the past year.
Target Prices
Analysts present a constructive consensus for both Fidelity National Information Services, Inc. and Genpact Limited, indicating upside potential.
| Company | Target Low | Target High | Consensus |
|---|---|---|---|
| Fidelity National Information Services, Inc. | 69 | 85 | 75.43 |
| Genpact Limited | 42 | 50 | 46 |
The target consensus for FIS at 75.43 suggests a 45% upside from its current 51.93 price, reflecting confidence in its tech-driven growth. Genpact’s 46 consensus target implies a 14% premium over the 40.39 price, signaling moderate optimism.

Don’t Let Luck Decide Your Entry Point
Optimize your entry points with our advanced ProRealTime indicators. You’ll get efficient buy signals with precise price targets for maximum performance. Start outperforming now!
How do institutions grade them?
Fidelity National Information Services, Inc. Grades
The table below summarizes recent institutional grades for Fidelity National Information Services, Inc.:
| Grading Company | Action | New Grade | Date |
|---|---|---|---|
| Truist Securities | Maintain | Hold | 2025-11-19 |
| UBS | Maintain | Buy | 2025-11-06 |
| RBC Capital | Maintain | Outperform | 2025-11-06 |
| JP Morgan | Maintain | Overweight | 2025-11-06 |
| Truist Securities | Maintain | Hold | 2025-10-24 |
| Keefe, Bruyette & Woods | Maintain | Outperform | 2025-10-01 |
| UBS | Upgrade | Buy | 2025-09-30 |
| Keefe, Bruyette & Woods | Maintain | Outperform | 2025-08-06 |
| UBS | Maintain | Neutral | 2025-08-06 |
| Truist Securities | Maintain | Hold | 2025-07-17 |
Genpact Limited Grades
The table below summarizes recent institutional grades for Genpact Limited:
| Grading Company | Action | New Grade | Date |
|---|---|---|---|
| Needham | Maintain | Buy | 2026-02-06 |
| JP Morgan | Maintain | Neutral | 2025-08-20 |
| Needham | Maintain | Buy | 2025-08-08 |
| Mizuho | Maintain | Neutral | 2025-07-01 |
| Needham | Maintain | Buy | 2025-06-30 |
| TD Cowen | Maintain | Buy | 2025-06-27 |
| Baird | Maintain | Neutral | 2025-05-08 |
| Needham | Maintain | Buy | 2025-05-08 |
| Mizuho | Maintain | Neutral | 2025-02-10 |
| Needham | Maintain | Buy | 2025-02-07 |
Which company has the best grades?
Genpact Limited consistently receives Buy ratings from several firms, showing stronger consensus than Fidelity National Information Services, Inc., which has a wider range from Hold to Outperform. This difference may influence investor confidence and perceived growth potential.
Risks specific to each company
The following categories identify the critical pressure points and systemic threats facing both firms in the 2026 market environment:
1. Market & Competition
Fidelity National Information Services, Inc.
- Faces intense competition in global fintech and banking tech sectors, pressured by evolving digital payment trends.
Genpact Limited
- Competes in diversified BPO and IT services, challenged by pricing pressures and rapid tech innovation in outsourcing.
2. Capital Structure & Debt
Fidelity National Information Services, Inc.
- Moderate leverage with debt-to-assets at 34%, interest coverage neutral at 4.7x, posing manageable but watchful financial risk.
Genpact Limited
- Low leverage at 10% debt-to-assets and strong interest coverage of 15.7x, reflecting a conservative and stable capital structure.
3. Stock Volatility
Fidelity National Information Services, Inc.
- Beta of 0.9 indicates moderate sensitivity to market moves; price range wide ($50.48-$83.71) shows some volatility.
Genpact Limited
- Lower beta at 0.735 suggests less market volatility; price range narrower ($37.49-$55.84), indicating steadier investor sentiment.
4. Regulatory & Legal
Fidelity National Information Services, Inc.
- Exposed to stringent US financial regulations and compliance risks in payments and banking software segments.
Genpact Limited
- Faces complex multi-jurisdictional compliance challenges due to geographic diversity and outsourcing regulations.
5. Supply Chain & Operations
Fidelity National Information Services, Inc.
- Operational risks from technology integration and service delivery in fintech solutions, requiring continuous innovation.
Genpact Limited
- Operational complexity in managing global delivery centers and supply chain advisory, vulnerable to labor market fluctuations.
6. ESG & Climate Transition
Fidelity National Information Services, Inc.
- Increasing pressure to enhance ESG disclosures and reduce environmental footprint amid fintech industry scrutiny.
Genpact Limited
- Provides ESG services but must continuously upgrade internal ESG practices to meet rising stakeholder expectations.
7. Geopolitical Exposure
Fidelity National Information Services, Inc.
- Primarily US-focused, geopolitical risks moderate but includes potential trade and regulatory shifts affecting fintech.
Genpact Limited
- High geopolitical exposure due to global footprint, including Asia and Europe, increasing risk from policy changes and regional instability.
Which company shows a better risk-adjusted profile?
Genpact Limited demonstrates a superior risk-adjusted profile. Its low leverage, strong interest coverage, and safer Altman Z-score (3.1, safe zone) contrast sharply with Fidelity’s financial distress signal (Altman Z-score 0.21). Genpact’s diversified global operations and stable financial health mitigate many sector-specific risks. Fidelity’s elevated debt, unfavorable ROIC vs. WACC spread, and weak liquidity ratios highlight financial vulnerability. The most pressing risk for Fidelity is its capital structure fragility amid competitive fintech pressures. For Genpact, geopolitical exposure amid global outsourcing complexity remains the key concern. The data reveals Genpact’s robust balance sheet and efficient capital allocation as decisive advantages in today’s volatile market.
Final Verdict: Which stock to choose?
Fidelity National Information Services, Inc. (FIS) excels as a cash generator with a strong gross margin and improving profitability, signaling operational resilience. Its point of vigilance lies in a strained liquidity position and value destruction indicated by ROIC below WACC. It suits investors targeting aggressive growth with tolerance for near-term balance sheet risks.
Genpact Limited (G) boasts a robust strategic moat through high ROIC exceeding WACC, reflecting efficient capital use and sustainable competitive advantage. It maintains healthier liquidity and lower leverage compared to FIS, offering a safer profile. This stock fits well within growth-at-a-reasonable-price (GARP) portfolios seeking stable earnings expansion.
If you prioritize aggressive growth and can accept liquidity constraints, FIS’s improving profitability and cash flow might be compelling. However, if you seek better financial stability combined with enduring value creation, Genpact offers a more favorable risk-return profile and commands a premium as a quality growth pick.
Disclaimer: Investment carries a risk of loss of initial capital. The past performance is not a reliable indicator of future results. Be sure to understand risks before making an investment decision.
Go Further
I encourage you to read the complete analyses of Fidelity National Information Services, Inc. and Genpact Limited to enhance your investment decisions: