Home > Comparison > Technology > FIS vs IT
The strategic rivalry between Fidelity National Information Services, Inc. (FIS) and Gartner, Inc. shapes the landscape of the Technology sector’s Information Technology Services industry. FIS operates as a capital-intensive technology provider for financial institutions, while Gartner offers high-margin research and advisory services. This analysis pits FIS’s scale and operational breadth against Gartner’s expertise-driven model to identify which profile delivers superior risk-adjusted returns for diversified portfolios.
Table of contents
Companies Overview
Fidelity National Information Services and Gartner command critical roles in the global technology services market.
Fidelity National Information Services, Inc.: Comprehensive Financial Technology Provider
Fidelity National Information Services dominates as a technology solutions provider for merchants, banks, and capital markets. Its revenue stems from Merchant Solutions, Banking Solutions, and Capital Market Solutions segments. In 2026, it emphasizes expanding digital payments and fraud prevention, reinforcing its competitive edge in integrated financial services.
Gartner, Inc.: Premier Research and Advisory Firm
Gartner leads as a research and advisory powerhouse delivering subscription-based research, conferences, and consulting services worldwide. Its revenue engine revolves around recurring subscriptions and advisory support. The 2026 focus sharpens on IT cost optimization and digital transformation to help clients navigate complex technology landscapes.
Strategic Collision: Similarities & Divergences
Both firms operate in technology services but differ sharply: Fidelity builds a closed ecosystem of financial tech solutions, while Gartner offers open, data-driven advisory services. Their primary battleground is enterprise IT spending—Fidelity via transactional infrastructure, Gartner through strategic guidance. Their distinct investment profiles reflect one’s tangible infrastructure vs. the other’s intellectual capital dominance.
Income Statement Comparison
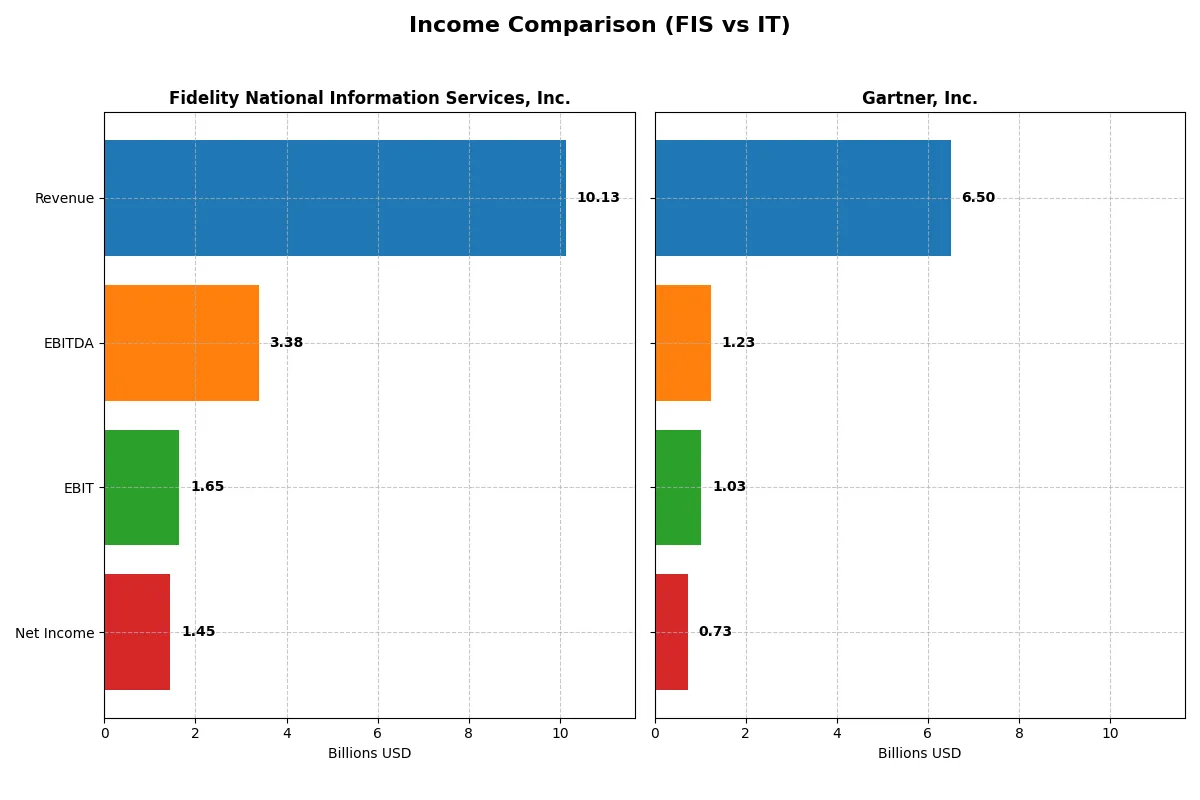
This data dissects the core profitability and scalability of both corporate engines to reveal who dominates the bottom line:
| Metric | Fidelity National Information Services, Inc. (FIS) | Gartner, Inc. (IT) |
|---|---|---|
| Revenue | 10.1B | 6.5B |
| Cost of Revenue | 6.3B | 2.1B |
| Operating Expenses | 2.1B | 3.4B |
| Gross Profit | 3.8B | 4.4B |
| EBITDA | 3.4B | 1.2B |
| EBIT | 1.6B | 1.0B |
| Interest Expense | 351M | 61M |
| Net Income | 1.5B | 729M |
| EPS | 1.42 | 9.68 |
| Fiscal Year | 2024 | 2025 |
Income Statement Analysis: The Bottom-Line Duel
This income statement comparison reveals the true efficiency and profitability trajectory of two distinct corporate engines.
Fidelity National Information Services, Inc. Analysis
FIS shows a mixed revenue path, with a slight 3% growth in 2024 after a steep decline since 2020. Net income swung from heavy losses in 2022-2023 to a robust $1.45B gain in 2024. Margins improved notably, with a 37.6% gross margin and 14.3% net margin, indicating a rebound in operational efficiency and profitability momentum.
Gartner, Inc. Analysis
Gartner’s revenue steadily climbs, reaching $6.5B in 2025 with a 3.7% year-over-year rise. Gross margin remains strong at 67.7%, though EBIT and net margins slightly contracted to 15.8% and 11.2%, respectively. Despite a dip in earnings growth and net margin last year, Gartner sustains solid top-line expansion and maintains high margin quality, reflecting consistent operational control.
Margin Resilience vs. Recovery Momentum
FIS outperforms on net income turnaround and margin recovery after prior losses, signaling improved capital allocation and cost management. Gartner’s steady revenue growth and superior gross margin underscore its pricing power and scale. For investors, FIS offers a compelling rebound story, while Gartner presents a stable, high-margin profile with moderate earnings pressures.
Financial Ratios Comparison
These vital ratios act as a diagnostic tool to expose the underlying fiscal health, valuation premiums, and capital efficiency of the companies compared below:
| Ratios | Fidelity National Information Services, Inc. (FIS) | Gartner, Inc. (IT) |
|---|---|---|
| ROE | 9.24% (2024) | 92.24% (2024) |
| ROIC | 3.99% (2024) | 22.39% (2024) |
| P/E | 30.80 (2024) | 30.06 (2024) |
| P/B | 2.85 (2024) | 27.73 (2024) |
| Current Ratio | 0.85 (2024) | 1.06 (2024) |
| Quick Ratio | 0.85 (2024) | 1.06 (2024) |
| D/E (Debt/Equity) | 0.74 (2024) | 2.13 (2024) |
| Debt-to-Assets | 34.2% (2024) | 33.98% (2024) |
| Interest Coverage | 4.87x (2024) | 8.82x (2024) |
| Asset Turnover | 0.30 (2024) | 0.73 (2024) |
| Fixed Asset Turnover | 11.56 (2024) | 12.53 (2024) |
| Payout Ratio | 55.2% (2024) | 0% (2024) |
| Dividend Yield | 1.79% (2024) | 0% (2024) |
| Fiscal Year | 2024 | 2024 |
Efficiency & Valuation Duel: The Vital Signs
Financial ratios act as a company’s DNA, revealing hidden risks and operational strengths beyond surface-level earnings.
Fidelity National Information Services, Inc.
FIS shows a mixed profitability profile with a modest 9.24% ROE but a strong 14.32% net margin, indicating operational efficiency. Its valuation appears stretched, trading at a 30.8 P/E, above typical sector averages. Shareholders receive a 1.79% dividend yield, balancing modest returns with retained earnings for growth.
Gartner, Inc.
Gartner presents favorable net margins at 11.22% but reports zero ROE and ROIC, signaling potential reinvestment or accounting nuances. The P/E of 24.91 is neutral, aligning with market norms. The company pays no dividend, channeling capital into research and development, supporting long-term growth initiatives.
Profitability vs. Valuation: Risk and Reward Balance
FIS offers better operational margins but trades at a higher valuation and delivers dividends. Gartner’s lower valuation and growth reinvestment cater to investors prioritizing innovation. FIS suits income-focused investors, while Gartner fits growth-oriented profiles seeking capital appreciation.
Which one offers the Superior Shareholder Reward?
I compare Fidelity National Information Services (FIS) and Gartner, Inc. (IT) on shareholder rewards by focusing on dividends, buybacks, and sustainability. FIS pays a modest 1.79% dividend yield with a high 55% payout ratio, supported by strong free cash flow coverage at 95%. Its buyback program is moderate but consistent, contributing to total returns. Gartner pays no dividends, instead reinvesting aggressively in growth and acquisitions, reflected in zero payout and high reinvestment metrics. FIS’s distribution is sustainable in 2026 with solid cash flow and manageable debt, while Gartner’s zero payout and heavy leverage increase risk despite growth prospects. I judge FIS offers superior total shareholder reward today due to balanced income and capital return, whereas Gartner demands patience for long-term capital gains.
Comparative Score Analysis: The Strategic Profile
The radar chart exposes the fundamental DNA and trade-offs of Fidelity National Information Services, Inc. and Gartner, Inc., highlighting their financial strengths and vulnerabilities:
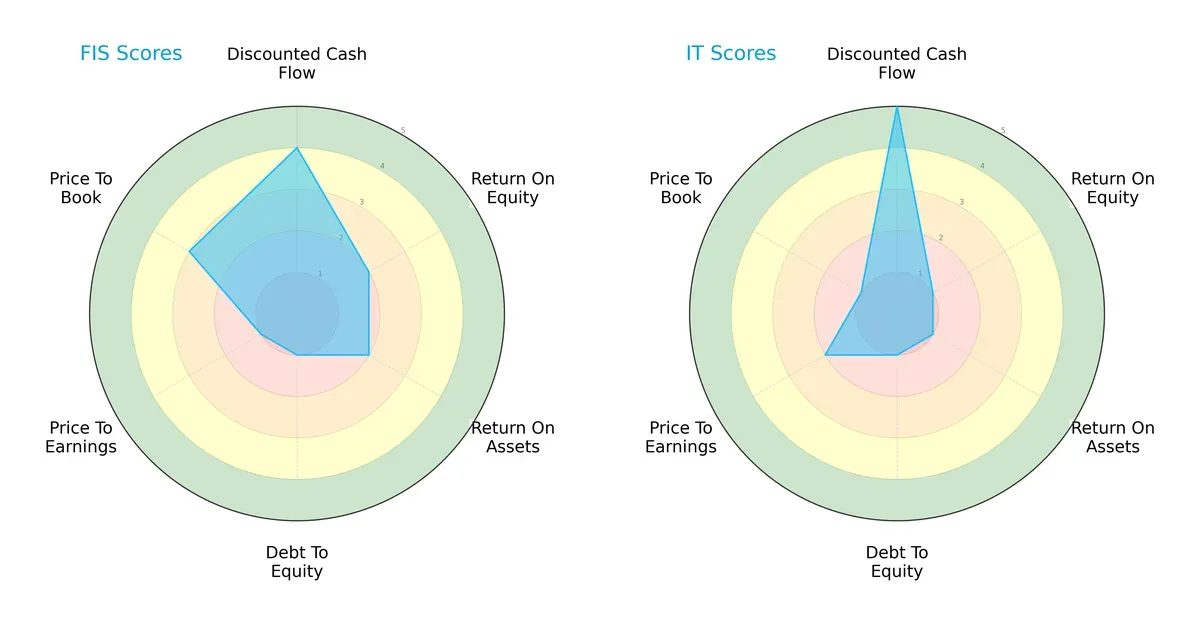
Fidelity National (FIS) shows a stronger DCF score (4 vs. 5 for Gartner) but lags in ROE and ROA (both 2 vs. Gartner’s 1), indicating moderate profitability efficiency. Both firms carry high debt risk (Debt/Equity score of 1 each), but Fidelity’s valuation metrics (PE 1 vs. 2, PB 3 vs. 1) suggest a more moderate market perception. Overall, Fidelity has a more balanced profile, while Gartner relies heavily on its superior cash flow valuation edge.
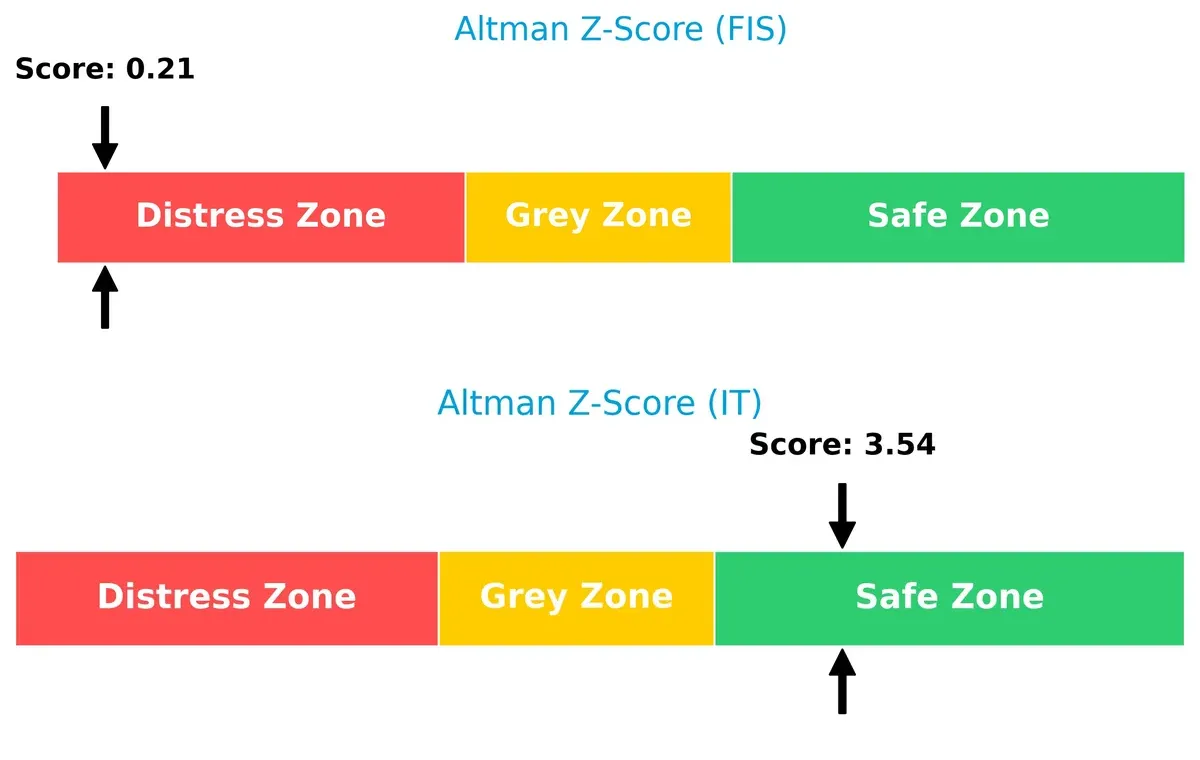
Bankruptcy Risk: Solvency Showdown
Fidelity’s Altman Z-Score of 0.21 signals severe financial distress, while Gartner’s 3.54 places it safely above bankruptcy risk thresholds in this cycle:
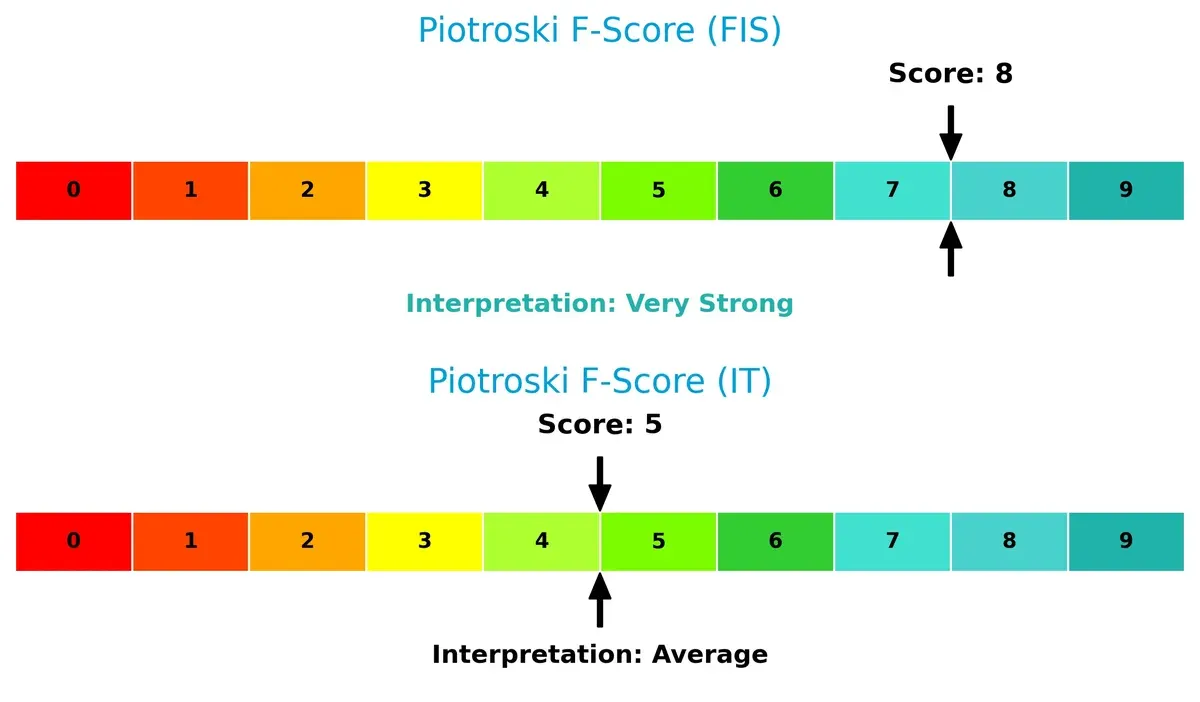
Financial Health: Quality of Operations
Fidelity’s Piotroski F-Score of 8 reflects very strong operational health, surpassing Gartner’s average score of 5, which flags potential internal weaknesses:
How are the two companies positioned?
This section dissects FIS and IT’s operational DNA by comparing their revenue distribution and internal dynamics. The goal is to confront their economic moats to reveal the most resilient, sustainable advantage.
Revenue Segmentation: The Strategic Mix
This comparison dissects how Fidelity National Information Services and Gartner diversify income streams and highlights their primary sector bets:
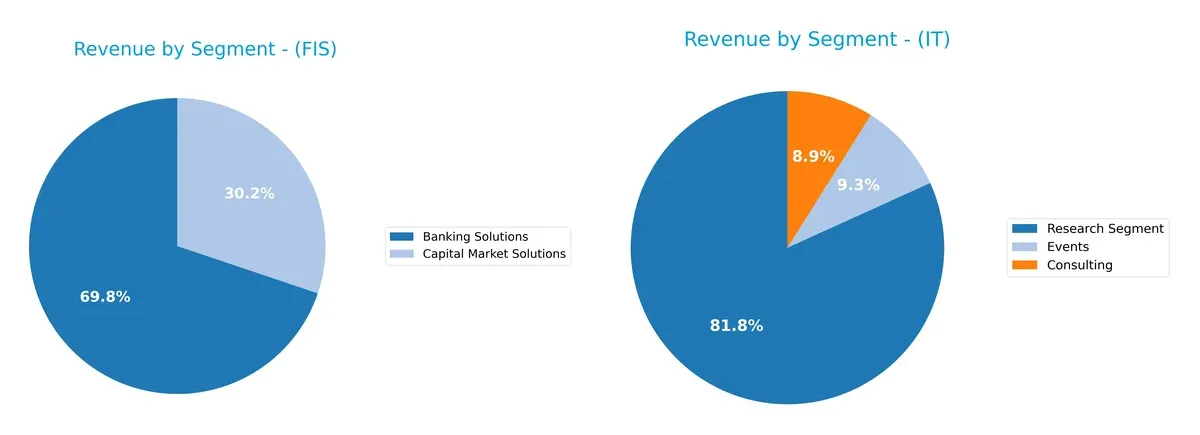
Fidelity National Information Services pivots on Banking Solutions, generating $6.9B in 2024, with Capital Market Solutions trailing at $3B. This signals a focused but dual-pronged revenue base. Gartner, Inc. dwarfs competitors with a dominant Research Segment at $5.1B, while Consulting and Events contribute modestly under $600M each. Gartner’s heavy reliance on Research creates concentration risk but cements its ecosystem lock-in. FIS’s broader mix reduces dependence on any single segment.
Strengths and Weaknesses Comparison
This table compares the Strengths and Weaknesses of Fidelity National Information Services, Inc. (FIS) and Gartner, Inc. (IT):
FIS Strengths
- Strong diversification across Banking, Capital Market, and Merchant Solutions
- Significant North American revenue base at 7.85B in 2024
- Favorable net margin at 14.32%
- Controlled debt with neutral leverage ratios
- High fixed asset turnover at 11.56 indicates efficient asset use
IT Strengths
- Diversified revenue streams from Consulting, Events, and Research segments
- Favorable debt metrics with zero debt and strong interest coverage at 16.98
- Favorable price-to-book ratio
- Global presence including Europe, Middle East, Africa, and Americas
- Favorable net margin at 11.22%
FIS Weaknesses
- Unfavorable ROE at 9.24% and ROIC at 3.99% below WACC of 6.18%
- Low current ratio at 0.85 signals liquidity concerns
- Unfavorable asset turnover at 0.3 suggests inefficiency
- Elevated P/E at 30.8 might reflect overvaluation
- Slightly unfavorable overall financial ratios
IT Weaknesses
- Unfavorable ROE and ROIC at 0%
- Unavailable WACC complicates cost of capital assessment
- Zero current and quick ratios raise liquidity red flags
- Unfavorable asset and fixed asset turnover at 0
- No dividend yield limits income potential
- Overall slightly unfavorable financial ratios
FIS exhibits a broad product and geographic footprint with solid profitability but faces efficiency and liquidity challenges. IT offers strong debt management and diversified revenue but shows concerns in returns and liquidity metrics. Both companies have slightly unfavorable overall financial ratio profiles, highlighting areas for strategic focus.
The Moat Duel: Analyzing Competitive Defensibility
A structural moat is the only durable shield protecting long-term profits from relentless competition erosion. Let’s dissect two tech giants’ moats:
Fidelity National Information Services, Inc. (FIS): Cost Advantage with Growing Profitability
FIS leverages a cost advantage through scale and integrated financial solutions, reflected in improving EBIT and net margins. Despite current value destruction, rising ROIC signals potential moat strengthening by 2026.
Gartner, Inc. (IT): Intangible Asset Moat via Research Expertise
Gartner’s moat stems from proprietary research and subscription services, creating high gross margins. However, declining ROIC and profit growth warn of weakening competitive positioning amid market shifts.
Verdict: Cost Advantage vs. Intangible Asset Durability
FIS shows a deeper, more scalable moat with improving profitability, while Gartner’s intangible moat faces pressure from declining returns. FIS is better positioned to defend and grow market share in 2026.
Which stock offers better returns?
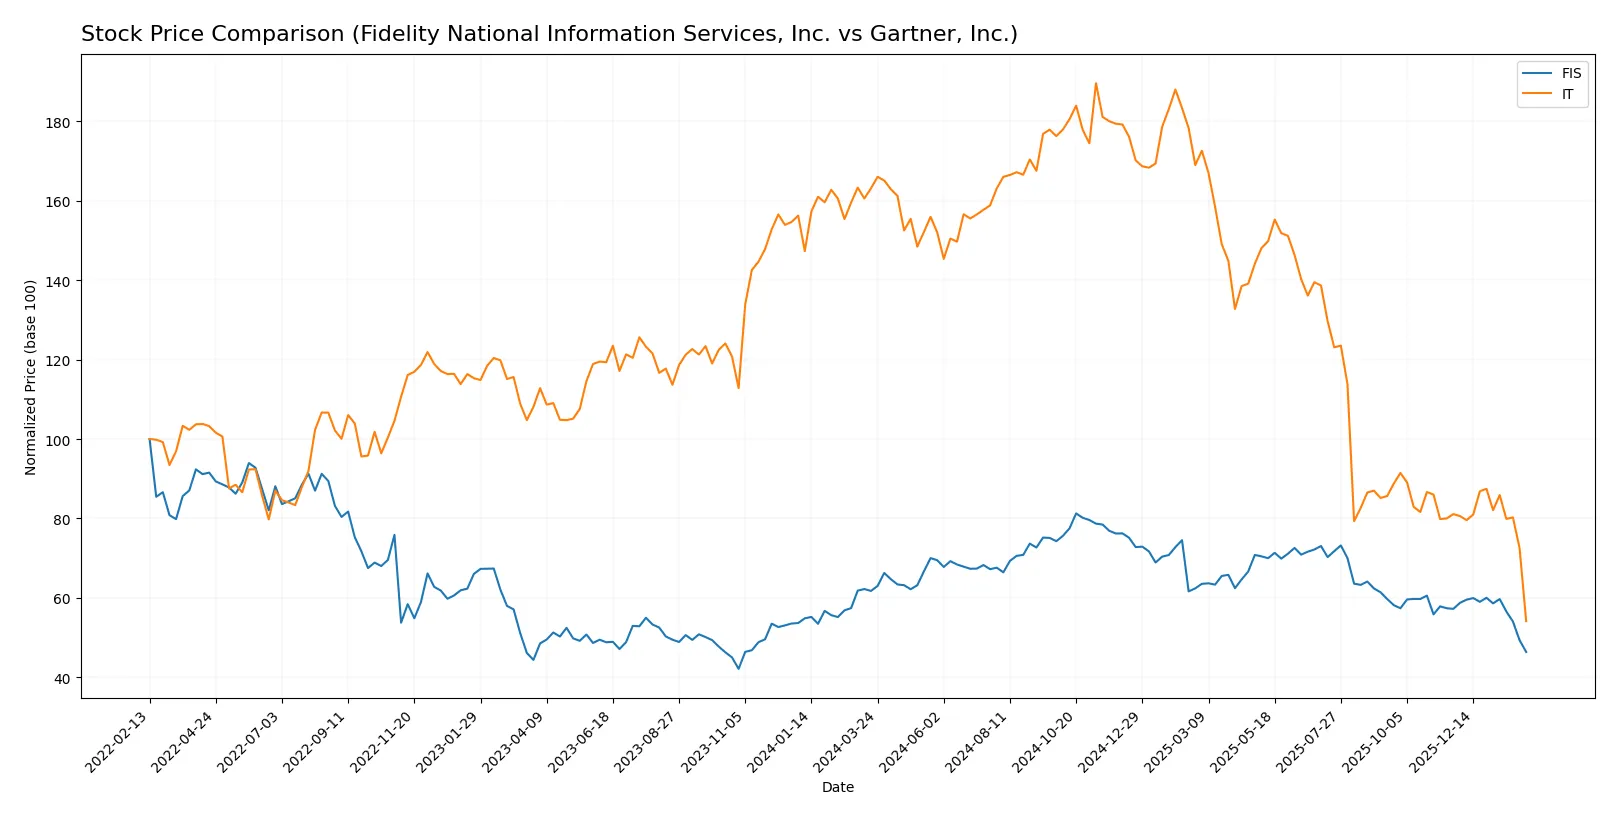
Over the past 12 months, both Fidelity National Information Services, Inc. and Gartner, Inc. showed significant price declines with distinct volatility and deceleration patterns. Trading volumes reflect contrasting buyer-seller dynamics during recent weeks.
Trend Comparison
Fidelity National Information Services, Inc. experienced a 24.87% price decrease over the past year, indicating a bearish trend with decelerating loss momentum and a moderate volatility of 7.68. The stock peaked at 90.95 and troughed at 51.93.
Gartner, Inc. saw a more severe bearish trend, with a 66.81% drop in the same period and strong deceleration in its decline. Volatility was substantially higher at 108.36, with prices ranging from 547.4 down to 156.33.
Comparing both, Fidelity National Information Services, Inc. outperformed Gartner, Inc. by delivering a smaller market loss and lower volatility throughout the analyzed 12-month period.
Target Prices
Analysts project moderate to strong upside for Fidelity National Information Services, Inc. and Gartner, Inc. based on consensus targets.
| Company | Target Low | Target High | Consensus |
|---|---|---|---|
| Fidelity National Information Services, Inc. | 69 | 85 | 75.43 |
| Gartner, Inc. | 170 | 275 | 206.3 |
For FIS, the consensus target of 75.43 represents a 45% premium to the current 51.93 stock price, signaling strong analyst confidence. Gartner’s consensus target at 206.3 implies a 32% upside from the current 156.33 price, reflecting solid growth expectations.

Don’t Let Luck Decide Your Entry Point
Optimize your entry points with our advanced ProRealTime indicators. You’ll get efficient buy signals with precise price targets for maximum performance. Start outperforming now!
How do institutions grade them?
Fidelity National Information Services, Inc. Grades
The following table summarizes recent institutional grades for FIS:
| Grading Company | Action | New Grade | Date |
|---|---|---|---|
| Truist Securities | Maintain | Hold | 2025-11-19 |
| UBS | Maintain | Buy | 2025-11-06 |
| RBC Capital | Maintain | Outperform | 2025-11-06 |
| JP Morgan | Maintain | Overweight | 2025-11-06 |
| Truist Securities | Maintain | Hold | 2025-10-24 |
| Keefe, Bruyette & Woods | Maintain | Outperform | 2025-10-01 |
| UBS | Upgrade | Buy | 2025-09-30 |
| Keefe, Bruyette & Woods | Maintain | Outperform | 2025-08-06 |
| UBS | Maintain | Neutral | 2025-08-06 |
| Truist Securities | Maintain | Hold | 2025-07-17 |
Gartner, Inc. Grades
The following table summarizes recent institutional grades for Gartner:
| Grading Company | Action | New Grade | Date |
|---|---|---|---|
| Truist Securities | Maintain | Buy | 2026-02-06 |
| Barclays | Maintain | Equal Weight | 2026-02-05 |
| Morgan Stanley | Maintain | Equal Weight | 2026-02-04 |
| Wells Fargo | Maintain | Underweight | 2026-02-04 |
| UBS | Maintain | Neutral | 2026-01-09 |
| Morgan Stanley | Maintain | Equal Weight | 2025-12-17 |
| BMO Capital | Maintain | Market Perform | 2025-11-06 |
| Wells Fargo | Maintain | Underweight | 2025-11-05 |
| Barclays | Maintain | Equal Weight | 2025-11-05 |
| Goldman Sachs | Maintain | Buy | 2025-11-05 |
Which company has the best grades?
FIS consistently receives more positive grades, including Buy, Outperform, and Overweight ratings. Gartner’s grades cluster around Equal Weight and Neutral, with some Underweight ratings. This difference suggests FIS may be viewed as having stronger near-term growth potential by institutions.
Risks specific to each company
The following categories identify the critical pressure points and systemic threats facing both firms in the 2026 market environment:
1. Market & Competition
Fidelity National Information Services, Inc. (FIS)
- Faces intense competition in payment tech and banking solutions, with pressure on margins and market share.
Gartner, Inc. (IT)
- Competes in advisory and research amid evolving client demands and digital disruption risks.
2. Capital Structure & Debt
FIS
- Moderate leverage with debt-to-assets at 34.16%, but debt-to-equity and interest coverage ratios show manageable risk.
IT
- Virtually no debt, signaling low financial risk and strong balance sheet flexibility.
3. Stock Volatility
FIS
- Beta at 0.9 indicates slightly below-market volatility, offering some stability.
IT
- Beta at 1.036 shows slightly above-market volatility, increasing risk for investors.
4. Regulatory & Legal
FIS
- Regulatory scrutiny on financial services technology and compliance risks remain significant.
IT
- Advisory business faces evolving data privacy laws and compliance challenges globally.
5. Supply Chain & Operations
FIS
- Complex global operations with risks in technology integration and service delivery consistency.
IT
- Operations rely heavily on intellectual capital; talent retention and delivery quality are critical risks.
6. ESG & Climate Transition
FIS
- Increasing pressure to enhance ESG disclosures and reduce carbon footprint in tech infrastructure.
IT
- ESG risks focused on governance and social impact, with investor scrutiny rising.
7. Geopolitical Exposure
FIS
- Global footprint in banking and payments exposes it to geopolitical tensions and regulatory changes.
IT
- International presence in advisory services subjects it to geopolitical and trade uncertainties.
Which company shows a better risk-adjusted profile?
FIS’s moderate leverage and stable stock volatility contrast with IT’s virtually debt-free position but higher volatility and regulatory risks. FIS faces its greatest risk in market competition squeezing margins. IT’s capital structure is strong, but operational and regulatory risks weigh heavily. FIS’s very strong Piotroski score contrasts with its distress-zone Altman Z-score, signaling financial health concerns. IT’s safe-zone Altman Z-score and average Piotroski score indicate better bankruptcy risk but operational vulnerabilities. Overall, IT’s low debt and safer bankruptcy risk give it a marginally better risk-adjusted profile amid evolving market pressures.
Final Verdict: Which stock to choose?
Fidelity National Information Services, Inc. (FIS) excels as a cash-generating powerhouse with improving profitability despite value erosion. Its leverage and liquidity ratios remain points of vigilance. FIS suits investors seeking aggressive growth with a tolerance for balance sheet risks amid operational recovery.
Gartner, Inc. (IT) boasts a strategic moat rooted in premium research services and recurring revenue stability. It offers a safer financial profile than FIS, supported by stronger liquidity and lower debt. IT fits portfolios focused on growth at a reasonable price, favoring steadier cash flows over rapid expansion.
If you prioritize aggressive growth fueled by improving cash flow and operational leverage, FIS is the compelling choice despite its financial risks. However, if you seek growth combined with better stability and a resilient business model, IT offers a superior safety profile though at a premium valuation. Both present slightly unfavorable risks, so aligning with your risk tolerance is key.
Disclaimer: Investment carries a risk of loss of initial capital. The past performance is not a reliable indicator of future results. Be sure to understand risks before making an investment decision.
Go Further
I encourage you to read the complete analyses of Fidelity National Information Services, Inc. and Gartner, Inc. to enhance your investment decisions: