In the fast-evolving world of financial technology, Fiserv, Inc. (FISV) and Fidelity National Information Services, Inc. (FIS) stand out as two dominant players. Both companies operate within the information technology services sector, offering innovative payment, banking, and merchant solutions that shape global commerce. Their overlapping markets and cutting-edge strategies make them natural rivals. In this article, I will analyze which company presents the most compelling investment opportunity for you.
Table of contents
Companies Overview
I will begin the comparison between Fiserv, Inc. and Fidelity National Information Services, Inc. by providing an overview of these two companies and their main differences.
Fiserv Overview
Fiserv, Inc. delivers payment and financial services technology globally, operating through Acceptance, Fintech, and Payments segments. It provides solutions like point-of-sale merchant acquiring, mobile payment services, digital banking, and card transaction processing. Founded in 1984 and headquartered in Milwaukee, Wisconsin, Fiserv serves banks, merchants, and corporate clients, emphasizing omnichannel commerce and fraud protection across its platforms.
Fidelity National Information Services Overview
Fidelity National Information Services, Inc. offers technology solutions across Merchant, Banking, and Capital Market segments. Its services include enterprise acquiring, core banking processing, digital banking solutions, fraud risk management, and securities processing. Established in 1968 and based in Jacksonville, Florida, FIS caters to merchants, banks, and capital markets firms worldwide with a broad suite of financial technology products.
Key similarities and differences
Both companies operate in the information technology services sector, focusing on financial technology solutions for banks and merchants. Fiserv emphasizes point-of-sale and digital payments with a strong presence in omnichannel commerce, while FIS provides broader merchant, banking, and capital market services including wealth and retirement solutions. Employee counts differ, with FIS employing 50K versus Fiserv’s 38K, reflecting scale and segment diversity.
Income Statement Comparison
The table below presents the most recent fiscal year income statement figures for Fiserv, Inc. and Fidelity National Information Services, Inc., providing a side-by-side financial overview.

| Metric | Fiserv, Inc. (FISV) | Fidelity National Information Services, Inc. (FIS) |
|---|---|---|
| Market Cap | 36.7B | 33.1B |
| Revenue | 20.5B | 10.1B |
| EBITDA | 8.8B | 3.4B |
| EBIT | 5.7B | 1.6B |
| Net Income | 3.1B | 1.5B |
| EPS | 5.41 | 1.42 |
| Fiscal Year | 2024 | 2024 |
Income Statement Interpretations
Fiserv, Inc.
Fiserv exhibited steady revenue growth from $14.85B in 2020 to $20.46B in 2024, with net income rising from $958M to $3.13B over the same period. Margins improved notably, with a gross margin of 60.83% and an EBIT margin of 28.08%, both favorable. In 2024, revenue growth slowed to 7.14%, but EBIT grew 17.18%, indicating improving operational efficiency despite a slight decline in net margin.
Fidelity National Information Services, Inc.
FIS’s revenue declined from $12.55B in 2020 to $10.13B in 2024, though net income swung from $158M to $787M, reflecting recovery from heavy net losses in 2022-2023. Margins remain favorable with a 37.56% gross margin and 16.27% EBIT margin. The recent year saw moderate revenue growth of 3.01%, with a robust 19.85% EBIT increase and a significant net margin improvement, suggesting operational stabilization.
Which one has the stronger fundamentals?
Both companies show favorable income statement evaluations, with Fiserv demonstrating stronger revenue growth and higher margins over five years. FIS recovered from deep losses with improving profitability metrics and margins but faces revenue contraction. Fiserv’s consistent margin expansion and net income growth contrast with FIS’s uneven revenue trend, indicating relatively stronger fundamentals for Fiserv based on income performance.
Financial Ratios Comparison
The table below presents a side-by-side comparison of key financial ratios for Fiserv, Inc. (FISV) and Fidelity National Information Services, Inc. (FIS) based on their most recent fiscal year data (2024).
| Ratios | Fiserv, Inc. (FISV) | Fidelity National Information Services, Inc. (FIS) |
|---|---|---|
| ROE | 11.57% | 9.24% |
| ROIC | 8.70% | 3.99% |
| P/E | 37.97 | 30.80 |
| P/B | 4.39 | 2.85 |
| Current Ratio | 1.06 | 0.85 |
| Quick Ratio | 1.06 | 0.85 |
| D/E (Debt-to-Equity) | 0.92 | 0.74 |
| Debt-to-Assets | 32.34% | 34.16% |
| Interest Coverage | 4.75 | 4.87 |
| Asset Turnover | 0.27 | 0.30 |
| Fixed Asset Turnover | 8.62 | 11.56 |
| Payout Ratio | 0.00 | 55.17% |
| Dividend Yield | 0.00% | 1.79% |
Interpretation of the Ratios
Fiserv, Inc.
Fiserv shows a mix of strong and weak ratios: its net margin of 15.31% and WACC at 6.11% are favorable, but high P/E at 37.97 and P/B at 4.39 are unfavorable, indicating potential overvaluation. The company maintains a neutral current ratio of 1.06 and a favorable quick ratio of 1.06, suggesting adequate liquidity. Fiserv does not pay dividends, reflecting a likely reinvestment strategy or growth focus.
Fidelity National Information Services, Inc.
Fidelity National has a favorable net margin of 14.32% and WACC of 6.54%, but unfavorable ROE at 9.24% and ROIC at 3.99%, pointing to weaker profitability. The current ratio at 0.85 is unfavorable, indicating liquidity concerns, while fixed asset turnover is favorable at 11.56. The company pays dividends with a 1.79% yield, which is neutral, suggesting moderate shareholder returns.
Which one has the best ratios?
Fiserv presents a more balanced profile with a higher proportion of favorable ratios and better liquidity metrics, while Fidelity National struggles with lower profitability ratios and liquidity. However, Fidelity’s dividend payments offer some shareholder returns absent in Fiserv. Overall, Fiserv’s ratios appear more neutral, whereas Fidelity’s lean slightly toward unfavorable.
Strategic Positioning
This section compares the strategic positioning of Fiserv, Inc. and Fidelity National Information Services, Inc., including market position, key segments, and exposure to technological disruption:
Fiserv, Inc.
- Market position and competitive pressure: Leading global provider in payment and financial technology services with diversified client base.
- Key segments and business drivers: Acceptance, Fintech, and Payments segments focusing on point-of-sale and digital payment services.
- Exposure to technological disruption: Provides cloud-based, mobile, and digital commerce solutions with security and fraud protection products.
Fidelity National Information Services, Inc.
- Major technology solutions provider for merchants, banks, and capital markets facing broad competitive pressure.
- Operates Merchant, Banking, and Capital Market Solutions, emphasizing core processing and financial services.
- Offers digital banking, fraud management, and electronic funds transfer, adapting to evolving financial tech.
Fiserv, Inc. vs Fidelity National Information Services, Inc. Positioning
Fiserv has a diversified approach with segments in Acceptance, Fintech, and Payments, supporting broad payment technologies. FIS concentrates on Merchant, Banking, and Capital Market Solutions, focusing on core financial processing and capital market services, each with specific market advantages and challenges.
Which has the best competitive advantage?
Fiserv demonstrates a very favorable economic moat with ROIC exceeding WACC by 2.59% and growing profitability, indicating a durable competitive advantage. FIS shows slightly unfavorable moat status, shedding value despite improving ROIC, suggesting weaker competitive positioning.
Stock Comparison
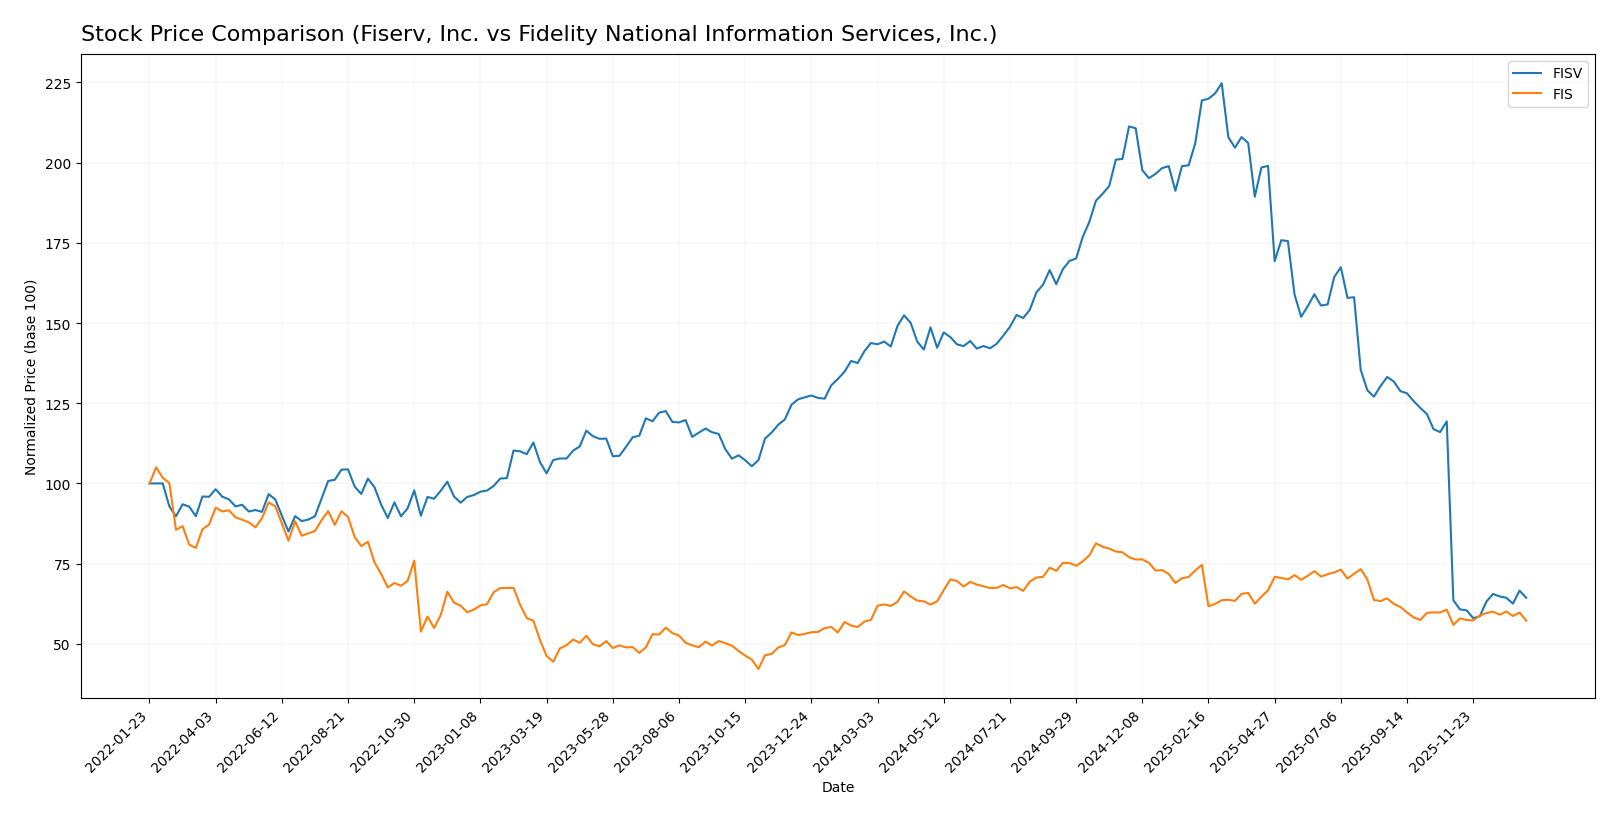
The stock prices of Fiserv, Inc. (FISV) and Fidelity National Information Services, Inc. (FIS) have shown contrasting movements over the past year, with FISV experiencing a strong bearish trend and FIS maintaining a near-neutral but slightly bearish trajectory.
Trend Analysis
Fiserv, Inc. (FISV) recorded a -55.23% price decline over the past 12 months, indicating a bearish trend with acceleration. The stock showed high volatility, peaking at 235.69 and bottoming at 60.84. Recent weeks showed a mild 1.21% recovery.
Fidelity National Information Services, Inc. (FIS) experienced a marginal -0.47% price change over the same period, reflecting a bearish but near-neutral trend with acceleration. Price varied between 90.95 and 62.52, with a recent 2.34% uptick.
Comparing the two, FIS delivered the higher market performance over the past year, with its price remaining relatively stable versus the significant decline observed in FISV.
Target Prices
Analysts present a mixed but cautiously optimistic target consensus for these two tech service giants.
| Company | Target High | Target Low | Consensus |
|---|---|---|---|
| Fiserv, Inc. | 180 | 62 | 111.39 |
| Fidelity National Information Services, Inc. | 82 | 69 | 75.5 |
Fiserv’s consensus target of 111.39 is significantly above its current price of 67.5, suggesting potential upside. Fidelity National’s consensus target of 75.5 also exceeds its current 63.98 share price, indicating moderate growth expectations.
Analyst Opinions Comparison
This section compares analysts’ ratings and grades for Fiserv, Inc. and Fidelity National Information Services, Inc.:
Rating Comparison
FISV Rating
- Rating: B+ indicating a very favorable overall evaluation.
- Discounted Cash Flow Score: 5, very favorable, suggesting undervaluation.
- ROE Score: 4, favorable efficiency in generating profit from equity.
- ROA Score: 3, moderate asset utilization effectiveness.
- Debt To Equity Score: 1, very unfavorable, indicating higher financial risk.
- Overall Score: 3, moderate overall financial standing.
FIS Rating
- Rating: C+ with a very favorable overall evaluation.
- Discounted Cash Flow Score: 4, favorable, indicating potential undervaluation.
- ROE Score: 2, moderate efficiency in generating profit from equity.
- ROA Score: 2, moderate asset utilization effectiveness.
- Debt To Equity Score: 1, very unfavorable, indicating higher financial risk.
- Overall Score: 2, moderate overall financial standing.
Which one is the best rated?
Based strictly on the provided data, FISV holds a higher rating of B+ compared to FIS’s C+, supported by stronger discounted cash flow and return on equity scores. Both share the same unfavorable debt-to-equity score.
Scores Comparison
Here is a comparison of the Altman Z-Score and Piotroski Score for Fiserv, Inc. and Fidelity National Information Services, Inc.:
Fiserv, Inc. Scores
- Altman Z-Score: 1.41, in distress zone indicating higher bankruptcy risk.
- Piotroski Score: 7, categorized as strong financial health.
Fidelity National Information Services, Inc. Scores
- Altman Z-Score: 0.46, in distress zone indicating even higher bankruptcy risk.
- Piotroski Score: 8, categorized as very strong financial health.
Which company has the best scores?
FIS has a lower Altman Z-Score than FISV, both in distress zones, but a higher Piotroski Score indicating stronger financial health. Based strictly on these scores, FIS shows stronger financial health.
Grades Comparison
Here is the comparison of the latest reliable grades for Fiserv, Inc. and Fidelity National Information Services, Inc.:
Fiserv, Inc. Grades
The table below lists recent grades assigned by reputable financial institutions to Fiserv, Inc.:
| Grading Company | Action | New Grade | Date |
|---|---|---|---|
| Tigress Financial | Maintain | Buy | 2025-12-31 |
| Mizuho | Maintain | Outperform | 2025-12-22 |
| Goldman Sachs | Downgrade | Neutral | 2025-10-30 |
| Bernstein | Downgrade | Market Perform | 2025-10-30 |
| Argus Research | Downgrade | Hold | 2025-10-30 |
| Morgan Stanley | Downgrade | Equal Weight | 2025-10-30 |
| Truist Securities | Downgrade | Hold | 2025-10-30 |
| JP Morgan | Maintain | Overweight | 2025-10-30 |
| Citigroup | Maintain | Neutral | 2025-10-30 |
| RBC Capital | Maintain | Outperform | 2025-10-30 |
Fiserv’s grades show a mix of maintained positive ratings and several downgrades from Buy/Outperform to Neutral/Hold in late 2025, reflecting some caution.
Fidelity National Information Services, Inc. Grades
The table below presents recent grades for Fidelity National Information Services, Inc.:
| Grading Company | Action | New Grade | Date |
|---|---|---|---|
| Truist Securities | Maintain | Hold | 2025-11-19 |
| RBC Capital | Maintain | Outperform | 2025-11-06 |
| JP Morgan | Maintain | Overweight | 2025-11-06 |
| UBS | Maintain | Buy | 2025-11-06 |
| Truist Securities | Maintain | Hold | 2025-10-24 |
| Keefe, Bruyette & Woods | Maintain | Outperform | 2025-10-01 |
| UBS | Upgrade | Buy | 2025-09-30 |
| UBS | Maintain | Neutral | 2025-08-06 |
| Keefe, Bruyette & Woods | Maintain | Outperform | 2025-08-06 |
| Truist Securities | Maintain | Hold | 2025-07-17 |
Fidelity National Information Services displays a consistent pattern of maintained positive ratings, including several Outperform and Buy grades, with no downgrades reported recently.
Which company has the best grades?
Fidelity National Information Services holds a more stable and predominantly positive grading profile with consistent Outperform and Buy ratings, whereas Fiserv, Inc. experienced multiple downgrades to Neutral and Hold. This difference may influence investor confidence regarding near-term performance expectations.
Strengths and Weaknesses
Below is a comparison table highlighting the key strengths and weaknesses of Fiserv, Inc. (FISV) and Fidelity National Information Services, Inc. (FIS) based on recent financial and strategic data.
| Criterion | Fiserv, Inc. (FISV) | Fidelity National Information Services, Inc. (FIS) |
|---|---|---|
| Diversification | Strong revenue mix with processing and payments segments exceeding $20B in 2024 | Focused on banking and capital market solutions, about $9.9B revenue in 2024 |
| Profitability | Net margin of 15.31% (favorable), ROIC 8.7% (neutral), consistently creating value | Net margin 14.32% (favorable), ROIC 3.99% (unfavorable), currently shedding value |
| Innovation | Demonstrates durable competitive advantage, growing ROIC trend at 235% | ROIC improving but still below WACC, slightly unfavorable moat status |
| Global presence | Extensive global payment and fintech services presence | Strong in banking and capital markets globally, but less diverse product range |
| Market Share | Leading in payment processing and services segments | Strong in banking solutions but lower overall market footprint |
Key takeaway: Fiserv shows a more diversified and profitable business model with a very favorable economic moat and strong value creation, making it a more stable choice. FIS is improving but still faces challenges in profitability and market diversification.
Risk Analysis
Below is a comparison of the key risks for Fiserv, Inc. (FISV) and Fidelity National Information Services, Inc. (FIS) based on the most recent 2024 data.
| Metric | Fiserv, Inc. (FISV) | Fidelity National Information Services, Inc. (FIS) |
|---|---|---|
| Market Risk | Beta 0.80 (lower volatility) | Beta 0.94 (moderate volatility) |
| Debt Level | Debt-to-Equity ~0.92 (neutral) | Debt-to-Equity ~0.74 (neutral) |
| Regulatory Risk | Moderate (financial services sector) | Moderate (financial services sector) |
| Operational Risk | Medium (complex fintech products) | Medium (diverse IT and capital market solutions) |
| Environmental Risk | Low (technology sector focus) | Low (technology sector focus) |
| Geopolitical Risk | Moderate (global payment networks) | Moderate (global client base exposure) |
Fiserv and Fidelity National face similar moderate operational and regulatory risks inherent to the financial technology sector. Fiserv’s slightly lower beta indicates marginally less market volatility risk. Both have manageable debt levels, but FIS’s distressed Altman Z-score suggests higher financial distress risk. Investors should prioritize monitoring financial stability and market shifts impacting fintech innovation.
Which Stock to Choose?
Fiserv, Inc. (FISV) shows favorable income growth with a 37.73% revenue increase over 2020-2024 and strong profitability, including a 15.31% net margin. Its financial ratios are mostly neutral with some favorable aspects, and it maintains moderate debt levels. The company holds a very favorable B+ rating and demonstrates a very favorable moat with ROIC exceeding WACC.
Fidelity National Information Services, Inc. (FIS) reports more modest revenue growth, with a 3.01% increase in 2024 and a favorable net margin of 14.32%. Its financial ratios are slightly unfavorable overall, with some weaknesses in ROE and ROIC, and it carries a similar debt profile. The company has a C+ rating, slightly unfavorable global ratios, and a slightly unfavorable moat, indicating value destruction despite improving profitability.
Considering ratings and financial evaluations, Fiserv might appeal to investors seeking companies with durable competitive advantages and stable profitability. Conversely, Fidelity National Information Services may appear more suitable for those who focus on potential turnaround stories or tolerate higher risk amid improving trends in profitability and cash flow.
Disclaimer: Investment carries a risk of loss of initial capital. The past performance is not a reliable indicator of future results. Be sure to understand risks before making an investment decision.
Go Further
I encourage you to read the complete analyses of Fiserv, Inc. and Fidelity National Information Services, Inc. to enhance your investment decisions: