Home > Comparison > Industrials > FDX vs JBHT
The strategic rivalry between FedEx Corporation and J.B. Hunt Transport Services defines the current trajectory of the integrated freight and logistics sector. FedEx operates as a capital-intensive global freight giant with a broad service portfolio, while J.B. Hunt focuses on specialized surface transportation and logistics solutions with a leaner asset base. This analysis pits FedEx’s scale against J.B. Hunt’s operational agility to identify which offers superior risk-adjusted returns for a diversified portfolio.
Table of contents
Companies Overview
FedEx Corporation and J.B. Hunt Transport Services, Inc. both shape the US integrated freight and logistics landscape with distinct scale and strategy.
FedEx Corporation: Global Logistics Powerhouse
FedEx dominates the integrated freight and logistics sector through express transportation and ground delivery services. Its revenue engine spans express shipping, less-than-truckload freight, and supply chain solutions. In 2026, FedEx sharpens focus on cross-border e-commerce and technology-driven logistics, leveraging a vast fleet and 400 service centers to maintain its competitive edge.
J.B. Hunt Transport Services, Inc.: Surface Freight Specialist
J.B. Hunt leads in surface transportation and logistics across North America with intermodal, dedicated, and final mile services. It monetizes via diversified segments including intermodal freight and freight brokerage. Its 2026 strategy prioritizes integrated capacity solutions and expanding dedicated contract services to optimize supply chains using a large fleet of company-owned trucks and trailers.
Strategic Collision: Similarities & Divergences
Both companies emphasize integrated logistics but differ deeply: FedEx pursues a global, technology-driven express model, while J.B. Hunt focuses on flexible, surface-based capacity solutions. Their primary battleground is efficient, scalable freight delivery across complex supply chains. FedEx offers a broad, multinational footprint; J.B. Hunt specializes in North American surface logistics, creating distinct risk and growth profiles for investors.
Income Statement Comparison
This data dissects the core profitability and scalability of both corporate engines to reveal who dominates the bottom line:
| Metric | FedEx Corporation (FDX) | J.B. Hunt Transport Services, Inc. (JBHT) |
|---|---|---|
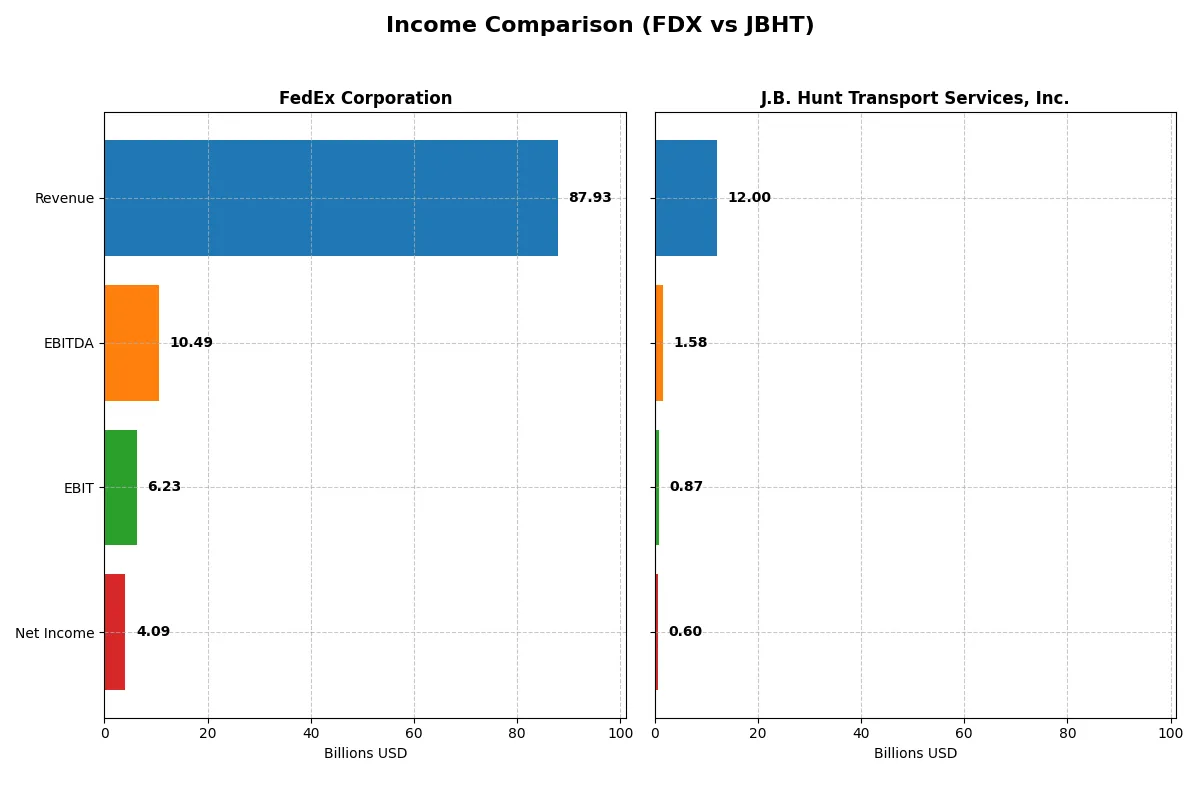
| Revenue | 87.9B | 12.0B |
| Cost of Revenue | 68.9B | 10.7B |
| Operating Expenses | 12.9B | 397M |
| Gross Profit | 19.0B | 1.3B |
| EBITDA | 10.5B | 1.6B |
| EBIT | 6.2B | 865M |
| Interest Expense | 789M | 71M |
| Net Income | 4.1B | 598M |
| EPS | 16.96 | 6.12 |
| Fiscal Year | 2025 | 2025 |
Income Statement Analysis: The Bottom-Line Duel
This income statement comparison reveals how efficiently FedEx and J.B. Hunt convert revenue into profit and manage their operating costs.
FedEx Corporation Analysis
FedEx’s revenue has remained nearly flat around 88B in 2025, with net income declining to 4.1B from 4.3B in 2024. Its gross margin holds steady at 21.6%, but net margin shrinks to 4.65%, reflecting margin pressure. The slight revenue growth masks a 5.3% EBIT decline, signaling waning operational efficiency in 2025.
J.B. Hunt Transport Services, Inc. Analysis
J.B. Hunt’s revenue dropped 0.7% to 12B in 2025, with net income rising to 598M from 571M, lifting net margin to 4.99%. Gross margin erodes sharply by nearly 39%, but EBIT and net margin improve modestly, showing controlled expense management despite top-line softness and margin compression.
Margin Resilience vs. Revenue Stability
FedEx delivers stronger revenues and maintains a higher gross margin, but faces declining net income and EBIT, indicating margin erosion and efficiency challenges. J.B. Hunt shows better net margin growth and expense control despite shrinking revenue and gross profit. For investors, FedEx offers scale but with margin risks; J.B. Hunt presents a leaner profile with improving profitability metrics.
Financial Ratios Comparison
These vital ratios act as a diagnostic tool to expose the underlying fiscal health, valuation premiums, and capital efficiency of the companies compared below:
| Ratios | FedEx Corporation (FDX) | J.B. Hunt Transport Services, Inc. (JBHT) |
|---|---|---|
| ROE | 14.58% | — |
| ROIC | 6.00% | — |
| P/E | 12.95 | 31.73 |
| P/B | 1.89 | 0 |
| Current Ratio | 1.19 | 0 |
| Quick Ratio | 1.15 | 0 |
| D/E (Debt to Equity) | 1.33 | 0 |
| Debt-to-Assets | 42.70% | 0 |
| Interest Coverage | 7.71 | 12.19 |
| Asset Turnover | 1.00 | 0 |
| Fixed Asset Turnover | 1.51 | 0 |
| Payout Ratio | 32.72% | 28.74% |
| Dividend Yield | 2.53% | 0.91% |
| Fiscal Year | 2025 | 2025 |
*Note: JBHT shows zero or missing values for several liquidity and leverage ratios in 2025 data.*
Efficiency & Valuation Duel: The Vital Signs
Financial ratios act as a company’s DNA, exposing hidden risks and operational excellence beneath surface numbers.
FedEx Corporation
FedEx shows moderate profitability with a 14.58% ROE and a slightly low 4.65% net margin, signaling operational challenges. The P/E ratio of 12.95 suggests the stock trades at a reasonable valuation. A 2.53% dividend yield indicates a commitment to shareholder returns, balancing growth and income.
J.B. Hunt Transport Services, Inc.
J.B. Hunt’s valuation appears stretched with a high P/E of 31.73 and unfavorable profitability metrics, including a 0% ROE. The net margin of 4.99% is marginally better but still weak. Minimal dividend yield of 0.91% underlines limited shareholder returns amid cautious reinvestment.
Valuation Discipline vs. Profitability Concerns
FedEx offers a better balance of moderate valuation and profitability compared to J.B. Hunt’s stretched price and weak returns. Investors prioritizing valuation discipline may favor FedEx, while those seeking growth must weigh J.B. Hunt’s higher risk profile.
Which one offers the Superior Shareholder Reward?
I see FedEx delivers a higher dividend yield around 2.5% with a moderate payout ratio near 33%. The company sustains this with robust free cash flow of roughly 12.3/share and ongoing buybacks, supporting long-term returns. J.B. Hunt yields under 1%, with a similar payout ratio but lacks visible buyback data and shows weaker free cash flow metrics. FedEx balances dividends and buybacks more sustainably, producing a stronger total shareholder return in 2026. I conclude FedEx offers the superior shareholder reward given its disciplined capital allocation and payout stability.
Comparative Score Analysis: The Strategic Profile
The radar chart reveals the fundamental DNA and trade-offs of FedEx Corporation and J.B. Hunt Transport Services, Inc., highlighting their core financial strengths and vulnerabilities:
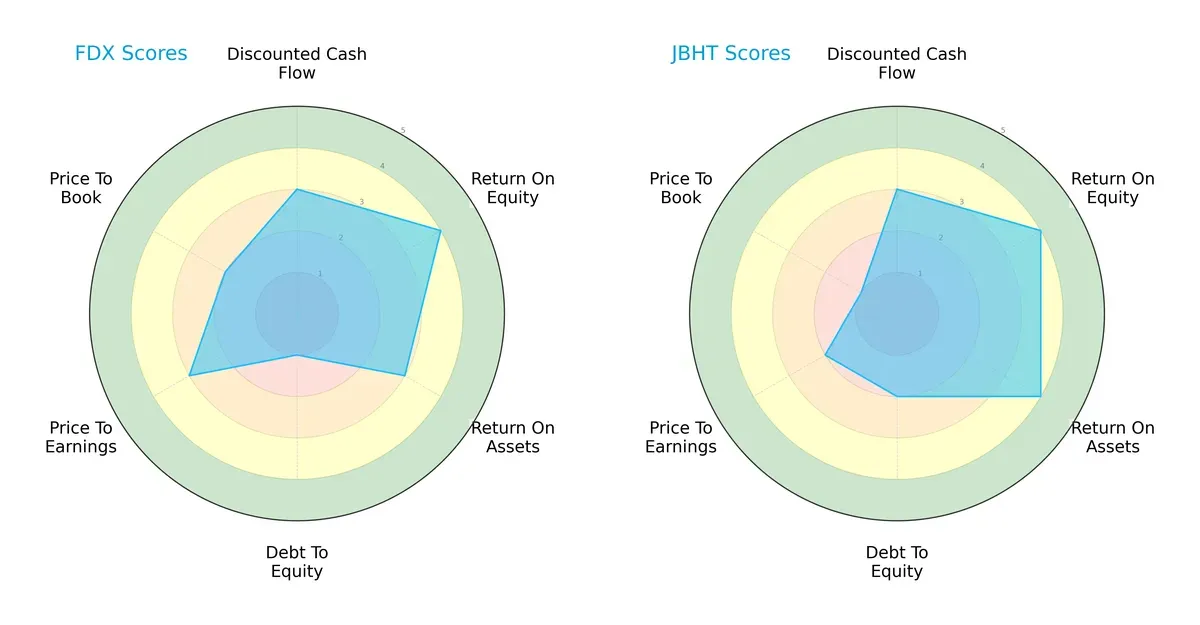
FedEx and J.B. Hunt both score a balanced 3 overall, but their profiles diverge. FedEx excels in ROE (4) but carries a very unfavorable debt-to-equity score (1), signaling high leverage risk. J.B. Hunt matches FedEx’s ROE (4) and outperforms in ROA (4) with a moderate debt-to-equity score (2). Valuation scores favor FedEx slightly on P/E (3 vs. 2), but J.B. Hunt lags significantly on P/B (1 vs. 2). J.B. Hunt’s profile is more balanced with operational efficiency and moderate leverage, while FedEx leans heavily on equity returns but carries financial risk.
Bankruptcy Risk: Solvency Showdown
The Altman Z-Score comparison shows a critical solvency gap between the two firms:
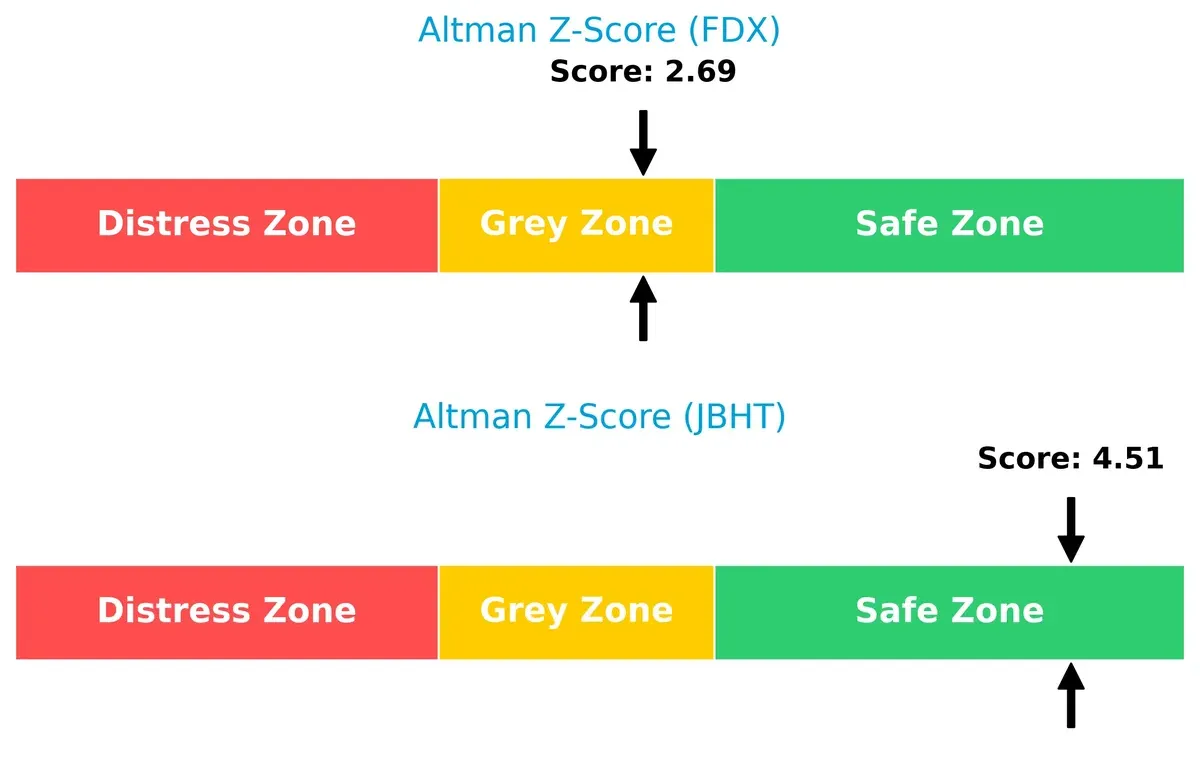
J.B. Hunt scores 4.51, safely in the “safe zone,” signaling strong long-term survival prospects. FedEx’s 2.69 places it in the “grey zone,” indicating moderate bankruptcy risk during economic stress. This contrast highlights J.B. Hunt’s superior financial stability amid market cycles.
Financial Health: Quality of Operations
Both companies exhibit robust financial health with identical Piotroski F-Scores of 7, denoting strong internal metrics:
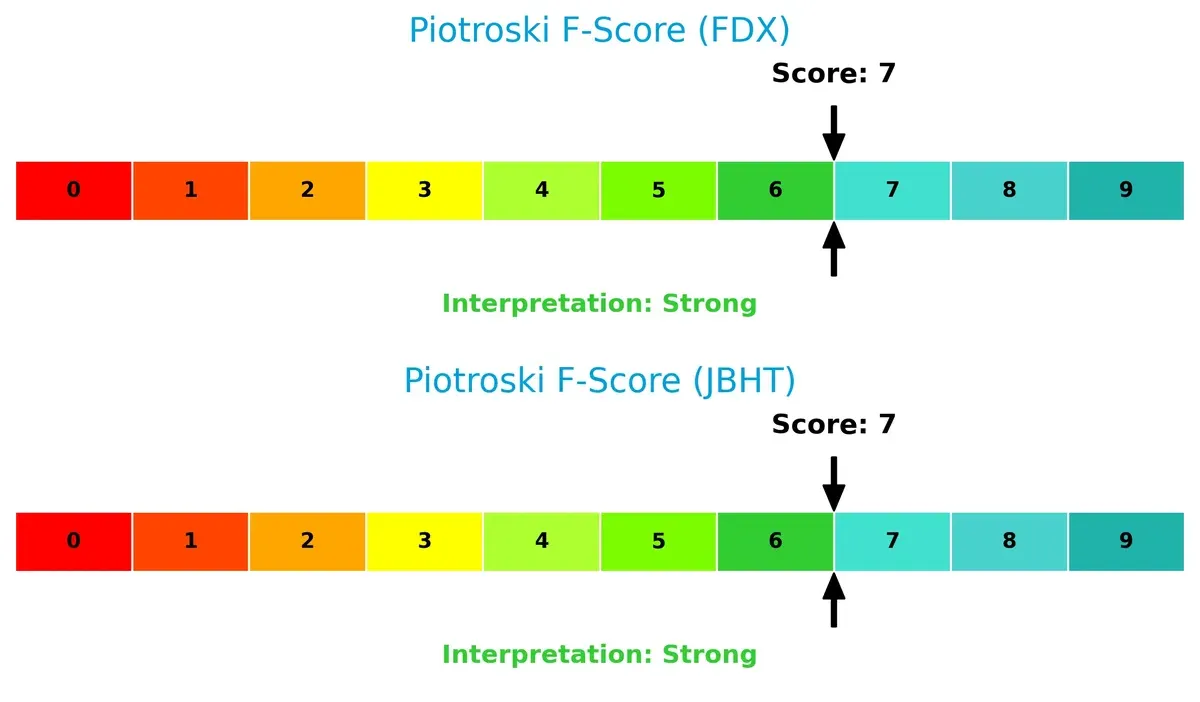
These scores indicate solid profitability, leverage management, and operational efficiency. Neither company shows immediate red flags, but the identical scores suggest that internal financial quality is comparable despite differences in capital structure and solvency risk.
How are the two companies positioned?
This section dissects the operational DNA of FedEx and J.B. Hunt by comparing their revenue distribution and internal dynamics. The goal is to confront their economic moats and identify which model offers the most resilient, sustainable competitive advantage today.
Revenue Segmentation: The Strategic Mix
The following visual comparison dissects how FedEx Corporation and J.B. Hunt Transport Services diversify their income streams and where their primary sector bets lie:
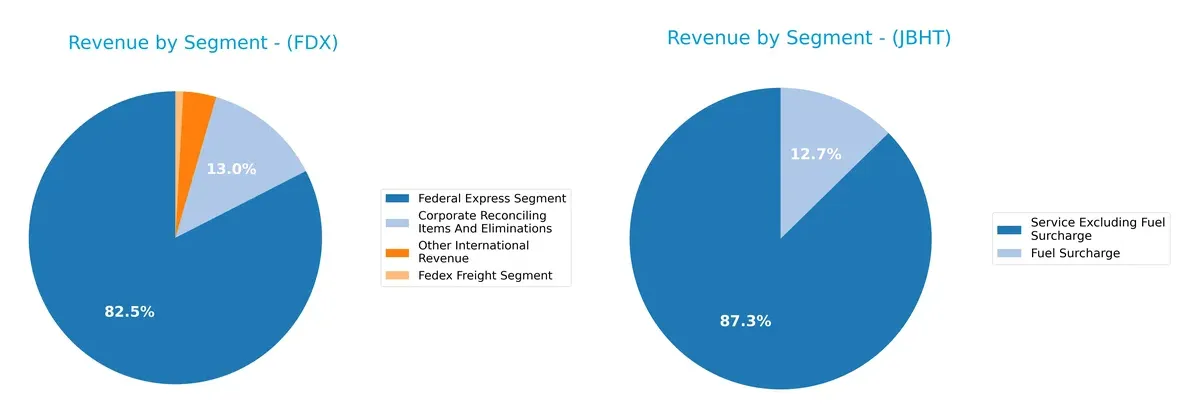
FedEx pivots on its Fedex Express Segment with $23.7B in 2025, dwarfing its smaller freight and international revenues. This signals a reliance on global express logistics and infrastructure dominance. Conversely, J.B. Hunt presents a more concentrated mix, with $10.6B in services excluding fuel surcharge and $1.5B in fuel surcharge revenue in 2024, highlighting a focus on core transport services with less diversification but strong operational specialization.
Strengths and Weaknesses Comparison
This table compares the strengths and weaknesses of FedEx and J.B. Hunt based on diversification, profitability, financials, innovation, global presence, and market share:
FedEx Strengths
- Diversified segments including express, freight, ground, and international revenues
- Favorable WACC and P/E ratios indicating efficient capital use
- Strong global presence with significant U.S. and non-U.S. revenues
- Solid interest coverage and asset turnover ratios
- Dividend yield above 2.5% supports income investors
J.B. Hunt Strengths
- Favorable debt metrics with no leverage concerns
- Strong interest coverage ratio of 12.19
- Favorable price-to-book ratio suggests market undervaluation relative to assets
- Segment revenues show steady service income growth
- Operational focus on core transport services
FedEx Weaknesses
- Unfavorable net margin and debt-to-equity ratio highlight profitability and leverage risks
- Neutral ROIC below WACC suggests capital allocation challenges
- Moderate current ratio limits liquidity cushion
- Elevated debt levels compared to assets
- Complex corporate eliminations affect segment clarity
J.B. Hunt Weaknesses
- Unfavorable and zero ROE and ROIC indicate weak profitability and capital returns
- Unavailable WACC complicates cost of capital assessment
- Zero current and quick ratios signify liquidity concerns
- High P/E suggests potential overvaluation risk
- Unfavorable asset and fixed asset turnover point to operational inefficiency
- Low dividend yield limits income appeal
FedEx exhibits diversified revenue streams and solid financial metrics but faces profitability and leverage pressures. J.B. Hunt shows strong leverage management but struggles with profitability and liquidity, which may constrain strategic flexibility.
The Moat Duel: Analyzing Competitive Defensibility
A structural moat is the only reliable shield protecting long-term profits from relentless competition erosion. Let’s dissect the competitive edges of FedEx and J.B. Hunt:
FedEx Corporation: Intangible Assets and Global Scale
FedEx’s moat stems from its vast global network and brand reputation, reflected in relatively stable margins despite industry pressures. However, declining ROIC signals increasing capital inefficiency, raising concerns for 2026’s growth outlook.
J.B. Hunt Transport Services, Inc.: Operational Efficiency and Network Integration
J.B. Hunt leverages operational scale and integrated logistics solutions, driving marginally better profitability trends than FedEx. Yet, absent ROIC data and revenue headwinds cloud its moat durability and expansion prospects.
Global Network vs. Integrated Operations: The Competitive Moat Battle
FedEx’s intangible assets and global reach form a wider moat but are weakened by declining capital returns. J.B. Hunt’s operational focus offers niche strength but lacks clear value creation metrics. FedEx remains better positioned to defend market share despite challenges.
Which stock offers better returns?
The past year saw FedEx’s stock rally 30.11%, showing accelerating gains with a high near 322.25. J.B. Hunt’s price edged up 1.06%, reflecting limited growth despite steady volume increases.
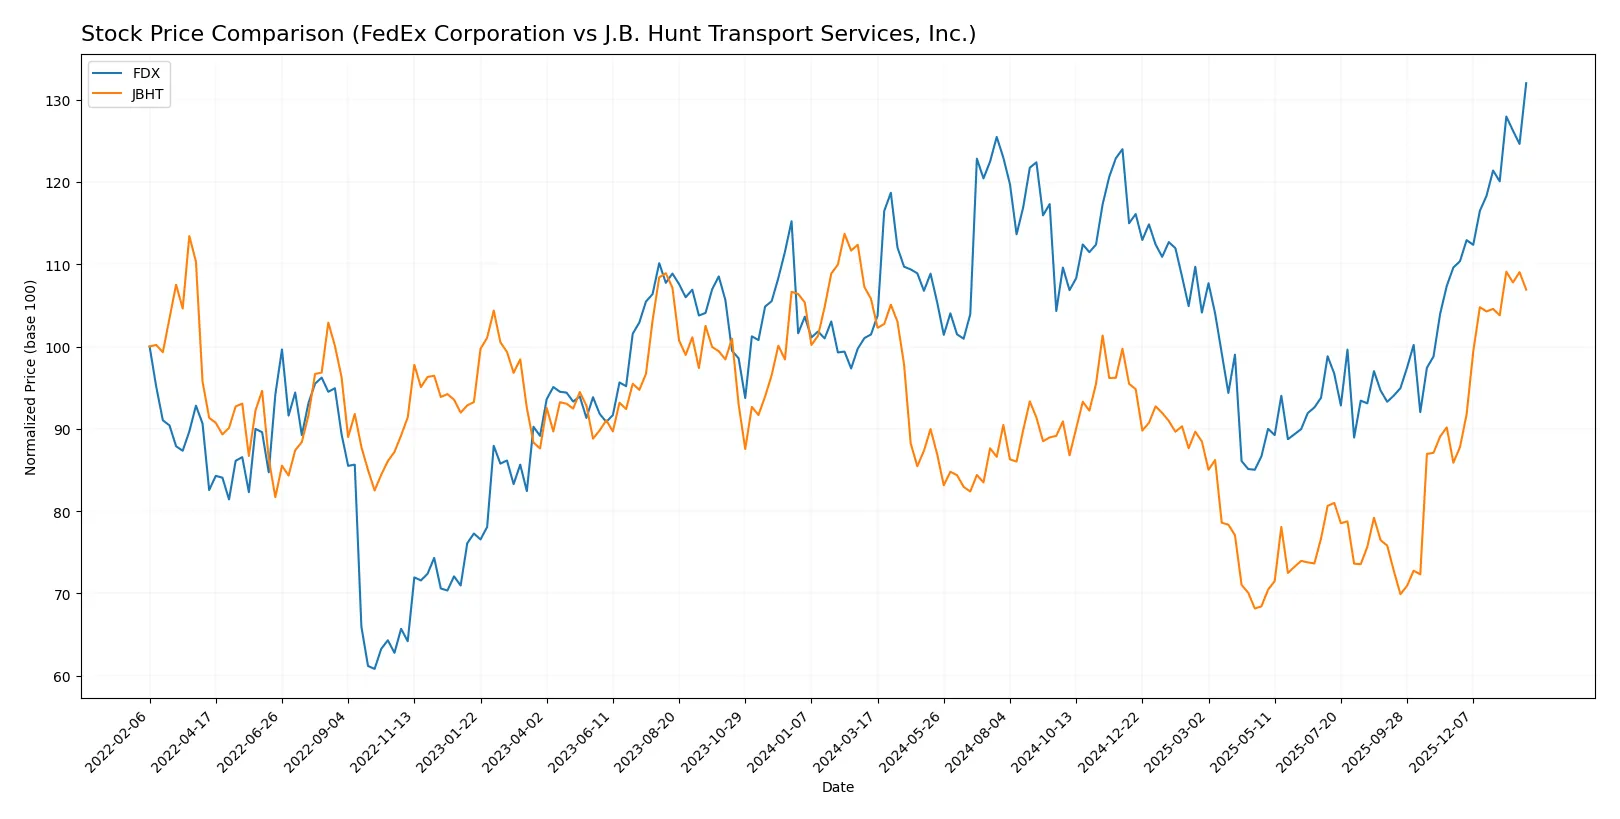
Trend Comparison
FedEx’s stock gained 30.11% over the past 12 months, signaling a strong bullish trend with accelerating momentum and price volatility marked by a 28.04 standard deviation.
J.B. Hunt’s stock rose 1.06% over the same period, indicating a neutral trend with modest acceleration but lower volatility at a 20.04 standard deviation.
FedEx’s stock delivered substantially higher returns than J.B. Hunt’s, outperforming by nearly 29 percentage points in market performance.
Target Prices
Analysts present a balanced target consensus for FedEx Corporation and J.B. Hunt Transport Services, reflecting moderate upside potential.
| Company | Target Low | Target High | Consensus |
|---|---|---|---|
| FedEx Corporation | 210 | 355 | 294.07 |
| J.B. Hunt Transport Services, Inc. | 150 | 240 | 195 |
FedEx’s consensus target of 294.07 sits below its current price of 322.25, signaling limited upside or possible overvaluation. J.B. Hunt’s consensus target of 195 is slightly below its current 202.72 price, suggesting a neutral to cautious outlook from analysts.

Don’t Let Luck Decide Your Entry Point
Optimize your entry points with our advanced ProRealTime indicators. You’ll get efficient buy signals with precise price targets for maximum performance. Start outperforming now!
How do institutions grade them?
The following tables summarize the latest reliable grades assigned to FedEx Corporation and J.B. Hunt Transport Services, Inc.:
FedEx Corporation Grades
The table below shows recent grades for FedEx Corporation from established financial institutions.
| Grading Company | Action | New Grade | Date |
|---|---|---|---|
| Rothschild & Co | Downgrade | Neutral | 2026-01-21 |
| Bernstein | Maintain | Market Perform | 2026-01-09 |
| Jefferies | Maintain | Buy | 2025-12-19 |
| Morgan Stanley | Maintain | Underweight | 2025-12-19 |
| JP Morgan | Maintain | Neutral | 2025-12-19 |
| BMO Capital | Maintain | Market Perform | 2025-12-19 |
| Truist Securities | Maintain | Buy | 2025-12-19 |
| Wells Fargo | Maintain | Equal Weight | 2025-12-19 |
| Stephens & Co. | Maintain | Overweight | 2025-12-19 |
| B of A Securities | Maintain | Neutral | 2025-12-19 |
J.B. Hunt Transport Services, Inc. Grades
The table below lists recent grades for J.B. Hunt Transport Services, Inc. from credible grading firms.
| Grading Company | Action | New Grade | Date |
|---|---|---|---|
| Benchmark | Maintain | Buy | 2026-01-20 |
| Stifel | Maintain | Hold | 2026-01-16 |
| UBS | Maintain | Neutral | 2026-01-16 |
| Barclays | Maintain | Equal Weight | 2026-01-15 |
| Truist Securities | Maintain | Hold | 2026-01-15 |
| Stifel | Maintain | Hold | 2026-01-14 |
| Evercore ISI Group | Maintain | Outperform | 2026-01-13 |
| JP Morgan | Maintain | Overweight | 2026-01-12 |
| Bernstein | Maintain | Market Perform | 2026-01-09 |
| Citigroup | Downgrade | Neutral | 2026-01-08 |
Which company has the best grades?
J.B. Hunt Transport Services holds generally stronger ratings, including multiple Buy and Outperform grades. FedEx shows a mix of Neutral and Buy grades but also some Underweight ratings. This divergence may influence investor perception of relative risk and potential returns.
Risks specific to each company
The following categories identify critical pressure points and systemic threats facing FedEx Corporation and J.B. Hunt Transport Services in the 2026 market environment:
1. Market & Competition
FedEx Corporation
- Faces intense competition from integrated logistics firms globally, pressuring margins.
J.B. Hunt Transport Services, Inc.
- Competes primarily in North America with strong intermodal and dedicated services presence.
2. Capital Structure & Debt
FedEx Corporation
- High debt-to-equity ratio (1.33) signals leverage risk despite solid interest coverage.
J.B. Hunt Transport Services, Inc.
- Maintains a low debt profile, enhancing financial flexibility and lowering solvency risk.
3. Stock Volatility
FedEx Corporation
- Beta at 1.357 indicates higher sensitivity to market swings than the broader market.
J.B. Hunt Transport Services, Inc.
- Slightly lower beta of 1.27 suggests marginally less stock price volatility.
4. Regulatory & Legal
FedEx Corporation
- Must navigate complex international transport regulations and customs compliance.
J.B. Hunt Transport Services, Inc.
- Primarily exposed to U.S. domestic regulatory risks, reducing complexity.
5. Supply Chain & Operations
FedEx Corporation
- Large asset base (30,000 vehicles) requires efficient management amid rising operational costs.
J.B. Hunt Transport Services, Inc.
- Extensive fleet and logistics network focused on intermodal and dedicated segments provide operational resilience.
6. ESG & Climate Transition
FedEx Corporation
- Faces increasing pressure to reduce carbon footprint across global operations.
J.B. Hunt Transport Services, Inc.
- Emerging initiatives in sustainable logistics but less exposed internationally.
7. Geopolitical Exposure
FedEx Corporation
- Global operations expose FedEx to geopolitical tensions and trade disruptions.
J.B. Hunt Transport Services, Inc.
- Concentrated North American focus limits geopolitical risks.
Which company shows a better risk-adjusted profile?
FedEx’s highest risk lies in its leveraged capital structure amid global regulatory complexity. J.B. Hunt’s main concern is weaker profitability metrics and operational scale. Overall, J.B. Hunt presents a better risk-adjusted profile, supported by lower leverage and safer Altman Z-Score (4.51 vs. 2.69). However, FedEx’s global reach provides growth opportunities if it manages debt prudently.
Final Verdict: Which stock to choose?
FedEx’s superpower lies in its operational scale and cash flow generation, enabling resilience in volatile markets. Its point of vigilance is the weakening return on invested capital, signaling value destruction that could pressure future profitability. This stock suits investors targeting long-term value with a tolerance for cyclical risk.
J.B. Hunt’s strategic moat stems from efficient asset utilization and a solid balance sheet, which offer superior financial stability relative to FedEx. Its recurring revenue elements and leaner capital structure appeal to those seeking steadier growth. This name fits portfolios focused on growth at a reasonable price with moderate risk.
If you prioritize scale and cash flow muscle, FedEx is compelling despite its declining returns, given its market position. However, if you seek better financial stability and operational efficiency, J.B. Hunt offers a safer growth profile, albeit at a premium valuation. Both represent distinct paths depending on your risk appetite and investment horizon.
Disclaimer: Investment carries a risk of loss of initial capital. The past performance is not a reliable indicator of future results. Be sure to understand risks before making an investment decision.
Go Further
I encourage you to read the complete analyses of FedEx Corporation and J.B. Hunt Transport Services, Inc. to enhance your investment decisions: