Home > Comparison > Real Estate > SPG vs FRT
The strategic rivalry between Simon Property Group and Federal Realty Investment Trust shapes the retail REIT landscape. Simon operates as a capital-intensive global retail real estate giant, while Federal Realty specializes in high-quality coastal urban retail mixed-use properties. This analysis pits scale against niche market expertise, contrasting broad diversification with concentrated community-focused growth. I will determine which corporate model offers superior risk-adjusted returns for diversified portfolios amid evolving retail real estate dynamics.

Table of contents
Companies Overview
Simon Property Group and Federal Realty Investment Trust are key players in the US retail REIT sector.
Simon Property Group, Inc.: Premier Global Retail REIT
Simon Property Group dominates ownership of premier shopping, dining, and entertainment destinations across North America, Europe, and Asia. Its core revenue engine stems from leasing to retailers and managing high-traffic mixed-use properties. In 2026, Simon focuses on expanding its footprint in experiential retail and mixed-use developments to capture evolving consumer behavior.
Federal Realty Investment Trust: Coastal Urban Retail Innovator
Federal Realty specializes in high-quality retail properties in major coastal markets, blending retail with residential and office spaces. Its revenue comes from leasing diverse tenants within vibrant, mixed-use neighborhoods like Santana Row and Assembly Row. The company’s 2026 strategy centers on sustainable growth through urban redevelopment where retail demand outpaces supply, reinforcing community-centric destinations.
Strategic Collision: Similarities & Divergences
Both firms excel in retail real estate but differ in scale and approach. Simon operates a broad, global portfolio emphasizing large-scale mixed-use destinations, while Federal Realty targets coastal urban neighborhoods with a community-focused redevelopment strategy. They compete primarily for retail tenants seeking high foot traffic. Their distinct investment profiles reflect Simon’s global dominance versus Federal Realty’s niche in sustainable urban retail innovation.
Income Statement Comparison
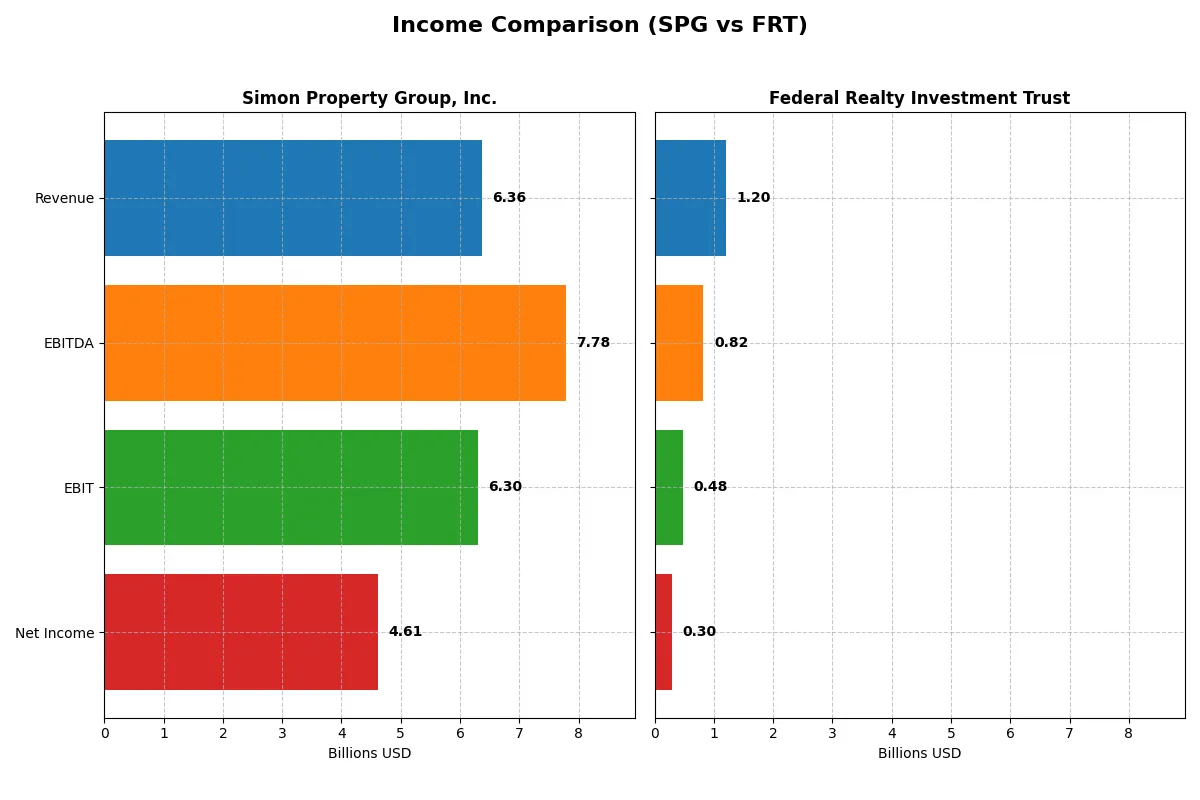
This data dissects the core profitability and scalability of both corporate engines to reveal who dominates the bottom line:
| Metric | Simon Property Group, Inc. (SPG) | Federal Realty Investment Trust (FRT) |
|---|---|---|
| Revenue | 6.36B | 1.20B |
| Cost of Revenue | 909M | 392M |
| Operating Expenses | 2.28B | 338M |
| Gross Profit | 5.46B | 811M |
| EBITDA | 7.78B | 822M |
| EBIT | 6.30B | 480M |
| Interest Expense | 975M | 175M |
| Net Income | 4.61B | 295M |
| EPS | 14.14 | 3.42 |
| Fiscal Year | 2025 | 2024 |
Income Statement Analysis: The Bottom-Line Duel
This income statement comparison uncovers which company runs a more efficient and robust profit engine in challenging market cycles.
Simon Property Group, Inc. Analysis
Simon Property Group shows a steady revenue climb, reaching 6.36B in 2025, with net income surging to 4.61B. Gross and net margins remain remarkably strong at 85.7% and 72.5%, respectively. The latest year exhibits powerful momentum in EBIT and EPS growth, reflecting highly effective cost control despite rising interest expenses.
Federal Realty Investment Trust Analysis
Federal Realty posts a moderate revenue increase to 1.20B in 2024 with net income at 295M. Its gross margin of 67.4% and net margin of 24.6% indicate decent profitability but much lower efficiency than Simon Property Group. The company sustains steady EBIT and net margin growth, showing operational improvements and disciplined expense management.
Verdict: Margin Dominance vs. Steady Growth
Simon Property Group outpaces Federal Realty with superior profitability margins and explosive net income growth over the last year. While Federal Realty delivers solid revenue gains and margin expansion, Simon’s exceptional margin power and bottom-line efficiency mark it as the fundamental winner. Investors seeking robust profit engines will find Simon’s profile more attractive.
Financial Ratios Comparison
These vital ratios act as a diagnostic tool to expose the underlying fiscal health, valuation premiums, and capital efficiency of the companies compared below:
| Ratios | Simon Property Group, Inc. (SPG) | Federal Realty Investment Trust (FRT) |
|---|---|---|
| ROE | 88.6% | 9.31% |
| ROIC | 8.55% | 5.75% |
| P/E | 13.1 | 31.7 |
| P/B | 11.6 | 2.95 |
| Current Ratio | 0.16 | 1.16 |
| Quick Ratio | 0.16 | 1.16 |
| D/E (Debt/Equity) | 5.75 | 1.44 |
| Debt-to-Assets | 73.7% | 53.5% |
| Interest Coverage | 3.26 | 2.69 |
| Asset Turnover | 0.157 | 0.141 |
| Fixed Asset Turnover | 0.205 | 13.0 |
| Payout Ratio | 60.4% | 125.9% |
| Dividend Yield | 4.62% | 3.97% |
| Fiscal Year | 2025 | 2024 |
Efficiency & Valuation Duel: The Vital Signs
Ratios act as the company’s DNA, revealing hidden risks and operational excellence critical for assessing investment quality and durability.
Simon Property Group, Inc.
Simon Property Group exhibits a robust 88.6% ROE and a strong 72.5% net margin, signaling high profitability. The stock trades at a reasonable P/E of 13.1, yet an elevated PB of 11.6 suggests premium pricing on equity. A 4.62% dividend yield rewards shareholders, reflecting steady income amid moderate reinvestment.
Federal Realty Investment Trust
Federal Realty shows lower profitability with a 9.3% ROE and 24.6% net margin, indicating more modest returns. Its P/E of 31.7 signals a stretched valuation compared to Simon. The dividend yield at 3.97% complements a focus on maintaining operational efficiency, evidenced by a favorable fixed asset turnover ratio of 13.0.
Premium Valuation vs. Operational Safety
Simon Property balances superior profitability and shareholder yield with some financial leverage risks, while Federal Realty offers a neutral risk profile but at a higher price multiple. Investors prioritizing robust returns and income may prefer Simon’s profile; those valuing operational efficiency and moderate risk might lean toward Federal Realty.
Which one offers the Superior Shareholder Reward?
Simon Property Group (SPG) delivers a higher dividend yield near 4.6% with a payout ratio around 60%, supported by stable free cash flow. Its buyback activity, however, appears limited, potentially due to high leverage (debt-to-equity over 5.7x). Federal Realty Investment Trust (FRT) offers a lower dividend yield near 4%, but it balances dividends with modest buybacks and maintains healthier leverage (debt-to-equity ~1.4x). FRT’s payout ratio exceeds 125%, signaling risk to dividend sustainability. I view SPG’s disciplined dividend backed by free cash flow as more sustainable, despite its leverage. FRT’s aggressive payout and weaker cash flow coverage raise red flags. Therefore, I conclude SPG offers a superior total shareholder return profile in 2026.
Comparative Score Analysis: The Strategic Profile
The radar chart reveals the fundamental DNA and trade-offs of Simon Property Group and Federal Realty Investment Trust, highlighting their financial strengths and weaknesses:
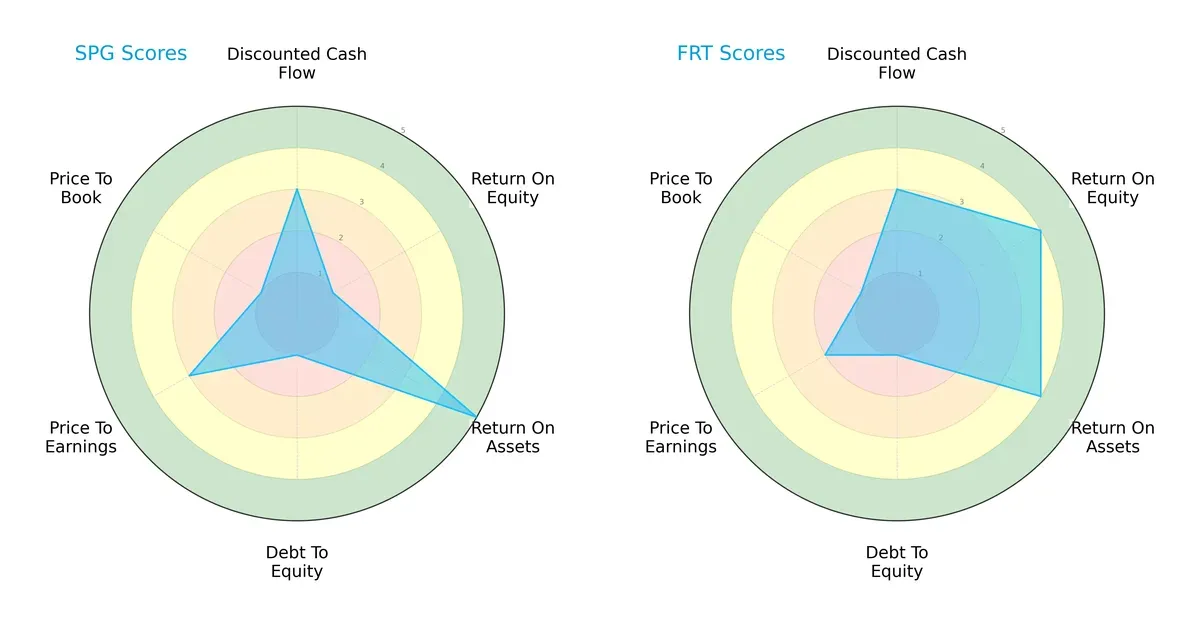
Simon Property Group (SPG) and Federal Realty (FRT) share moderate DCF scores (3). FRT excels in ROE (4 vs. 1) and ROA (4 vs. 5), showing more consistent profitability. SPG’s ROA leads but its heavy debt load (debt/equity score 1) and weak valuation metrics (P/B score 1) expose vulnerability. FRT presents a more balanced profile, relying on solid equity returns rather than leverage. SPG depends on asset efficiency but suffers from financial risk and valuation concerns.
Bankruptcy Risk: Solvency Showdown
Both Simon Property Group and Federal Realty Investment Trust fall within the Altman Z-Score distress zone, signaling elevated bankruptcy risk in this cycle:
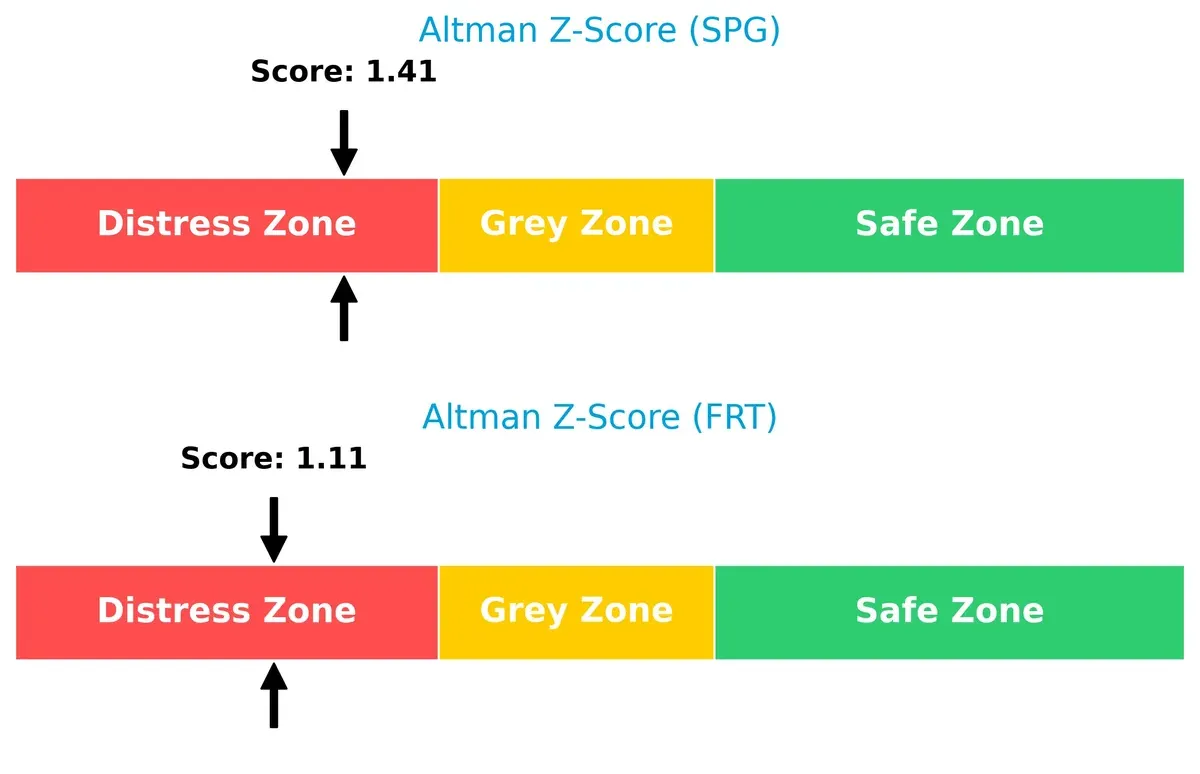
Their low Z-scores (SPG 1.41; FRT 1.11) warn investors of fragile solvency. Neither firm currently commands a safe margin against financial distress, underscoring sector-wide pressure and the need for cautious risk management.
Financial Health: Quality of Operations
Simon Property Group and Federal Realty Investment Trust both score a strong 7 on the Piotroski F-Score, indicating solid operational quality and financial strength:

These scores reflect robust profitability, liquidity, and efficiency metrics. Neither company shows glaring red flags internally, suggesting resilient fundamentals despite external financial risks. This operational strength provides some buffer against market volatility.
How are the two companies positioned?
This section dissects the operational DNA of SPG and FRT by comparing their revenue distribution and internal dynamics. The goal is to confront their economic moats to reveal which model offers the most resilient competitive advantage today.
Revenue Segmentation: The Strategic Mix
The following visual comparison dissects how Simon Property Group and Federal Realty Investment Trust diversify their income streams and where their primary sector bets lie:
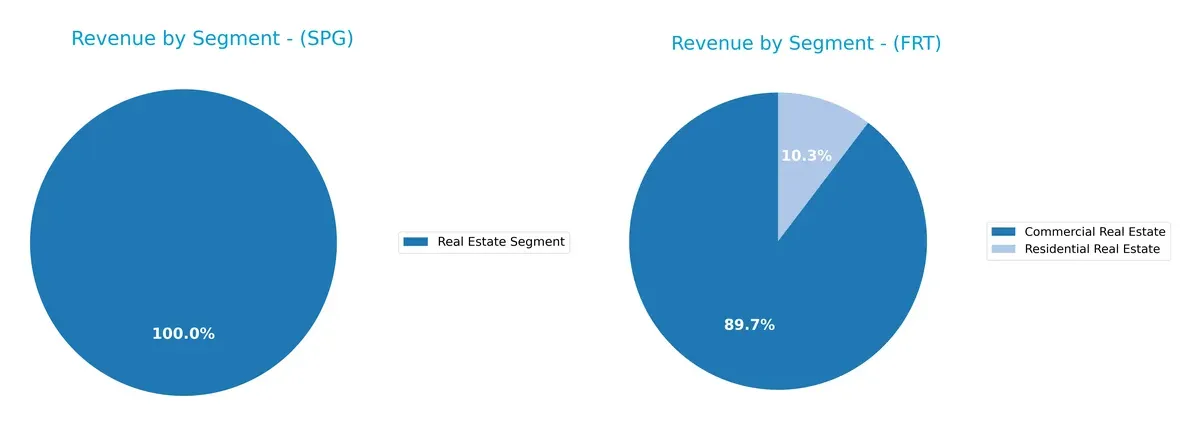
Simon Property Group anchors its revenue with a massive $5.54B from a single Real Estate segment, reflecting strong sector focus but raising concentration risk. Federal Realty Investment Trust pivots on Commercial Real Estate at $616M, supplemented by $71M in Residential Real Estate, showing a more diversified mix. This diversification may buffer FRT against sector volatility, while SPG’s scale dominates but depends heavily on one market segment.
Strengths and Weaknesses Comparison
This table compares the strengths and weaknesses of Simon Property Group, Inc. (SPG) and Federal Realty Investment Trust (FRT):
SPG Strengths
- High net margin at 72.51%
- Strong return on equity at 88.61%
- Favorable interest coverage at 6.46x
- Significant dividend yield at 4.62%
- Solid real estate revenue of $5.54B
- Established European presence with $1.5B+ revenue
FRT Strengths
- Favorable net margin at 24.55%
- Neutral to favorable ROIC at 5.75%
- Low WACC at 6.92%
- Favorable quick ratio at 1.16
- High fixed asset turnover at 13.01
- Diversified revenue in commercial and residential real estate
- Dividend yield at 3.97%
SPG Weaknesses
- Low current and quick ratios at 0.16 indicating liquidity risk
- High debt-to-assets at 73.74%
- Elevated debt-to-equity at 5.75
- Unfavorable price-to-book ratio at 11.59
- Low asset and fixed asset turnover
- Slightly unfavorable overall financial ratio profile
FRT Weaknesses
- Unfavorable return on equity at 9.31%
- Unfavorable PE ratio at 31.69
- Moderate debt-to-equity at 1.44 and debt-to-assets at 53.51%
- Neutral interest coverage at 2.73
- Unfavorable asset turnover at 0.14
- No reported international revenue
Both companies show profitability strengths but face challenges in liquidity and leverage. SPG’s large scale and international presence contrast with FRT’s more diversified product mix but limited geographic reach. These factors shape their strategic priorities in balancing growth, risk, and capital efficiency.
The Moat Duel: Analyzing Competitive Defensibility
A structural moat is the only reliable shield protecting long-term profits from relentless competitive erosion in retail real estate:
Simon Property Group, Inc.: Scale and Market Dominance Moat
Simon’s competitive edge lies in its unparalleled portfolio scale and premier retail destinations, driving high gross margins near 86%. Its slight ROIC advantage signals improving profitability. Expansion in Europe and Asia could deepen this moat in 2026.
Federal Realty Investment Trust: Niche Urban Redevelopment Moat
Federal Realty’s moat stems from specialized urban mixed-use developments in high-demand coastal markets. Despite a weaker ROIC relative to cost of capital, its focused strategy drives steady margin growth and expansion opportunities in vibrant communities.
Scale Dominance vs. Urban Niche: The Battle of Real Estate Moats
Simon Property Group holds a wider moat through scale and margin stability, while Federal Realty’s niche focus offers depth but less capital efficiency. Simon is better positioned to defend market share amid rising competition.
Which stock offers better returns?
The past year saw Simon Property Group, Inc. (SPG) and Federal Realty Investment Trust (FRT) both posting bullish trends, with SPG showing stronger acceleration and higher volatility.
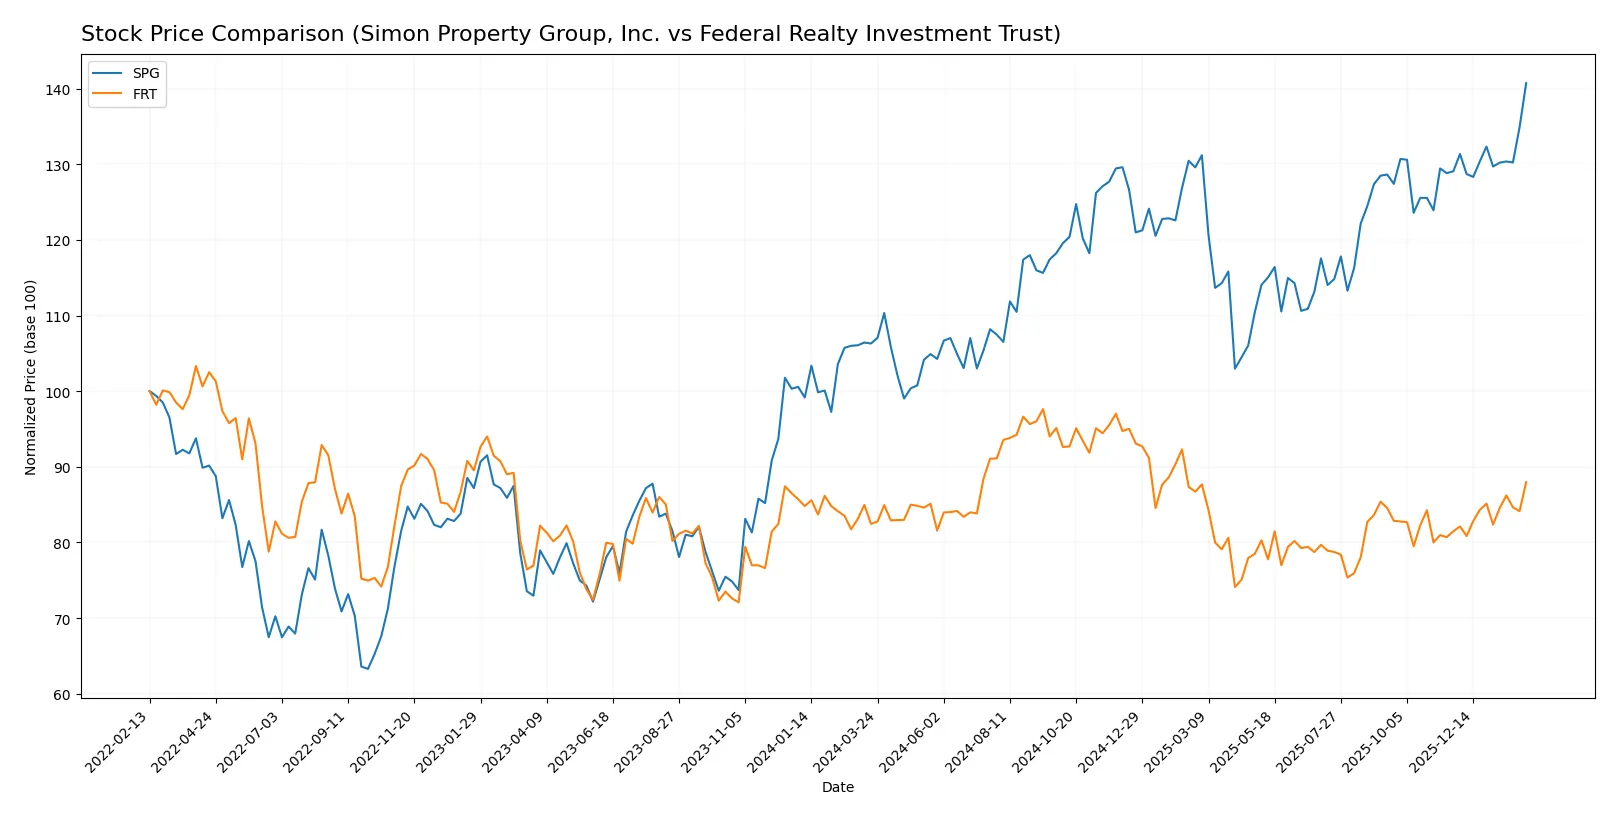
Trend Comparison
Simon Property Group’s stock rose 32.39% over 12 months, marking a bullish trend with accelerating growth and a high standard deviation of 13.86. The stock hit a high of 199.6 and a low of 140.44.
Federal Realty Investment Trust increased 6.7% over the same period, also bullish with acceleration but lower volatility at a standard deviation of 7.19. Its price ranged between 89.09 and 117.39.
SPG outperformed FRT significantly in market returns, delivering more than four times the price appreciation and showing stronger momentum across the analyzed period.
Target Prices
Analysts provide a clear target price consensus for Simon Property Group and Federal Realty Investment Trust.
| Company | Target Low | Target High | Consensus |
|---|---|---|---|
| Simon Property Group, Inc. | 173 | 230 | 194.6 |
| Federal Realty Investment Trust | 105 | 115 | 109.17 |
Simon Property Group’s target consensus at 194.6 sits slightly below its current price of 199.6, suggesting limited upside. Federal Realty’s consensus of 109.17 aligns closely with its 105.76 current price, indicating a steady outlook.

Don’t Let Luck Decide Your Entry Point
Optimize your entry points with our advanced ProRealTime indicators. You’ll get efficient buy signals with precise price targets for maximum performance. Start outperforming now!
How do institutions grade them?
The following tables summarize recent institutional grades for Simon Property Group, Inc. and Federal Realty Investment Trust:
Simon Property Group, Inc. Grades
This table shows up-to-date grades from major financial institutions for SPG.
| Grading Company | Action | New Grade | Date |
|---|---|---|---|
| JP Morgan | Maintain | Neutral | 2026-02-06 |
| Citigroup | Maintain | Neutral | 2026-02-05 |
| Evercore ISI Group | Maintain | In Line | 2026-02-03 |
| Piper Sandler | Maintain | Overweight | 2026-02-03 |
| Stifel | Maintain | Hold | 2026-02-03 |
| Scotiabank | Maintain | Sector Perform | 2026-01-14 |
| UBS | Maintain | Neutral | 2026-01-08 |
| Truist Securities | Maintain | Hold | 2025-12-17 |
| Citigroup | Maintain | Neutral | 2025-11-26 |
| Barclays | Maintain | Equal Weight | 2025-11-18 |
Federal Realty Investment Trust Grades
The following data lists current institutional ratings for FRT from credible sources.
| Grading Company | Action | New Grade | Date |
|---|---|---|---|
| Scotiabank | Maintain | Sector Outperform | 2026-01-14 |
| JP Morgan | Upgrade | Overweight | 2025-12-18 |
| Jefferies | Upgrade | Buy | 2025-12-16 |
| Truist Securities | Maintain | Hold | 2025-12-02 |
| Barclays | Downgrade | Equal Weight | 2025-11-18 |
| Evercore ISI Group | Maintain | In Line | 2025-11-03 |
| Wells Fargo | Maintain | Overweight | 2025-10-21 |
| Evercore ISI Group | Maintain | In Line | 2025-10-17 |
| Barclays | Maintain | Overweight | 2025-10-16 |
| Barclays | Maintain | Overweight | 2025-10-06 |
Which company has the best grades?
Federal Realty Investment Trust holds a generally more favorable rating profile than Simon Property Group, Inc. FRT’s multiple upgrades and sector outperform status signal stronger institutional confidence. This may influence investors seeking growth and positive momentum.
Risks specific to each company
The following categories identify the critical pressure points and systemic threats facing both firms in the 2026 market environment:
1. Market & Competition
Simon Property Group, Inc.
- Dominates premier shopping destinations globally but faces pressure from evolving retail trends and e-commerce.
Federal Realty Investment Trust
- Focuses on urban mixed-use neighborhoods in coastal markets, competing in high-demand but saturated areas.
2. Capital Structure & Debt
Simon Property Group, Inc.
- High debt-to-equity ratio (5.75) and 74% debt-to-assets raise financial risk despite strong interest coverage.
Federal Realty Investment Trust
- Lower leverage than SPG but still elevated (debt-to-equity 1.44, debt-to-assets 54%), signaling moderate financial risk.
3. Stock Volatility
Simon Property Group, Inc.
- Beta at 1.40 indicates above-market volatility, amplifying risk in turbulent markets.
Federal Realty Investment Trust
- Beta near 1.02 suggests market-level volatility, offering more stable price movements.
4. Regulatory & Legal
Simon Property Group, Inc.
- Exposure to multi-jurisdictional regulations across North America, Europe, and Asia increases compliance complexity.
Federal Realty Investment Trust
- Concentrated in major U.S. coastal markets, facing stricter local zoning and environmental regulations.
5. Supply Chain & Operations
Simon Property Group, Inc.
- Large-scale operations with 2,600 employees managing global assets may face supply chain disruptions.
Federal Realty Investment Trust
- Smaller workforce (304) with focused regional operations reduces complexity but limits scalability.
6. ESG & Climate Transition
Simon Property Group, Inc.
- Global footprint demands aggressive ESG compliance; climate transition costs could pressure margins.
Federal Realty Investment Trust
- Urban mixed-use focus aligns with sustainability trends but still exposed to climate regulation risks.
7. Geopolitical Exposure
Simon Property Group, Inc.
- Geographic diversification includes Europe and Asia, increasing geopolitical risk and currency volatility.
Federal Realty Investment Trust
- Primarily U.S.-based, reducing direct geopolitical risks but subject to domestic policy shifts.
Which company shows a better risk-adjusted profile?
Simon Property Group’s largest risk lies in its elevated leverage and low liquidity ratios, which increase bankruptcy probabilities despite operational scale. Federal Realty’s key risk is moderate leverage coupled with higher valuation multiples, creating vulnerability if market sentiment shifts. I observe Federal Realty’s more balanced debt profile and lower volatility provide a superior risk-adjusted stance. The recent Altman Z-scores place both in distress zones, but Federal Realty’s stronger Piotroski score and neutral global ratios evaluation suggest greater financial stability in 2026.
Final Verdict: Which stock to choose?
Simon Property Group’s superpower lies in its ability to generate strong profitability and robust growth, translating into impressive returns on equity. Its point of vigilance is a stretched balance sheet with a low current ratio, which could amplify risks in a rising interest rate environment. It fits well in an aggressive growth portfolio that can tolerate leverage.
Federal Realty Investment Trust boasts a strategic moat through its focused portfolio of high-quality retail properties, delivering steady gross margins and a more conservative liquidity position. Compared to Simon Property, it offers better stability but slower growth, suiting a GARP (Growth at a Reasonable Price) portfolio seeking balanced income and capital appreciation.
If you prioritize high-growth potential and strong profitability despite leverage risks, Simon Property Group is the compelling choice due to its accelerating earnings and dominant market position. However, if you seek capital preservation with moderate growth and safer liquidity, Federal Realty provides better stability and a resilient income stream. Both require close attention to debt levels and market cycles.
Disclaimer: Investment carries a risk of loss of initial capital. The past performance is not a reliable indicator of future results. Be sure to understand risks before making an investment decision.
Go Further
I encourage you to read the complete analyses of Simon Property Group, Inc. and Federal Realty Investment Trust to enhance your investment decisions: