Home > Comparison > Real Estate > REG vs FRT
The strategic rivalry between Regency Centers Corporation and Federal Realty Investment Trust defines the trajectory of the retail real estate sector. Regency operates as a national owner and developer focused on affluent, densely populated trade areas. Federal Realty specializes in high-quality urban, mixed-use retail properties concentrated in major coastal markets. This head-to-head pits broad geographic scale against niche urban expertise. This analysis will identify which corporate strategy offers superior risk-adjusted returns for a diversified portfolio.

Table of contents
Companies Overview
Regency Centers and Federal Realty shape the premium U.S. retail REIT landscape with distinct strategies.
Regency Centers Corporation: National Retail Powerhouse
Regency Centers dominates as a national owner and developer of shopping centers in affluent, densely populated areas. Its core revenue comes from leasing to productive grocers, restaurants, and service providers. In 2026, Regency’s strategic focus remains on integrated management and community-connected retail environments, maintaining its S&P 500 status and a robust market cap of 13.9B.
Federal Realty Investment Trust: Coastal Urban Innovator
Federal Realty stands out as a leader in urban, mixed-use retail properties primarily in major coastal markets. It generates revenue through leasing its 106 properties that blend shopping, dining, and residential units. The company’s 2026 strategy emphasizes sustainable growth by investing in high-demand retail communities, backed by a 9B market cap and a 54-year dividend growth streak.
Strategic Collision: Similarities & Divergences
Both firms excel in retail-focused real estate but differ sharply. Regency centers on suburban affluent neighborhoods with integrated retail hubs. Federal Realty pursues urban mixed-use developments in high-barrier coastal markets. Their battle for market share revolves around location quality and tenant mix. Investors face a choice between Regency’s broad national footprint and Federal Realty’s coastal niche and dividend legacy.
Income Statement Comparison
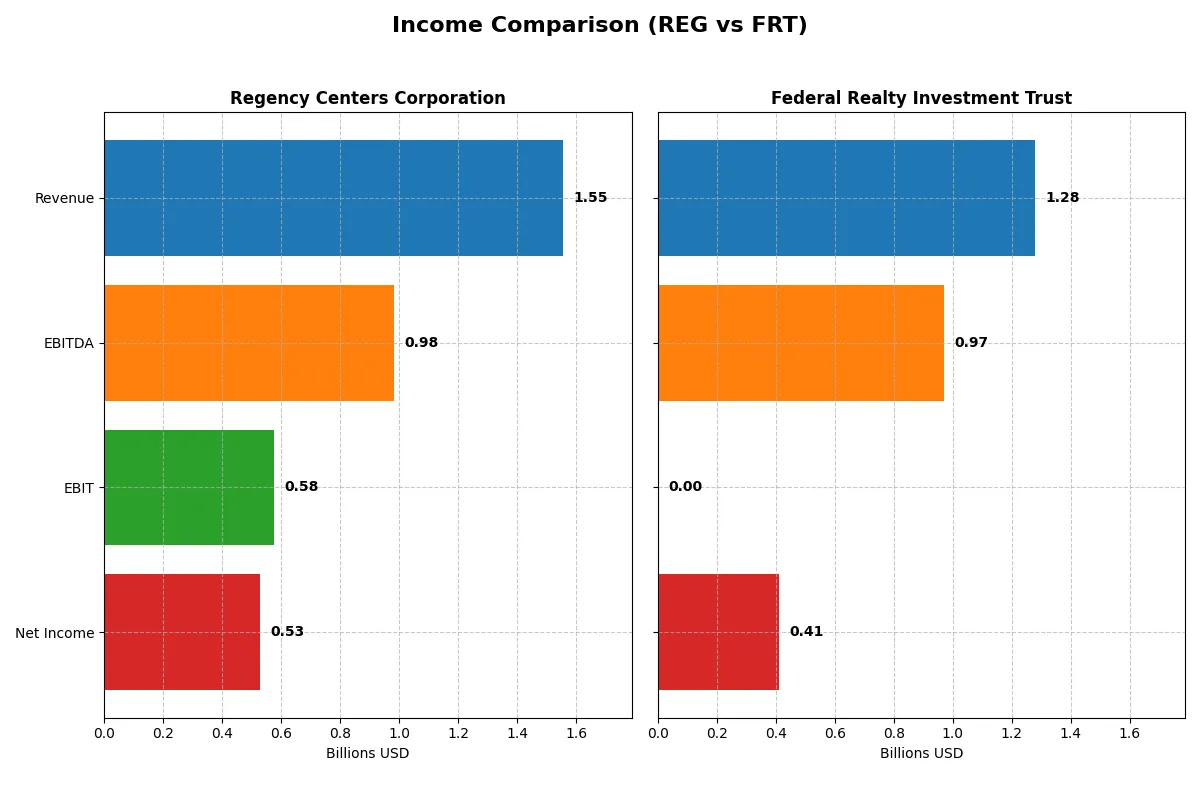
This data dissects the core profitability and scalability of both corporate engines to reveal who dominates the bottom line:
| Metric | Regency Centers Corporation (REG) | Federal Realty Investment Trust (FRT) |
|---|---|---|
| Revenue | 1.55B | 1.28B |
| Cost of Revenue | 860M | 419M |
| Operating Expenses | 119M | 415M |
| Gross Profit | 694M | 860M |
| EBITDA | 981M | 970M |
| EBIT | 576M | 0 |
| Interest Expense | 59M | -184M |
| Net Income | 527M | 411M |
| EPS | 2.79 | 4.79 |
| Fiscal Year | 2025 | 2025 |
Income Statement Analysis: The Bottom-Line Duel
The following income statement comparison exposes the true operational efficiency and profitability of two leading real estate investment trusts.
Regency Centers Corporation Analysis
Regency Centers steadily grew revenue from 1.2B in 2021 to 1.55B in 2025, with net income rising 46% over five years. Gross margins remain healthy near 45%, while net margins improved to 34%, reflecting disciplined cost control. In 2025, despite a modest 3.4% revenue increase, net income jumped 27%, signaling strong bottom-line momentum.
Federal Realty Investment Trust Analysis
Federal Realty expanded revenue from 951M in 2021 to 1.28B in 2025, achieving a 34% increase. It commands a robust gross margin above 67%, but EBIT margin collapsed to zero in 2025, an outlier raising caution. Net margin stayed solid at 32%, with net income surging 57% over five years. Earnings per share advanced 47%, highlighting strong shareholder value growth.
Margin Discipline vs. Growth Surge
Regency demonstrates consistent margin discipline and steady profit growth. Federal Realty exhibits superior top-line expansion and gross margin but faces EBIT volatility. Regency’s balanced margin profile offers predictable efficiency, whereas Federal Realty’s profile suits investors prioritizing aggressive growth with some risk. Regency’s steady margins appeal to those valuing operational consistency.
Financial Ratios Comparison
These vital ratios act as a diagnostic tool to expose the underlying fiscal health, valuation premiums, and capital efficiency of the companies analyzed:
| Ratios | Regency Centers Corporation (REG) | Federal Realty Investment Trust (FRT) |
|---|---|---|
| ROE | 7.64% | 12.65% |
| ROIC | 1.78% | 1.35% |
| P/E | 24.78 | 21.05 |
| P/B | 1.89 | 2.66 |
| Current Ratio | 0.33 | 0.31 |
| Quick Ratio | 0.33 | 0.31 |
| D/E | 0.86 | 0.35 |
| Debt-to-Assets | 45.7% | 12.5% |
| Interest Coverage | 9.82 | -3.28 |
| Asset Turnover | 0.12 | 0.14 |
| Fixed Asset Turnover | 4.92 | 14.29 |
| Payout ratio | 0.26% | 94.4% |
| Dividend yield | 0.01% | 4.48% |
| Fiscal Year | 2025 | 2025 |
Efficiency & Valuation Duel: The Vital Signs
Financial ratios act as a company’s DNA, exposing hidden risks and revealing operational strengths critical for investor decisions.
Regency Centers Corporation
Regency posts a modest ROE of 7.64% and a strong net margin of 33.94%, signaling solid profitability. Its P/E of 24.78 and P/B near 1.9 suggest a fairly valued stock, neither cheap nor expensive. Dividend yield is negligible at 0.01%, indicating retained earnings likely fuel growth or debt reduction.
Federal Realty Investment Trust
Federal Realty shows a higher ROE at 12.65% and a healthy net margin of 32.14%, reflecting efficient operations. Valuation multiples are moderate: P/E at 21.05 and P/B at 2.66. The 4.48% dividend yield stands out, offering direct shareholder returns, supported by a conservative debt ratio that enhances financial stability.
Balanced Profitability vs. Income Stability
Federal Realty offers a better blend of profitability and income with a higher ROE and meaningful dividends. Regency’s solid margins and fair valuation appeal to growth-focused investors. Those prioritizing income may prefer Federal Realty’s consistent dividend profile.
Which one offers the Superior Shareholder Reward?
I observe that Federal Realty Investment Trust (FRT) delivers a more attractive shareholder reward than Regency Centers Corporation (REG) in 2026. FRT maintains a solid dividend yield near 4.4%, with a payout ratio around 94%, supported by robust free cash flow of 7.25/share. REG’s dividend yield barely exceeds 0.01%, with a negligible payout ratio under 0.3%, signaling minimal income return. Both companies engage in buybacks, but FRT’s lower debt load (debt-to-assets 12.5% vs. REG’s 45.6%) and higher operating margins suggest more sustainable distributions. FRT’s combination of higher dividend yield, disciplined payout, and stable buybacks delivers superior total return potential for long-term investors.
Comparative Score Analysis: The Strategic Profile
This radar chart reveals the fundamental DNA and trade-offs of Regency Centers Corporation and Federal Realty Investment Trust:
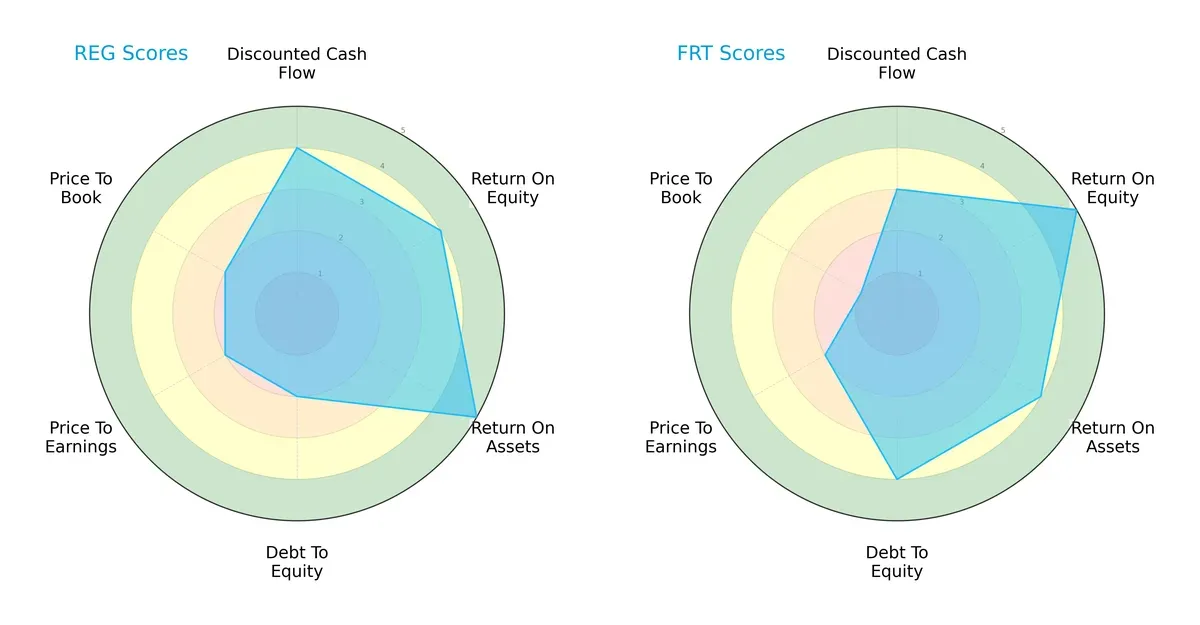
Regency excels in asset efficiency (ROA 5) and discounted cash flow (DCF 4) but struggles with leverage and valuation (Debt/Equity 2, PE/PB 2). Federal Realty shows a balanced financial risk profile (Debt/Equity 4) and stronger equity returns (ROE 5), yet it lags in valuation metrics (PE 2, PB 1). Overall, Federal Realty offers a more balanced risk-return trade-off, whereas Regency relies on operational efficiency as its main edge.
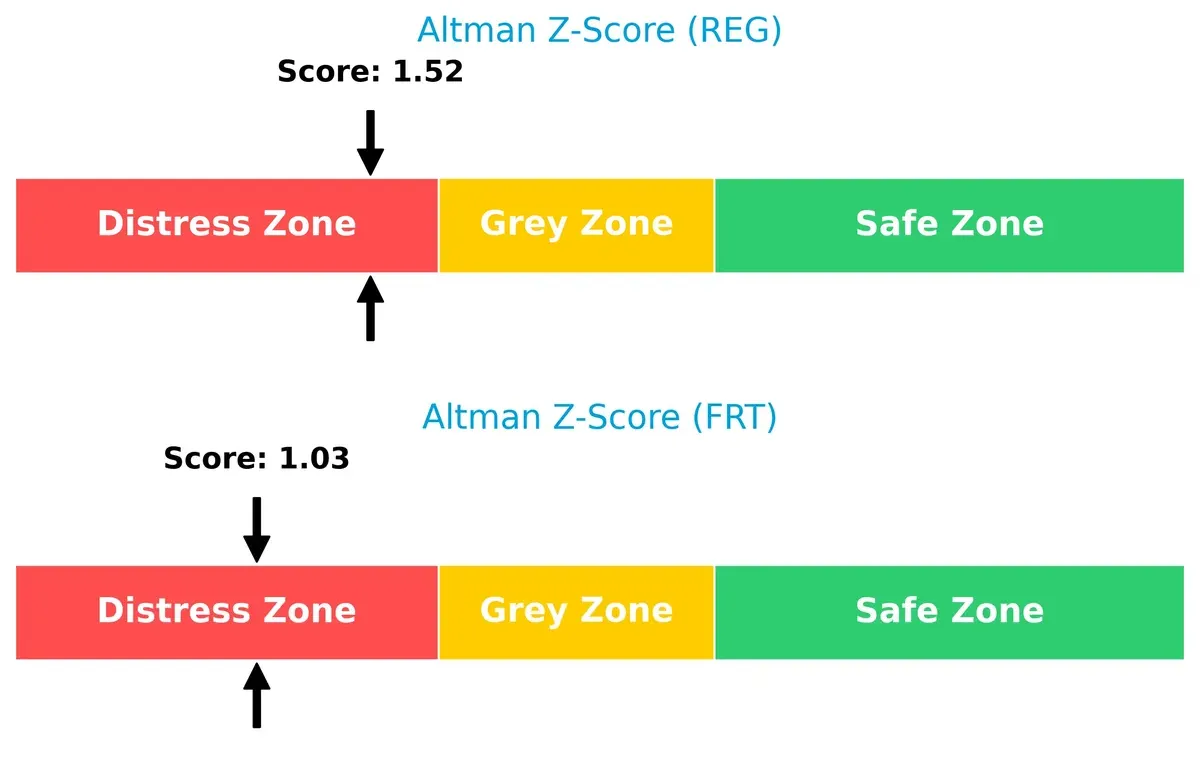
Bankruptcy Risk: Solvency Showdown
Regency’s Altman Z-Score of 1.52 slightly outperforms Federal Realty’s 1.03, but both dwell in the distress zone, signaling elevated bankruptcy risk under current cyclical pressures:
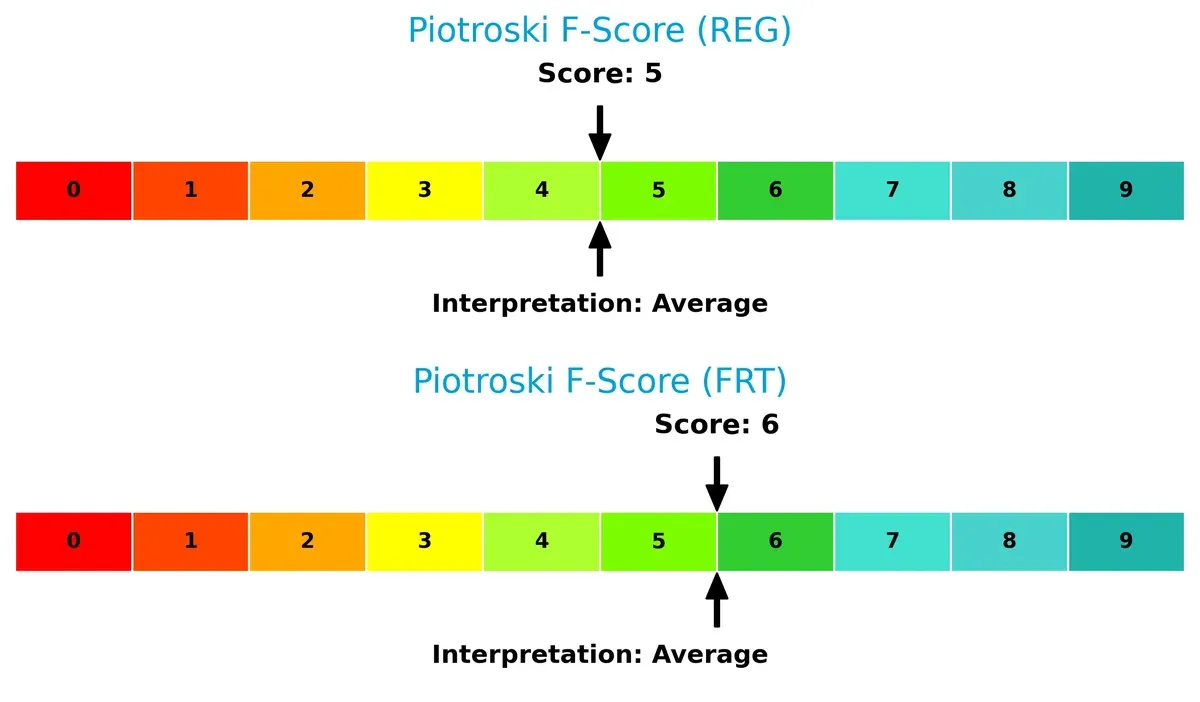
Financial Health: Quality of Operations
Federal Realty scores a 6 on the Piotroski scale, edging Regency’s 5, indicating marginally stronger financial health. Neither shows critical red flags, but Federal Realty’s internal metrics suggest a firmer foundation:
How are the two companies positioned?
This section dissects the operational DNA of REG and FRT by comparing their revenue distribution and internal dynamics. The goal is to confront their economic moats to identify which model offers the most resilient competitive advantage today.
Revenue Segmentation: The Strategic Mix
This visual comparison dissects how Regency Centers Corporation and Federal Realty Investment Trust diversify their income streams and where their primary sector bets lie:
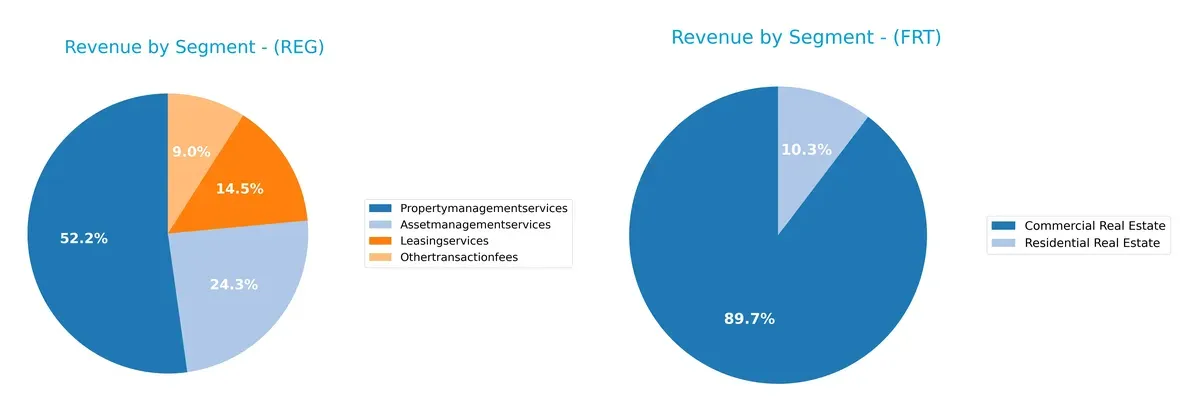
Regency centers its revenue on property management services at $14.1M, with smaller streams in asset and leasing services, showing a balanced yet service-focused mix. Federal Realty relies heavily on commercial real estate, which dwarfs its residential segment ($616M vs. $71M), indicating a strong concentration risk but also dominance in infrastructure. Regency’s diversified services reduce volatility, while Federal Realty’s focus anchors its ecosystem deeply in commercial properties.
Strengths and Weaknesses Comparison
This table compares the strengths and weaknesses of Regency Centers Corporation (REG) and Federal Realty Investment Trust (FRT):
REG Strengths
- High net margin at 33.94%
- ROIC significantly exceeds WACC at 178.49% vs 6.71%
- Favorable interest coverage at 9.82
- Strong fixed asset turnover at 4.92
- Diversified revenue streams including leasing and property management
FRT Strengths
- Solid net margin at 32.14%
- ROIC above WACC at 134.81% vs 5.77%
- Low debt-to-assets ratio at 12.51%
- Favorable fixed asset turnover at 14.29
- Higher dividend yield at 4.48%
- Lower debt-to-equity ratio of 0.35
REG Weaknesses
- Low current and quick ratios at 0.33 signal liquidity risk
- Unfavorable ROE at 7.64% indicates weaker equity returns
- Asset turnover is low at 0.12
- Minimal dividend yield at 0.01%
- Debt-to-assets ratio moderate at 45.66%
FRT Weaknesses
- Negative interest coverage ratio signals potential solvency issues
- Low current and quick ratios at 0.31 suggest liquidity constraints
- Asset turnover low at 0.14
- Higher price-to-book ratio at 2.66 compared to REG
Overall, REG demonstrates robust profitability and capital efficiency but faces liquidity and dividend yield challenges. FRT shows stronger balance sheet conservatism and shareholder returns but must address solvency and liquidity concerns. These contrasts shape each company’s strategic priorities in managing growth and risk.
The Moat Duel: Analyzing Competitive Defensibility
A structural moat alone shields long-term profits from relentless competition and market pressures. Let’s dissect how these two retail REITs defend their turf:
Regency Centers Corporation: Neighborhood Anchors with Intangible Assets
Regency’s moat stems from its curated retail centers anchored by high-demand grocers, creating sticky tenant relationships. This translates to a very favorable ROIC 172% above WACC and growing profitability. New market expansions could deepen its community-centric advantage in 2026.
Federal Realty Investment Trust: Urban Mixed-Use Ecosystem
Federal Realty’s moat relies on creating vibrant, mixed-use urban destinations, contrasting Regency’s suburban focus. Its ROIC is strong at 129% above WACC with a rising trend, reflecting efficient capital use despite recent EBIT volatility. Continued redevelopment projects offer growth runway in key coastal markets.
Community Roots vs. Urban Ecosystems: Which Moat Holds Deeper?
Regency’s higher ROIC premium signals a wider moat, driven by stable tenant demand and margin resilience. Federal Realty’s urban ecosystem is compelling but faces higher operational complexity. I see Regency better positioned to defend and expand its market share amid evolving retail dynamics.
Which stock offers better returns?
The past year shows Regency Centers Corporation’s stock gaining strong momentum with a clear acceleration in price growth. Federal Realty Investment Trust also trends upward but at a more moderate pace.
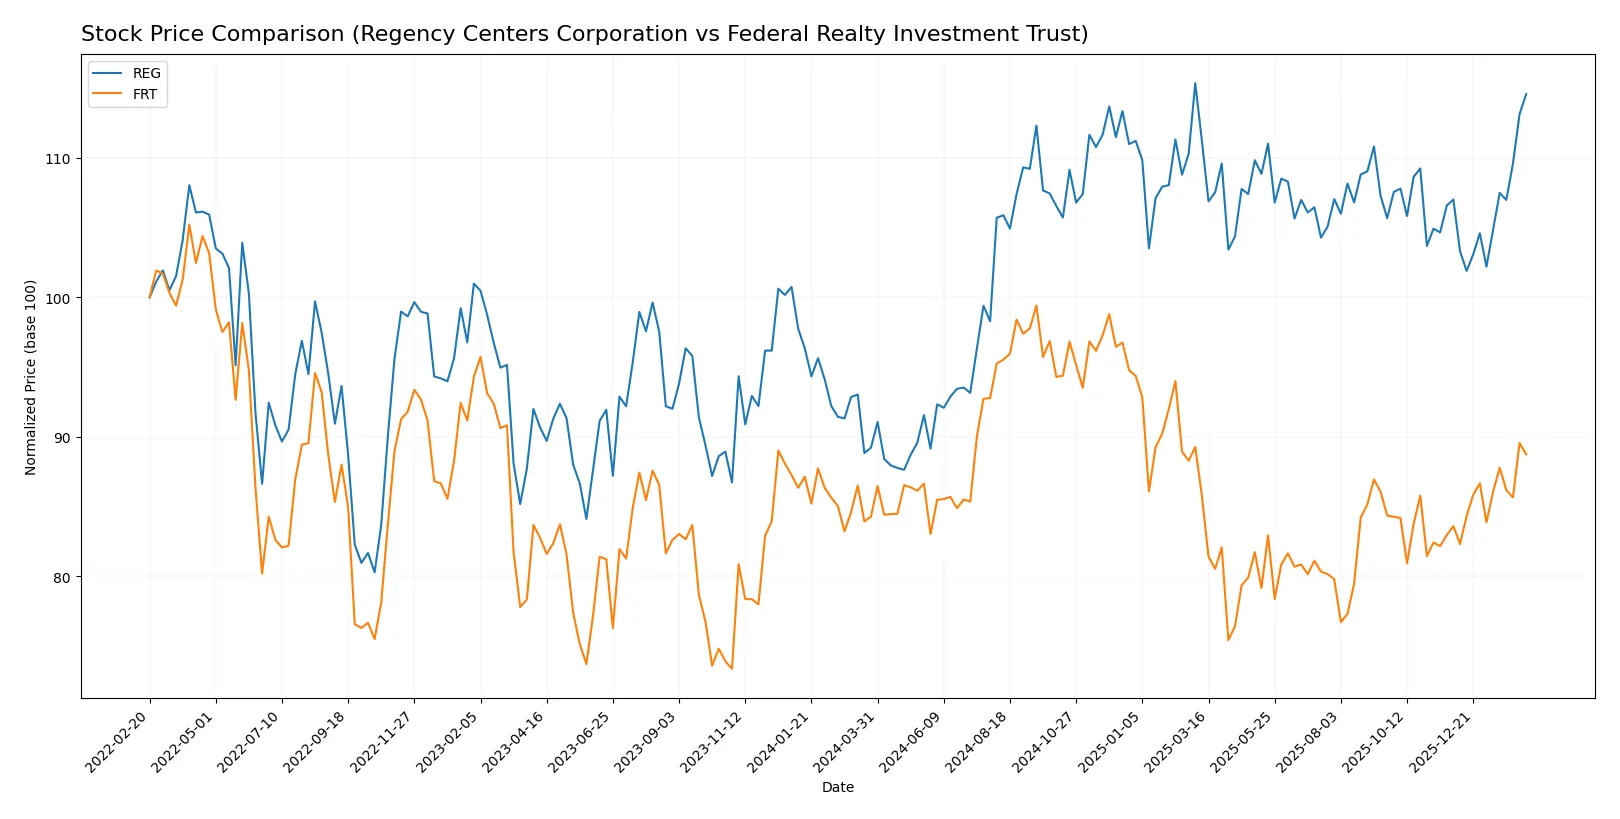
Trend Comparison
Regency Centers Corporation’s stock rose 28.38% over the past 12 months, exhibiting a bullish trend with accelerating gains and a price range from 58.28 to 76.7.
Federal Realty Investment Trust recorded a 5.29% increase over the same period, marking a bullish but less pronounced acceleration with prices between 89.09 and 117.39.
Regency Centers outperformed Federal Realty with a significantly higher total return and stronger recent price acceleration.
Target Prices
Analysts present a clear consensus on target prices for Regency Centers Corporation and Federal Realty Investment Trust.
| Company | Target Low | Target High | Consensus |
|---|---|---|---|
| Regency Centers Corporation | 74 | 85 | 80.3 |
| Federal Realty Investment Trust | 105 | 115 | 109.33 |
The target consensus for Regency Centers exceeds its current price of 76.18, indicating moderate upside potential. Federal Realty’s consensus target is also above its current 104.8 price, suggesting steady growth expectations.

Don’t Let Luck Decide Your Entry Point
Optimize your entry points with our advanced ProRealTime indicators. You’ll get efficient buy signals with precise price targets for maximum performance. Start outperforming now!
How do institutions grade them?
The following tables summarize recent grades assigned to Regency Centers Corporation and Federal Realty Investment Trust by major financial institutions:
Regency Centers Corporation Grades
This table lists recent institutional grades and rating actions for Regency Centers Corporation.
| Grading Company | Action | New Grade | Date |
|---|---|---|---|
| Citigroup | Maintain | Neutral | 2026-02-10 |
| Scotiabank | Maintain | Sector Perform | 2026-01-14 |
| Mizuho | Downgrade | Neutral | 2026-01-09 |
| UBS | Maintain | Neutral | 2026-01-08 |
| JP Morgan | Downgrade | Neutral | 2025-12-18 |
| Keybanc | Downgrade | Sector Weight | 2025-12-04 |
| Truist Securities | Maintain | Buy | 2025-11-18 |
| Barclays | Upgrade | Overweight | 2025-11-18 |
| Scotiabank | Maintain | Sector Perform | 2025-11-13 |
| Wells Fargo | Maintain | Overweight | 2025-10-21 |
Federal Realty Investment Trust Grades
This table lists recent institutional grades and rating actions for Federal Realty Investment Trust.
| Grading Company | Action | New Grade | Date |
|---|---|---|---|
| Stifel | Maintain | Hold | 2026-02-13 |
| Scotiabank | Maintain | Sector Outperform | 2026-01-14 |
| JP Morgan | Upgrade | Overweight | 2025-12-18 |
| Jefferies | Upgrade | Buy | 2025-12-16 |
| Truist Securities | Maintain | Hold | 2025-12-02 |
| Barclays | Downgrade | Equal Weight | 2025-11-18 |
| Evercore ISI Group | Maintain | In Line | 2025-11-03 |
| Wells Fargo | Maintain | Overweight | 2025-10-21 |
| Evercore ISI Group | Maintain | In Line | 2025-10-17 |
| Barclays | Maintain | Overweight | 2025-10-16 |
Which company has the best grades?
Federal Realty Investment Trust holds a stronger overall rating profile with multiple upgrades to Overweight and Buy, compared to Regency Centers’ Neutral and Sector Perform grades. Investors may view Federal Realty’s more positive momentum as a signal of greater institutional confidence.
Risks specific to each company
The following categories identify the critical pressure points and systemic threats facing both firms in the 2026 market environment:
1. Market & Competition
Regency Centers Corporation
- Operates in affluent, densely populated trade areas but faces pressure from evolving retail trends.
Federal Realty Investment Trust
- Focuses on high-quality retail properties in major coastal markets with urban mixed-use development expertise.
2. Capital Structure & Debt
Regency Centers Corporation
- Debt-to-equity ratio at 0.86 signals moderate leverage; interest coverage is strong at 9.82x.
Federal Realty Investment Trust
- Lower debt-to-equity at 0.35 shows conservative leverage; interest coverage is negative, indicating potential coverage problems.
3. Stock Volatility
Regency Centers Corporation
- Beta near 0.94 indicates moderate market sensitivity, aligning with sector norms.
Federal Realty Investment Trust
- Lower beta around 0.52 suggests less volatility, appealing to risk-averse investors.
4. Regulatory & Legal
Regency Centers Corporation
- No specific red flags but sector-wide regulatory risks persist, including zoning and environmental compliance.
Federal Realty Investment Trust
- Similar regulatory exposure with potential legal risks tied to urban redevelopment projects.
5. Supply Chain & Operations
Regency Centers Corporation
- Supply chain risks limited; operational efficiency challenged by low asset turnover (0.12).
Federal Realty Investment Trust
- Asset turnover slightly better at 0.14; operational complexity higher due to mixed-use properties.
6. ESG & Climate Transition
Regency Centers Corporation
- ESG strategy not highlighted; climate transition risks remain industry-wide concerns.
Federal Realty Investment Trust
- Increasing focus on sustainable urban developments; ESG risks mitigated by community integration.
7. Geopolitical Exposure
Regency Centers Corporation
- Primarily US-focused with low geopolitical risk; regional economic shifts pose moderate threats.
Federal Realty Investment Trust
- Also US-centric with exposure concentrated in coastal urban markets, sensitive to local economic cycles.
Which company shows a better risk-adjusted profile?
Federal Realty’s lower leverage and diversified urban portfolio confer a more stable risk profile. Regency’s stronger interest coverage is offset by higher debt and operational inefficiencies. Both firms face bankruptcy risk per Altman Z-Scores, but Federal Realty edges ahead with a slightly higher Piotroski score and lower financial leverage. Federal Realty’s negative interest coverage is a red flag; however, Regency’s weak liquidity ratios and distress zone Z-score raise caution. Overall, Federal Realty offers a better risk-adjusted profile with more favorable capital structure and dividend yield, despite some operational challenges.
Final Verdict: Which stock to choose?
Regency Centers Corporation’s superpower lies in its exceptional ability to create value through a very favorable and growing ROIC well above its cost of capital. This efficiency signals management’s skill in capital allocation, though its low current ratio is a point of vigilance. It suits aggressive growth portfolios seeking rising profitability.
Federal Realty Investment Trust boasts a durable strategic moat anchored in its strong recurring revenue and conservative leverage, evidenced by a low debt-to-equity profile. Relative to Regency, it offers better financial safety and a higher dividend yield, fitting well in GARP portfolios balancing growth with reasonable stability.
If you prioritize aggressive growth and capital efficiency, Regency outshines with superior value creation and margin expansion. However, if you seek a blend of growth and income with enhanced balance sheet security, Federal Realty offers better stability and a safer credit profile. Both demonstrate sustainable moats but cater to distinct investor appetites.
Disclaimer: Investment carries a risk of loss of initial capital. The past performance is not a reliable indicator of future results. Be sure to understand risks before making an investment decision.
Go Further
I encourage you to read the complete analyses of Regency Centers Corporation and Federal Realty Investment Trust to enhance your investment decisions: