Realty Income Corporation and Federal Realty Investment Trust are two prominent players in the retail-focused REIT sector, both known for their strong dividend histories and strategic property portfolios. While Realty Income emphasizes dependable monthly income through a vast portfolio of leased properties, Federal Realty focuses on high-quality, mixed-use retail developments in prime coastal markets. This article will explore which company offers the most compelling investment opportunity for your portfolio.

Table of contents
Companies Overview
I will begin the comparison between Realty Income Corporation and Federal Realty Investment Trust by providing an overview of these two companies and their main differences.
Realty Income Corporation Overview
Realty Income Corporation, known as The Monthly Dividend Company, is an S&P 500 REIT focused on providing stockholders with dependable monthly income. It owns over 6,500 retail real estate properties under long-term leases and has a 52-year history of 608 consecutive monthly dividends and 109 dividend increases since its 1994 listing. The company operates with a market cap of $53.6B and is led by CEO Sumit Roy.
Federal Realty Investment Trust Overview
Federal Realty Investment Trust is a REIT specializing in high-quality retail properties primarily in major coastal U.S. markets. Founded in 1962, it focuses on sustainable growth by investing in communities with retail demand exceeding supply, managing 106 properties with 3,100 tenants and 3,200 residential units. The company has a $8.9B market cap and the longest dividend increase streak in the REIT industry, led by CEO Donald C. Wood.
Key similarities and differences
Both Realty Income and Federal Realty operate as retail-focused REITs listed on the NYSE and members of the S&P 500, emphasizing income generation through dividends. Realty Income is larger with a $53.6B market cap and over 6,500 properties, offering monthly dividends, while Federal Realty is smaller at $8.9B with 106 mixed-use properties and a longer dividend increase streak. Their geographic focus and property portfolios differ, with Federal Realty concentrated on coastal urban areas.
Income Statement Comparison
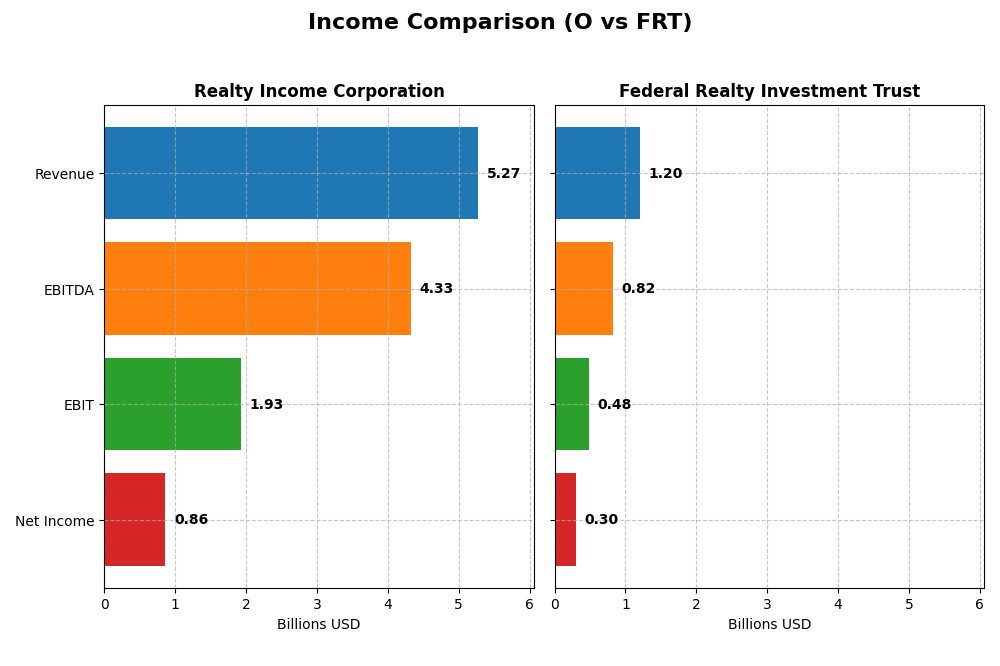
The table below presents a side-by-side comparison of key income statement metrics for Realty Income Corporation and Federal Realty Investment Trust for the fiscal year 2024.
| Metric | Realty Income Corporation (O) | Federal Realty Investment Trust (FRT) |
|---|---|---|
| Market Cap | 53.6B | 8.87B |
| Revenue | 5.27B | 1.20B |
| EBITDA | 4.33B | 822M |
| EBIT | 1.93B | 480M |
| Net Income | 848M | 286M |
| EPS | 0.98 | 3.42 |
| Fiscal Year | 2024 | 2024 |
Income Statement Interpretations
Realty Income Corporation
Realty Income demonstrated strong revenue growth from 2020 to 2024, rising from $1.65B to $5.27B, with net income also increasing substantially. Margins remained robust, especially with a gross margin near 93%, though net margin declined slightly in the latest year. In 2024, revenue growth accelerated, but net income and EPS showed a decline, indicating margin pressures despite overall top-line strength.
Federal Realty Investment Trust
Federal Realty’s revenue grew steadily from $835M in 2020 to $1.2B in 2024, with consistent increases in net income over the period. Margins improved, with a favorable net margin growth of 55.74% overall and a 24.55% net margin in 2024. The latest year saw moderate revenue growth and notable improvements in EPS and net margin, reflecting enhanced profitability and operational efficiency.
Which one has the stronger fundamentals?
Both companies show favorable income statement trends, but Federal Realty’s higher net margin and stronger margin growth profile contrast with Realty Income’s larger revenue base but declining net margin. Realty Income benefits from very high gross margins and zero interest expense, while Federal Realty faces higher interest costs. Overall, Federal Realty’s margin improvements and EPS growth may indicate stronger recent profitability fundamentals.
Financial Ratios Comparison
The table below presents a side-by-side comparison of key financial ratios for Realty Income Corporation (O) and Federal Realty Investment Trust (FRT) for the fiscal year 2024, reflecting their latest reported metrics.
| Ratios | Realty Income Corporation (O) | Federal Realty Investment Trust (FRT) |
|---|---|---|
| ROE | 2.22% | 9.31% |
| ROIC | 3.19% | 5.75% |
| P/E | 54.18 | 31.69 |
| P/B | 1.20 | 2.95 |
| Current Ratio | 1.68 | 1.16 |
| Quick Ratio | 1.68 | 1.16 |
| D/E (Debt-to-Equity) | 0.69 | 1.44 |
| Debt-to-Assets | 38.87% | 53.51% |
| Interest Coverage | 2.33 | 2.69 |
| Asset Turnover | 0.08 | 0.14 |
| Fixed Asset Turnover | 4.14 | 13.01 |
| Payout Ratio | 313.61% | 125.87% |
| Dividend Yield | 5.79% | 3.97% |
Interpretation of the Ratios
Realty Income Corporation
Realty Income shows a balanced profile with 50% favorable and 28.57% unfavorable ratios. Key strengths include a strong net margin at 16.33%, favorable WACC at 6.16%, and solid liquidity ratios around 1.68. However, low ROE at 2.22% and ROIC at 3.19% raise concerns about capital efficiency. The company pays a consistent dividend with a 5.79% yield, reflecting stable shareholder returns without signs of payout risk.
Federal Realty Investment Trust
Federal Realty’s ratios present a more mixed picture with 35.71% favorable and unfavorable each, and 28.57% neutral. It benefits from a higher net margin of 24.55% and favorable fixed asset turnover at 13.01 but faces challenges from high debt levels (D/E 1.44) and moderate interest coverage at 2.73. The dividend yield stands at 3.97% with a steady payout, supporting moderate shareholder returns amid cautious debt management.
Which one has the best ratios?
Realty Income’s ratios appear slightly more favorable overall, with better liquidity and lower leverage compared to Federal Realty. Although Federal Realty shows stronger profitability margins and asset turnover, its higher debt and interest burden temper its financial strength. Thus, Realty Income offers a more balanced ratio profile while Federal Realty carries more risk in capital structure.
Strategic Positioning
This section compares the strategic positioning of Realty Income Corporation and Federal Realty Investment Trust across market position, key segments, and exposure to technological disruption:
Realty Income Corporation
- Large market cap of $53.6B, faces moderate competitive pressure in retail REIT segment.
- Focused on retail and industrial segments, with retail revenue at $4.0B driving growth.
- Limited direct exposure to technological disruption mentioned; relies on long-term lease agreements.
Federal Realty Investment Trust
- Smaller market cap of $8.9B, operates in high-quality retail properties in major coastal markets.
- Concentrated in commercial real estate with some residential exposure, $616M commercial revenue.
- No explicit technological disruption noted; emphasis on mixed-use urban neighborhoods.
Realty Income Corporation vs Federal Realty Investment Trust Positioning
Realty Income pursues a diversified retail and industrial property strategy with substantial scale, while Federal Realty focuses on concentrated, high-quality urban retail and residential properties. Realty Income benefits from scale but faces broader competition; Federal Realty leverages specialized markets but with smaller asset base.
Which has the best competitive advantage?
Both companies are currently shedding value relative to their cost of capital. Federal Realty shows improving profitability trends, while Realty Income’s declining returns indicate a weaker competitive moat based on recent ROIC versus WACC analysis.
Stock Comparison
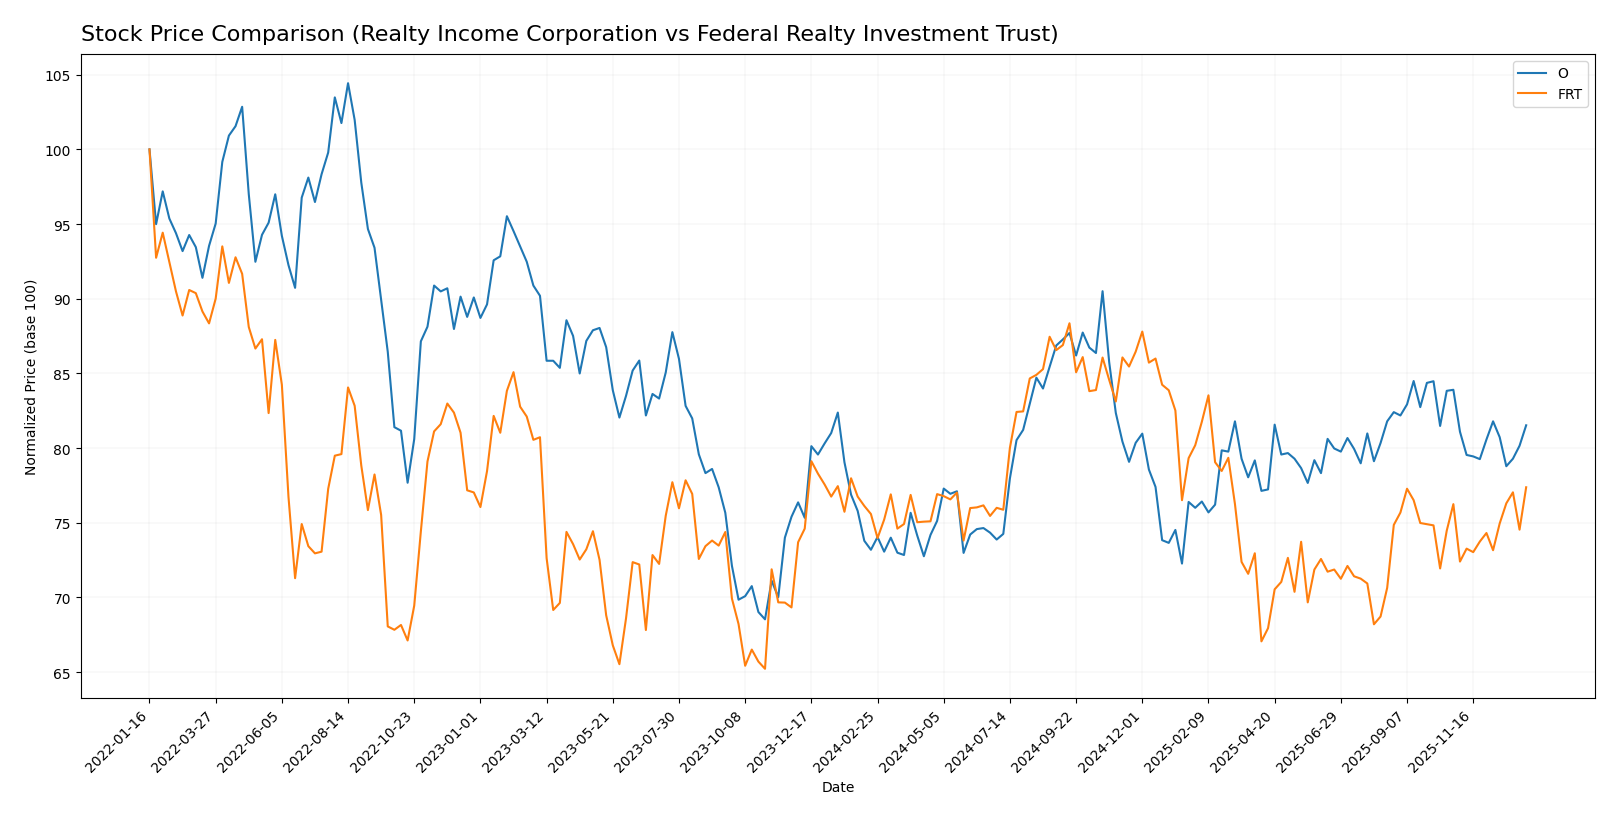
The stock price chart highlights key movements and trading dynamics of Realty Income Corporation and Federal Realty Investment Trust over the past 12 months, showing distinct performance trends and volume shifts.
Trend Analysis
Realty Income Corporation (O) shows a bullish trend over the past 12 months with an 11.39% price increase, though recent months indicate a slight bearish reversal with a -2.83% decline and decelerating momentum.
Federal Realty Investment Trust (FRT) maintains a bullish trend with a 2.37% rise over the past year, supported by accelerating momentum and a buyer-dominant volume pattern, despite modest recent gains of 1.48%.
Comparing both, Realty Income Corporation has delivered the highest overall market performance with a stronger price increase, while Federal Realty Investment Trust shows steadier volume growth and positive momentum.
Target Prices
Here is the current consensus on target prices from verified analysts for Realty Income Corporation and Federal Realty Investment Trust.
| Company | Target High | Target Low | Consensus |
|---|---|---|---|
| Realty Income Corporation | 65 | 60 | 61.57 |
| Federal Realty Investment Trust | 115 | 105 | 109.58 |
Analysts expect Realty Income’s stock to trade slightly above the current price of $58.29, signaling moderate upside potential. Federal Realty’s consensus target of $109.58 also suggests room for appreciation from its current $102.80 price.
Analyst Opinions Comparison
This section compares analysts’ ratings and grades for Realty Income Corporation (O) and Federal Realty Investment Trust (FRT):
Rating Comparison
O Rating
- Rated B- with an overall score of 2, indicating a moderate financial standing.
- Discounted Cash Flow score is 5, very favorable, suggesting undervaluation.
- Return on Equity score is 2, moderate efficiency in generating profit.
- Return on Assets score is 2, moderate asset utilization.
- Debt to Equity score is 2, moderate financial risk.
FRT Rating
- Rated B+ with an overall score of 3, reflecting a moderate financial standing.
- Discounted Cash Flow score is 3, moderate, indicating fair valuation.
- Return on Equity score is 4, favorable, showing strong profit generation.
- Return on Assets score is 4, favorable, indicating effective asset use.
- Debt to Equity score is 4, favorable, indicating lower financial risk.
Which one is the best rated?
Based strictly on the provided data, FRT holds a higher overall rating (B+) and superior scores in ROE, ROA, and debt to equity compared to O, which has a stronger discounted cash flow score but lower marks elsewhere.
Scores Comparison
Here is a comparison of the Altman Z-Score and Piotroski Score for Realty Income Corporation and Federal Realty Investment Trust:
O Scores
- Altman Z-Score: 0.95, in distress zone, indicating high bankruptcy risk.
- Piotroski Score: 5, average financial strength.
FRT Scores
- Altman Z-Score: 0.99, in distress zone, indicating high bankruptcy risk.
- Piotroski Score: 7, strong financial strength.
Which company has the best scores?
Federal Realty Investment Trust has a slightly better Altman Z-Score but remains in distress zone like Realty Income. Its Piotroski Score of 7 indicates stronger financial health compared to Realty Income’s average score of 5.
Grades Comparison
The following section compares the recent analyst grades for Realty Income Corporation and Federal Realty Investment Trust:
Realty Income Corporation Grades
This table summarizes recent grades from reputable financial institutions for Realty Income Corporation:
| Grading Company | Action | New Grade | Date |
|---|---|---|---|
| Morgan Stanley | Maintain | Equal Weight | 2025-12-24 |
| JP Morgan | Downgrade | Underweight | 2025-12-18 |
| Mizuho | Maintain | Neutral | 2025-12-17 |
| Barclays | Maintain | Equal Weight | 2025-12-03 |
| Wells Fargo | Maintain | Equal Weight | 2025-11-25 |
| Cantor Fitzgerald | Maintain | Neutral | 2025-11-06 |
| RBC Capital | Maintain | Outperform | 2025-11-04 |
| Barclays | Maintain | Equal Weight | 2025-10-20 |
| Mizuho | Maintain | Neutral | 2025-09-11 |
| Scotiabank | Maintain | Sector Perform | 2025-08-28 |
Overall, grades for Realty Income Corporation mostly cluster around “Equal Weight” and “Neutral,” with a slight recent downgrade by JP Morgan.
Federal Realty Investment Trust Grades
This table presents recent ratings from recognized grading companies for Federal Realty Investment Trust:
| Grading Company | Action | New Grade | Date |
|---|---|---|---|
| JP Morgan | Upgrade | Overweight | 2025-12-18 |
| Jefferies | Upgrade | Buy | 2025-12-16 |
| Truist Securities | Maintain | Hold | 2025-12-02 |
| Barclays | Downgrade | Equal Weight | 2025-11-18 |
| Evercore ISI Group | Maintain | In Line | 2025-11-03 |
| Wells Fargo | Maintain | Overweight | 2025-10-21 |
| Evercore ISI Group | Maintain | In Line | 2025-10-17 |
| Barclays | Maintain | Overweight | 2025-10-16 |
| Barclays | Maintain | Overweight | 2025-10-06 |
| Evercore ISI Group | Downgrade | In Line | 2025-09-15 |
Federal Realty Investment Trust exhibits a recent improving trend with upgrades from JP Morgan and Jefferies, offset by a downgrade from Barclays.
Which company has the best grades?
Federal Realty Investment Trust has received generally more favorable and upgraded ratings, such as “Overweight” and “Buy,” compared to Realty Income Corporation’s prevailing “Equal Weight” and “Neutral” grades. This contrast may influence investors by reflecting stronger analyst confidence in Federal Realty’s near-term prospects.
Strengths and Weaknesses
Below is a comparative overview of key strengths and weaknesses for Realty Income Corporation (O) and Federal Realty Investment Trust (FRT) based on the most recent financial and operational data.
| Criterion | Realty Income Corporation (O) | Federal Realty Investment Trust (FRT) |
|---|---|---|
| Diversification | High diversification in retail segments and industrial | Focused on commercial and residential real estate; less diversified |
| Profitability | Moderate net margin (16.33%), but ROIC below WACC, indicating value destruction | Higher net margin (24.55%) with improving ROIC, yet still slightly unfavorable vs WACC |
| Innovation | Limited innovation indicated; steady but declining ROIC trend | Showing growth in ROIC, suggesting improving operational efficiency |
| Global presence | Strong US and UK presence with growing revenues | Primarily US-focused with commercial real estate dominance |
| Market Share | Large market share in retail real estate segments | Smaller scale but niche-focused on high-quality commercial assets |
Key takeaways: Realty Income shows strong diversification and stable revenues but struggles with declining profitability and value destruction. Federal Realty has higher profitability and improving returns but is less diversified and carries higher debt risk. Investors should weigh diversification against profitability trends and financial health carefully.
Risk Analysis
Below is a comparative overview of key risks facing Realty Income Corporation (O) and Federal Realty Investment Trust (FRT) as of 2024:
| Metric | Realty Income Corporation (O) | Federal Realty Investment Trust (FRT) |
|---|---|---|
| Market Risk | Moderate (Beta 0.81) | Moderate-High (Beta 1.03) |
| Debt level | Neutral (D/E 0.69; 39% debt-to-assets) | Unfavorable (D/E 1.44; 54% debt-to-assets) |
| Regulatory Risk | Moderate | Moderate |
| Operational Risk | Moderate (Asset turnover low) | Moderate-High (Higher leverage) |
| Environmental Risk | Moderate (Retail REIT exposure) | Moderate (Urban mixed-use focus) |
| Geopolitical Risk | Low (US-focused) | Low (US-focused) |
Realty Income shows moderate market and operational risks but maintains a more conservative debt profile. Federal Realty carries higher leverage and associated financial risk, increasing sensitivity to interest rates and economic cycles. Both operate in retail real estate, facing evolving consumer trends and regulatory scrutiny. The most impactful risks are Federal Realty’s elevated debt and Realty Income’s moderate market volatility. Investors should weigh these factors carefully with a focus on risk management.
Which Stock to Choose?
Realty Income Corporation (O) shows strong income growth with a 220% revenue increase over 2020-2024 and favorable gross and EBIT margins. Its financial ratios are slightly favorable, despite moderate profitability ratios and a neutral debt profile. The company carries a very favorable B- rating but displays a very unfavorable moat due to declining ROIC below WACC.
Federal Realty Investment Trust (FRT) exhibits steady income growth of 44% over the period with favorable margins and improving net margin. Its financial ratios are neutral overall, with some favorable returns and moderate debt concerns. The company holds a very favorable B+ rating and a slightly unfavorable moat, showing increasing ROIC but still below WACC.
Investors prioritizing growth and strong income statement momentum might find Realty Income appealing, while those seeking improving profitability with a stronger rating and growing ROIC could see Federal Realty as more suitable. The choice may depend on the investor’s risk tolerance and focus on either growth or improving quality metrics.
Disclaimer: Investment carries a risk of loss of initial capital. The past performance is not a reliable indicator of future results. Be sure to understand risks before making an investment decision.
Go Further
I encourage you to read the complete analyses of Realty Income Corporation and Federal Realty Investment Trust to enhance your investment decisions: