Home > Comparison > Real Estate > KIM vs FRT
The strategic rivalry between Kimco Realty Corporation and Federal Realty Investment Trust shapes the landscape of retail real estate. Kimco operates a broad portfolio of grocery-anchored shopping centers, emphasizing scale and market penetration. Federal Realty focuses on high-quality, urban mixed-use developments in premium coastal markets, blending retail with residential. This analysis evaluates which model delivers superior risk-adjusted returns, providing investors clarity in a sector defined by evolving consumer trends and urbanization pressures.

Table of contents
Companies Overview
Kimco Realty Corporation and Federal Realty Investment Trust stand as key players in the U.S. retail REIT landscape.
Kimco Realty Corporation: Leader in Open-Air Retail Centers
Kimco Realty Corporation is a major publicly traded REIT specializing in open-air, grocery-anchored shopping centers and mixed-use assets. It generates revenue mainly from leasing operations across 400 U.S. properties totaling 70M square feet. In 2026, Kimco focuses strategically on acquisitions, development, and management in top metropolitan markets to strengthen its competitive footprint.
Federal Realty Investment Trust: Pioneer in Urban Mixed-Use Developments
Federal Realty Investment Trust excels in owning and redeveloping high-quality retail properties primarily in major U.S. coastal markets. Its revenue stems from a diversified tenant base across 106 urban properties totaling 25M square feet plus 3,200 residential units. The firm’s 2026 strategy prioritizes creating vibrant mixed-use neighborhoods that blend retail, dining, living, and working spaces to drive sustainable growth.
Strategic Collision: Similarities & Divergences
Both companies dominate retail-focused real estate but diverge in approach: Kimco emphasizes open-air, grocery-anchored centers while Federal Realty champions urban mixed-use developments. They compete primarily on location quality and tenant mix in high-demand metropolitan zones. Their distinct models offer contrasting investment profiles—Kimco with scale and breadth, Federal Realty with niche community-driven assets.
Income Statement Comparison
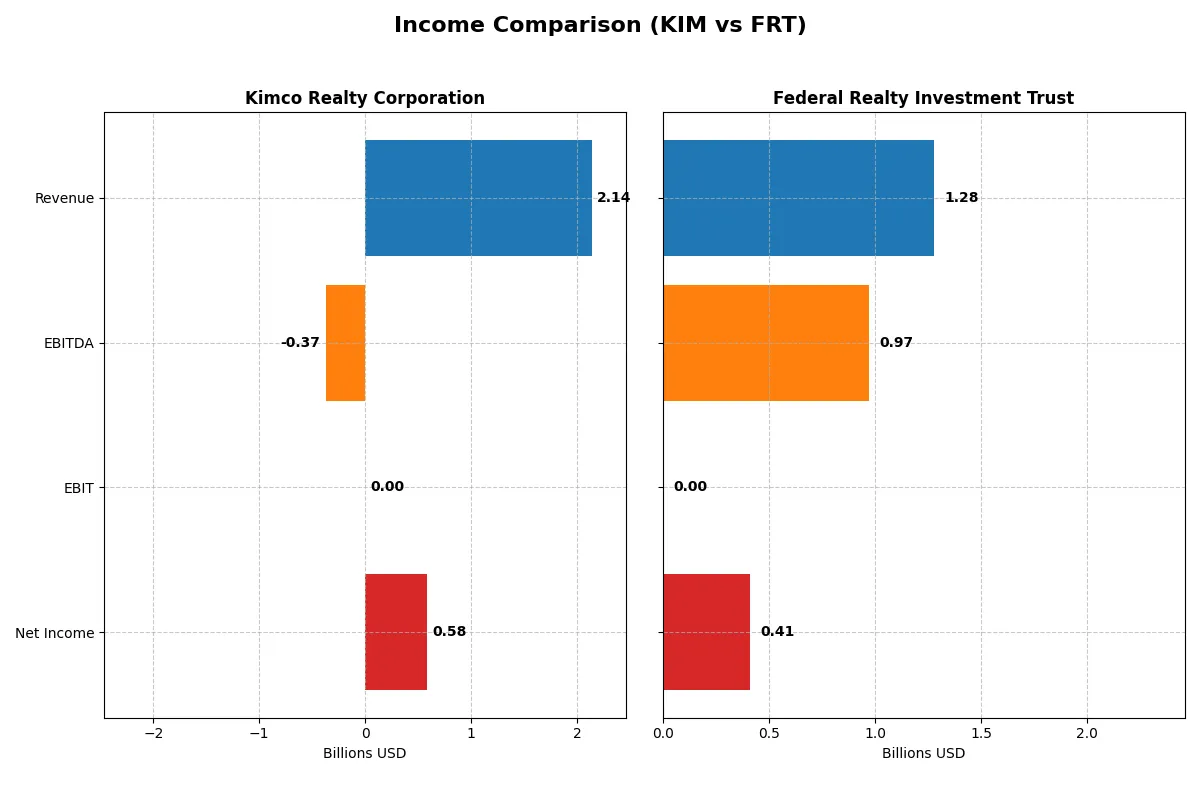
This data dissects the core profitability and scalability of both corporate engines to reveal who dominates the bottom line:
| Metric | Kimco Realty Corporation (KIM) | Federal Realty Investment Trust (FRT) |
|---|---|---|
| Revenue | 2.14B | 1.28B |
| Cost of Revenue | 662M | 419M |
| Operating Expenses | 133M | 415M |
| Gross Profit | 1.48B | 860M |
| EBITDA | -374M | 970M |
| EBIT | 0 | 0 |
| Interest Expense | -330M | -184M |
| Net Income | 585M | 411M |
| EPS | 0.87 | 4.79 |
| Fiscal Year | 2025 | 2025 |
Income Statement Analysis: The Bottom-Line Duel
This income statement comparison reveals which company operates with superior profitability and growth efficiency over recent years.
Kimco Realty Corporation Analysis
Kimco’s revenue climbed steadily by 5.1% to $2.14B in 2025, with net income reaching $585M, up 42% year-over-year. Its gross margin remains robust at 69%, reflecting efficient cost control. However, EBIT margin dropped sharply to zero, signaling operational challenges despite favorable net margin growth and improved EPS momentum.
Federal Realty Investment Trust Analysis
Federal Realty’s revenue increased 6.4% to $1.28B in 2025, while net income rose 39% to $411M. The company maintains a strong gross margin of 67% and a higher net margin at 32%. Although EBIT margin also fell to zero, Federal’s consistent revenue and net income growth over five years indicate solid operational momentum and margin expansion.
Margin Strength vs. Growth Trajectory
Federal Realty edges Kimco with superior net margin and consistent net income growth of 57% over five years, compared to Kimco’s 31% decline. Kimco boasts a higher gross margin but suffers from EBIT erosion. For investors, Federal Realty’s profile offers stronger earnings quality and growth resilience, while Kimco’s operational efficiency requires cautious scrutiny.
Financial Ratios Comparison
These vital ratios act as a diagnostic tool to expose the underlying fiscal health, valuation premiums, and capital efficiency of the companies analyzed:
| Ratios | Kimco Realty Corporation (KIM) | Federal Realty Investment Trust (FRT) |
|---|---|---|
| ROE | 3.86% (2024) | 12.65% (2025) |
| ROIC | 2.96% (2024) | 134.81% (2025) |
| P/E | 38.3 (2024) | 21.05 (2025) |
| P/B | 1.48 (2024) | 2.66 (2025) |
| Current Ratio | 3.58 (2024) | 0.31 (2025) |
| Quick Ratio | 3.58 (2024) | 0.31 (2025) |
| D/E (Debt-to-Equity) | 0.81 (2024) | 0.35 (2025) |
| Debt-to-Assets | 42.2% (2024) | 12.5% (2025) |
| Interest Coverage | 2.04 (2024) | -3.28 (2025) |
| Asset Turnover | 0.10 (2024) | 0.14 (2025) |
| Fixed Asset Turnover | 16.11 (2024) | 14.29 (2025) |
| Payout Ratio | 167% (2024) | 94% (2025) |
| Dividend Yield | 4.36% (2024) | 4.48% (2025) |
| Fiscal Year | 2024 | 2025 |
Efficiency & Valuation Duel: The Vital Signs
Financial ratios act as a company’s DNA, unveiling operational strengths and risks hidden beneath headline figures.
Kimco Realty Corporation
Kimco shows a favorable net margin of 27.3% but an unfavorable ROE of 0%, indicating weak shareholder profitability. Its P/E ratio at 23.4 is neutral, suggesting fair valuation. The stock offers a 4.98% dividend yield, signaling consistent shareholder returns despite operational challenges.
Federal Realty Investment Trust
Federal Realty reports a stronger net margin at 32.1% and a neutral ROE of 12.65%, with an impressive ROIC of 134.8%, reflecting operational efficiency. Its P/E ratio of 21.05 is neutral, and it provides a solid 4.48% dividend yield. The firm balances growth and income effectively.
Operational Efficiency and Valuation: Federal Realty Edges Ahead
Federal Realty delivers higher operational returns and a robust capital efficiency profile compared to Kimco’s weaker equity returns. While both offer similar dividend yields, Federal Realty’s metrics suggest a better risk-reward balance. Investors seeking operational strength and steady income may find its profile more appealing.
Which one offers the Superior Shareholder Reward?
I compare Kimco Realty (KIM) and Federal Realty (FRT) on dividends, payout ratios, and buybacks to assess shareholder returns in 2026. Kimco yields 5.0% with a payout ratio exceeding 100%, signaling dividend risk. Federal Realty offers a 4.5% yield with a safer 94% payout. Kimco’s dividend coverage is weaker, while FRT maintains robust free cash flow and a consistent buyback program. Federal’s lower leverage and sustainable distributions support long-term value better. I conclude Federal Realty offers the superior total return profile for investors seeking balanced income and growth in 2026.
Comparative Score Analysis: The Strategic Profile
The radar chart reveals the fundamental DNA and trade-offs of Kimco Realty Corporation and Federal Realty Investment Trust:
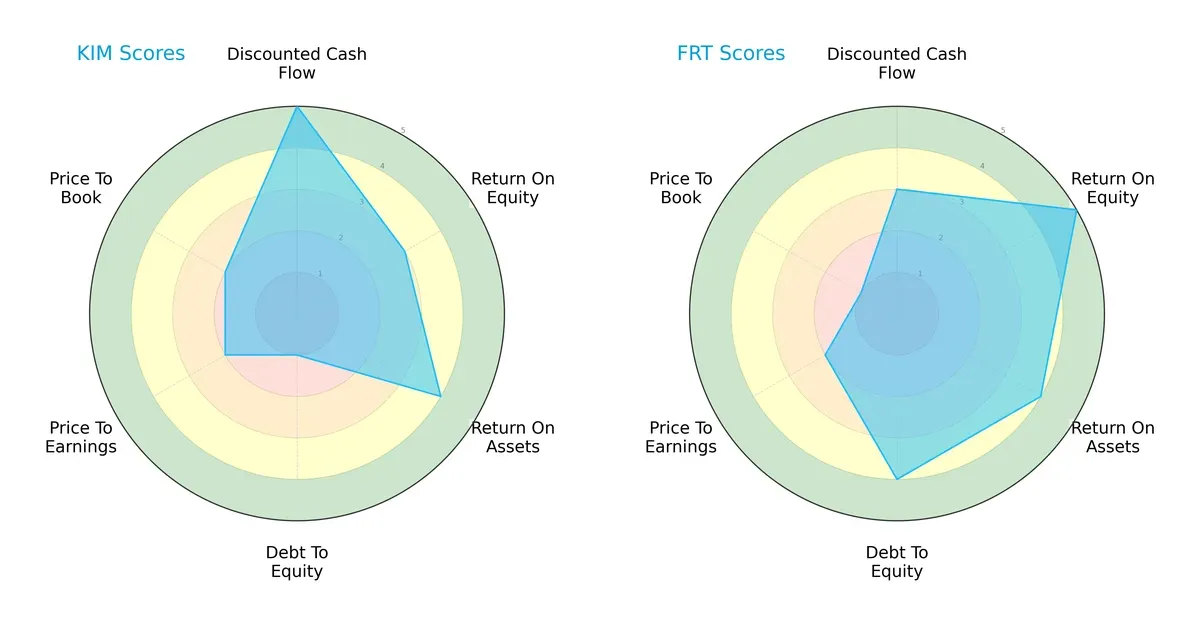
Kimco excels in discounted cash flow, signaling strong intrinsic value, but struggles heavily with debt-to-equity, a major financial risk. Federal Realty shines in return on equity and maintains a healthier debt profile, though its valuation metrics suggest some overpricing. Overall, Federal Realty presents a more balanced financial profile, while Kimco relies on its DCF advantage despite leverage concerns.
Bankruptcy Risk: Solvency Showdown
The Altman Z-Scores place both firms in the distress zone, indicating elevated bankruptcy risk amid the current cycle:
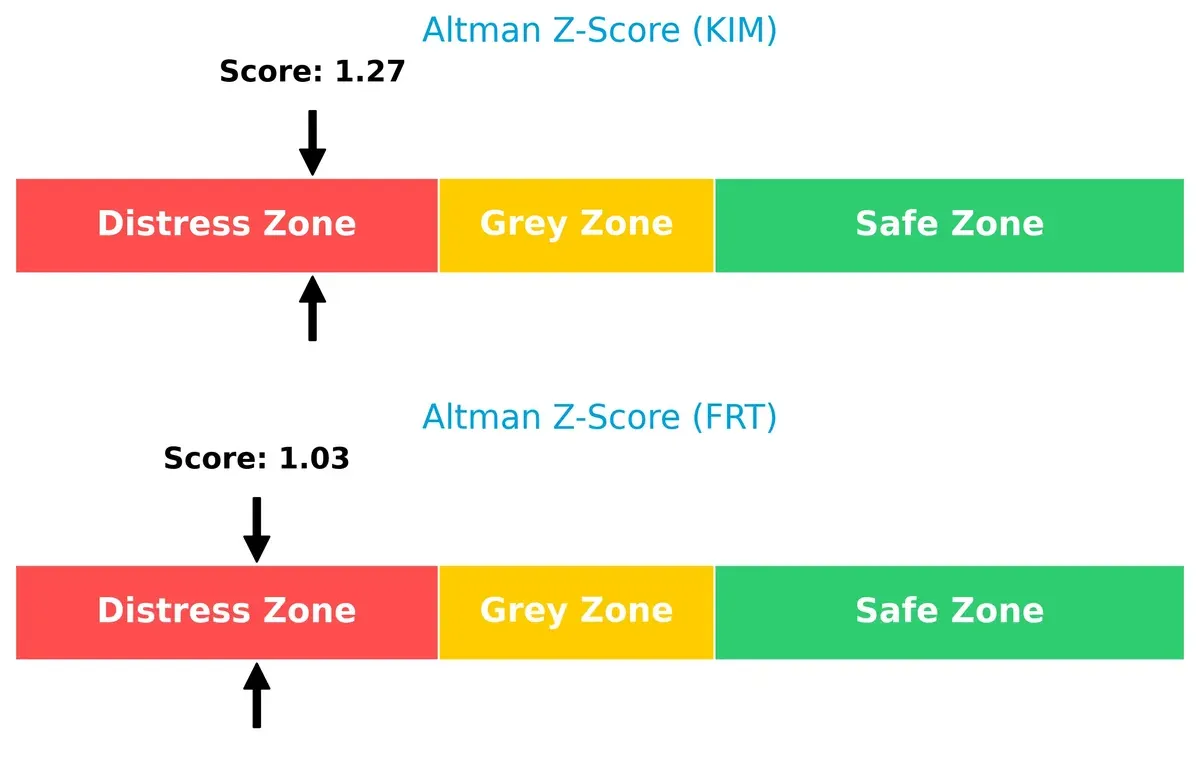
Kimco’s slightly better score hints at marginally stronger solvency, but both companies must address financial stability to avoid long-term distress.
Financial Health: Quality of Operations
Kimco’s Piotroski F-Score of 7 indicates strong financial health, outperforming Federal Realty’s average score of 6:
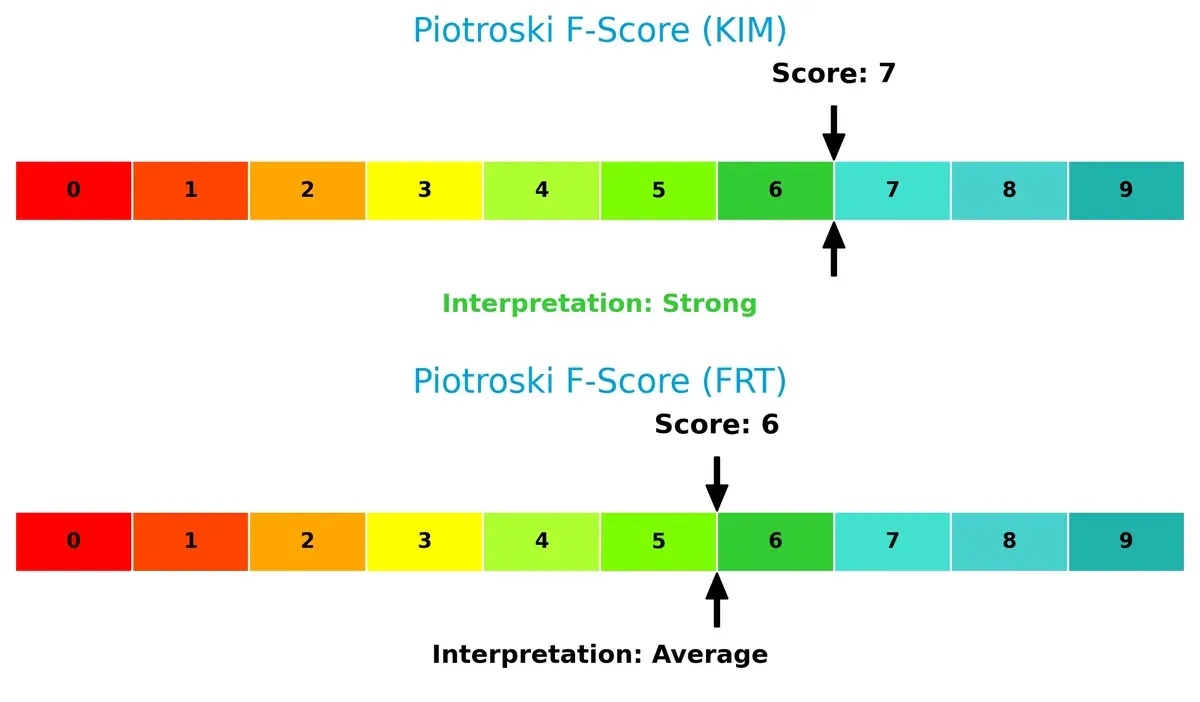
Kimco shows fewer internal red flags, suggesting superior operational quality and efficiency compared to Federal Realty, which may face moderate challenges in profitability or leverage management.
How are the two companies positioned?
This section dissects the operational DNA of Kimco Realty and Federal Realty by comparing their revenue distribution by segment and internal strengths and weaknesses. The final objective is to confront their economic moats to reveal which business model offers the most resilient and sustainable competitive advantage today.
Revenue Segmentation: The Strategic Mix
This comparison dissects how Kimco Realty Corporation and Federal Realty Investment Trust diversify their income streams and reveals their primary sector bets:
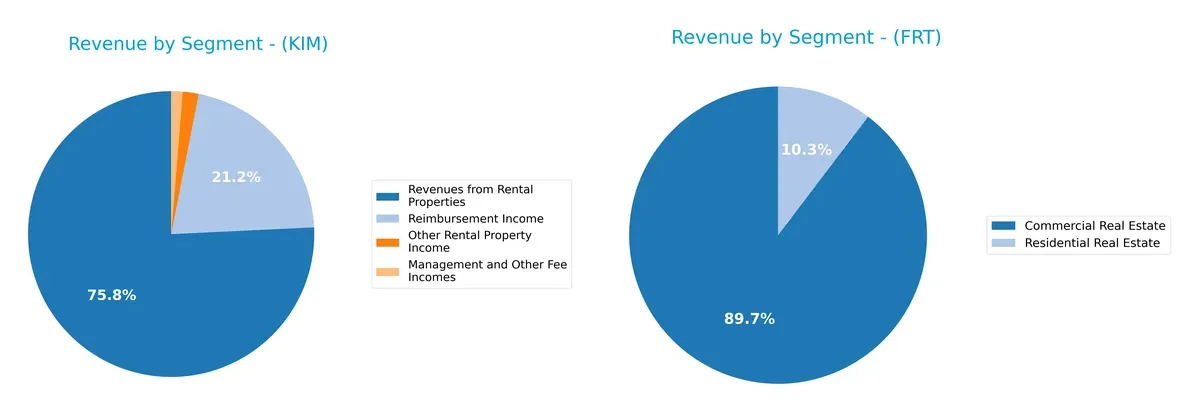
Kimco’s 2018 revenue leans heavily on rental properties at $882M, anchored by $246M reimbursement income and smaller fee streams. Federal Realty pivots on commercial real estate, generating $616M in 2018, supported by $71M in residential. Kimco’s mix shows some diversification but remains concentrated in rentals, risking cyclical real estate trends. Federal Realty’s split between commercial and residential suggests a strategic hedge against sector volatility, balancing ecosystem lock-in with infrastructure dominance.
Strengths and Weaknesses Comparison
This table compares the strengths and weaknesses of Kimco Realty Corporation and Federal Realty Investment Trust:
Kimco Realty Corporation Strengths
- Favorable net margin at 27.32%
- Favorable dividend yield at 4.98%
- Favorable debt-to-assets ratio
- Favorable debt-to-equity ratio
- Diverse rental property income streams
Federal Realty Investment Trust Strengths
- Higher net margin at 32.14%
- Strong ROIC at 134.81%
- Favorable WACC at 5.77%
- Favorable fixed asset turnover
- Favorable debt-to-assets and debt-to-equity ratios
- Dividend yield at 4.48%
Kimco Realty Corporation Weaknesses
- Unfavorable ROE and ROIC at 0%
- Unavailable WACC
- Unfavorable current and quick ratios
- Negative interest coverage
- Unfavorable asset and fixed asset turnover
Federal Realty Investment Trust Weaknesses
- Unfavorable current and quick ratios below 0.5
- Negative interest coverage
- Low asset turnover at 0.14
- Neutral PB and PE ratios
|
Kimco shows solid income diversification and conservative leverage but struggles with profitability and liquidity metrics. Federal Realty delivers superior profitability and capital efficiency but faces liquidity constraints and moderate valuation signals. Both must address liquidity and coverage concerns to support sustained growth.
The Moat Duel: Analyzing Competitive Defensibility
A structural moat is the only reliable shield protecting long-term profits from relentless competitive erosion. Let’s dissect the economic moats of two retail REITs:
Kimco Realty Corporation: Cost-Effective Scale Advantage
Kimco leverages its vast portfolio of grocery-anchored shopping centers to maintain a cost advantage. This manifests as stable gross margins near 69%, supporting decent net margins of 27%. However, a declining ROIC trend signals potential weakening of its capital efficiency. Expansion into mixed-use assets may deepen the moat, but competitive pressures remain a risk in 2026.
Federal Realty Investment Trust: Premium Location & Mixed-Use Network
Federal Realty’s moat stems from high-quality coastal properties and mixed-use urban developments. Its ROIC significantly exceeds WACC, demonstrating strong value creation and expanding profitability. With a 32% net margin and growing EPS, its focus on vibrant, community-centric retail hubs fortifies a sustainable competitive edge. The 2026 outlook favors continued market disruption through targeted urban expansion.
Location Quality vs. Cost Scale: The Moat Showdown
Federal Realty displays a deeper moat with a robust, growing ROIC and premium asset base. Kimco’s scale offers cost benefits but suffers from declining capital returns. Federal Realty is better positioned to defend market share amid evolving retail landscapes.
Which stock offers better returns?
The past year showed notable price gains with Kimco Realty accelerating sharply, while Federal Realty posted steady growth amid higher volatility.
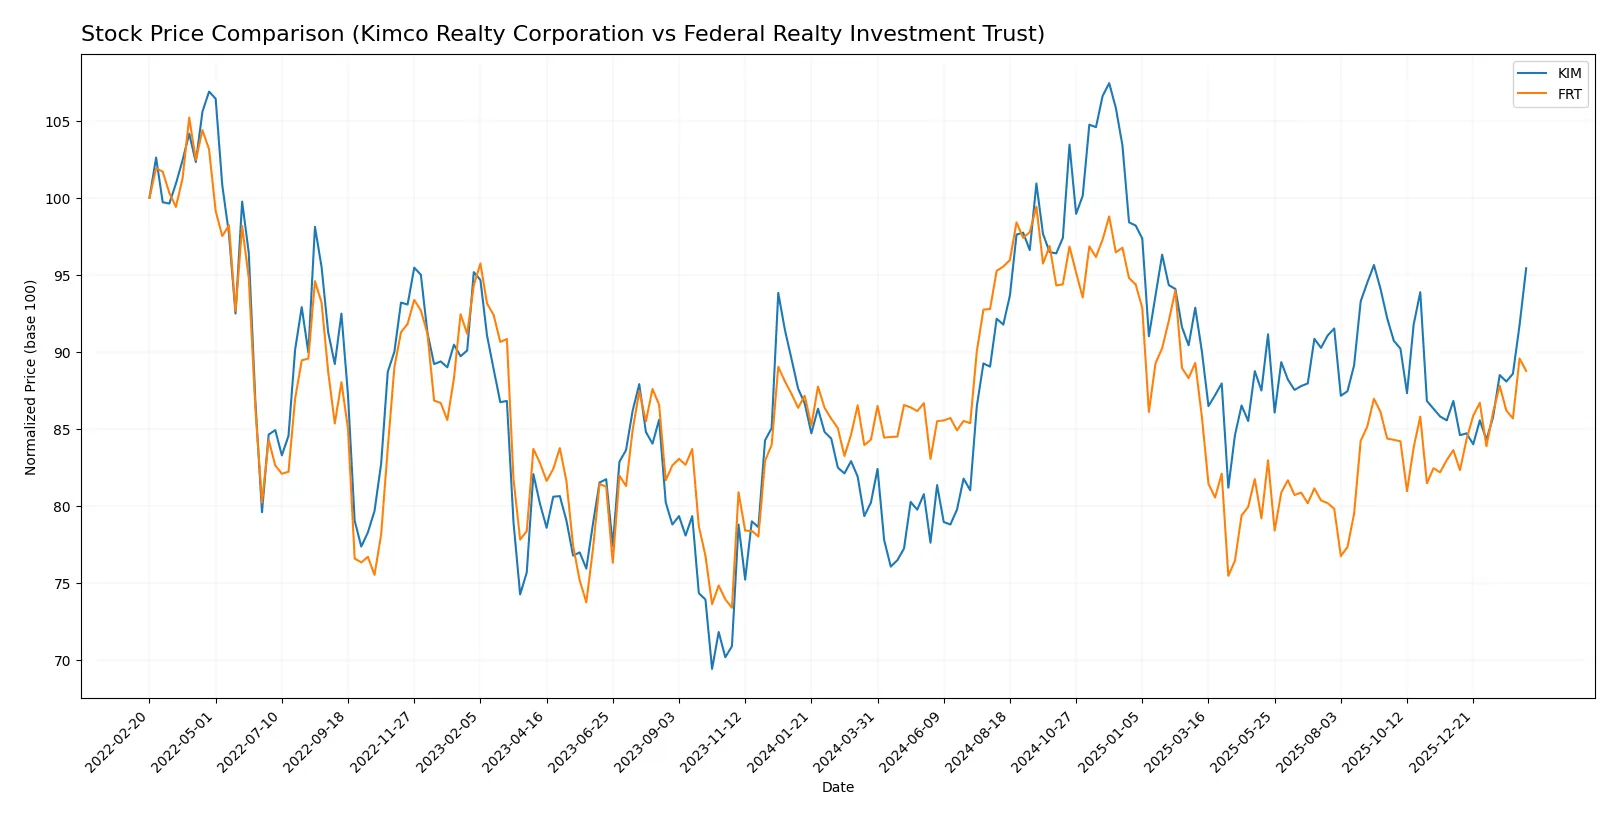
Trend Comparison
Kimco Realty’s stock rose 18.96% over the past year, reflecting a bullish trend with accelerating momentum and a low volatility of 1.7%. It reached a high of 25.57 and a low of 18.1.
Federal Realty’s stock gained 5.29% over the same period, also bullish but with higher volatility at 7.19%. The price trend shows acceleration, peaking at 117.39 and bottoming at 89.09.
Kimco Realty outperformed Federal Realty with a stronger price increase and steadier trend, delivering the highest market performance over the last year.
Target Prices
Analysts present a confident target consensus for Kimco Realty Corporation and Federal Realty Investment Trust.
| Company | Target Low | Target High | Consensus |
|---|---|---|---|
| Kimco Realty Corporation | 21 | 26 | 24.14 |
| Federal Realty Investment Trust | 105 | 115 | 109.33 |
Kimco’s consensus target of 24.14 is modestly above its current price of 22.71, suggesting moderate upside. Federal Realty’s target consensus of 109.33 exceeds its current 104.8 price, indicating positive analyst sentiment for further gains.

Don’t Let Luck Decide Your Entry Point
Optimize your entry points with our advanced ProRealTime indicators. You’ll get efficient buy signals with precise price targets for maximum performance. Start outperforming now!
How do institutions grade them?
The following tables summarize recent institutional grades for Kimco Realty Corporation and Federal Realty Investment Trust:
Kimco Realty Corporation Grades
This table presents recent analyst grades and recommendations for Kimco Realty Corporation.
| Grading Company | Action | New Grade | Date |
|---|---|---|---|
| Evercore ISI Group | maintain | In Line | 2026-02-13 |
| Truist Securities | maintain | Hold | 2026-01-20 |
| UBS | maintain | Buy | 2026-01-08 |
| Wells Fargo | maintain | Equal Weight | 2025-12-15 |
| Citigroup | maintain | Neutral | 2025-12-03 |
| Argus Research | maintain | Buy | 2025-12-01 |
| Scotiabank | maintain | Sector Perform | 2025-11-13 |
| Barclays | maintain | Overweight | 2025-10-06 |
| Evercore ISI Group | maintain | In Line | 2025-09-08 |
| Barclays | maintain | Overweight | 2025-08-27 |
Federal Realty Investment Trust Grades
This table presents recent analyst grades and recommendations for Federal Realty Investment Trust.
| Grading Company | Action | New Grade | Date |
|---|---|---|---|
| Stifel | maintain | Hold | 2026-02-13 |
| Scotiabank | maintain | Sector Outperform | 2026-01-14 |
| JP Morgan | upgrade | Overweight | 2025-12-18 |
| Jefferies | upgrade | Buy | 2025-12-16 |
| Truist Securities | maintain | Hold | 2025-12-02 |
| Barclays | downgrade | Equal Weight | 2025-11-18 |
| Evercore ISI Group | maintain | In Line | 2025-11-03 |
| Wells Fargo | maintain | Overweight | 2025-10-21 |
| Evercore ISI Group | maintain | In Line | 2025-10-17 |
| Barclays | maintain | Overweight | 2025-10-16 |
Which company has the best grades?
Federal Realty Investment Trust generally holds more upgrades, including Buy and Overweight ratings from top firms. Kimco Realty’s grades remain mostly Hold and In Line. This contrast could influence investor sentiment towards Federal Realty as a stronger growth or value candidate.
Risks specific to each company
The following categories identify the critical pressure points and systemic threats facing both firms in the 2026 market environment:
1. Market & Competition
Kimco Realty Corporation
- Faces intense competition in grocery-anchored shopping centers with market cap of $15.4B.
Federal Realty Investment Trust
- Competes in high-quality retail coastal markets with smaller $9B market cap.
2. Capital Structure & Debt
Kimco Realty Corporation
- Strong debt-to-equity position but interest coverage is negative, signaling risk.
Federal Realty Investment Trust
- Maintains favorable debt ratios but also suffers from negative interest coverage.
3. Stock Volatility
Kimco Realty Corporation
- Beta near 1.08 suggests volatility aligns with market swings.
Federal Realty Investment Trust
- Lower beta of 0.52 implies less price volatility versus market.
4. Regulatory & Legal
Kimco Realty Corporation
- Exposed to evolving real estate regulations in major U.S. metros.
Federal Realty Investment Trust
- Faces regulatory scrutiny in coastal urban redevelopment projects.
5. Supply Chain & Operations
Kimco Realty Corporation
- Operates 400 centers; geographic diversity offers operational resilience.
Federal Realty Investment Trust
- Smaller footprint with 106 properties but focuses on mixed-use urban developments.
6. ESG & Climate Transition
Kimco Realty Corporation
- Limited data on ESG; exposure to climate risks in retail real estate.
Federal Realty Investment Trust
- Emphasizes sustainable urban growth, potentially mitigating climate transition risks.
7. Geopolitical Exposure
Kimco Realty Corporation
- Primarily U.S.-focused, limiting geopolitical risk but sensitive to national policy shifts.
Federal Realty Investment Trust
- Also U.S.-concentrated with focus on stable coastal markets, reducing geopolitical volatility.
Which company shows a better risk-adjusted profile?
Kimco’s biggest risk is its weak interest coverage despite favorable leverage, signaling financial stress. Federal Realty’s principal risk lies in its very low liquidity ratios and moderate Altman Z-Score in distress zone. Federal Realty’s stronger ROIC (135%) and debt management give it a more balanced risk profile. However, both firms share distress zone bankruptcy risks, warranting caution. Federal Realty’s lower beta and focus on resilient coastal markets support a safer risk-adjusted stance in today’s environment.
Final Verdict: Which stock to choose?
Kimco Realty Corporation’s superpower lies in its steady cash generation and attractive dividend yield. However, its declining ROIC and weaker interest coverage signal a need for caution. It fits portfolios seeking income with a tolerance for operational and financial variability.
Federal Realty Investment Trust boasts a robust moat, demonstrated by a soaring ROIC well above its cost of capital. Its superior capital efficiency and stronger balance sheet offer better stability compared to Kimco. It suits investors favoring quality growth with moderate risk.
If you prioritize durable competitive advantages and capital efficiency, Federal Realty outshines due to its sustainable value creation and healthier financial profile. However, if your focus is on income generation with some growth upside, Kimco presents an analytical scenario worth considering despite its challenges.
Disclaimer: Investment carries a risk of loss of initial capital. The past performance is not a reliable indicator of future results. Be sure to understand risks before making an investment decision.
Go Further
I encourage you to read the complete analyses of Kimco Realty Corporation and Federal Realty Investment Trust to enhance your investment decisions: