Home > Comparison > Industrials > GWW vs FAST
The strategic rivalry between W.W. Grainger, Inc. and Fastenal Company shapes the industrial distribution sector’s evolution. Grainger operates as a broad-scope distributor with a high-touch, service-oriented model, while Fastenal emphasizes extensive market reach through thousands of local outlets. This analysis pits Grainger’s solution-driven approach against Fastenal’s scale advantage to identify which offers superior risk-adjusted returns for diversified portfolios navigating industrial market cycles.
Table of contents
Companies Overview
W.W. Grainger and Fastenal Company are pivotal players in the industrial distribution sector with substantial market footprints.
W.W. Grainger, Inc.: Industrial MRO Distribution Leader
W.W. Grainger commands a strong market position distributing maintenance, repair, and operating (MRO) products globally. Its core revenue derives from safety supplies, plumbing equipment, and inventory management services. In 2026, Grainger emphasizes enhancing its High-Touch Solutions and expanding its Endless Assortment to deepen customer engagement and service breadth.
Fastenal Company: Industrial and Construction Supplies Distributor
Fastenal Company specializes in wholesale distribution of industrial and construction fasteners and hardware. Its revenue engine centers on supplying threaded fasteners and miscellaneous hardware to manufacturing and construction markets. Fastenal’s 2026 strategy focuses on expanding its network of 3,209 in-market locations and streamlining distribution through 15 centers for faster delivery and market penetration.
Strategic Collision: Similarities & Divergences
Both companies operate in industrial distribution but differ in business philosophy. Grainger invests heavily in service-driven solutions and digital channels, while Fastenal prioritizes physical presence and rapid local fulfillment. Their primary battleground is customer reach and supply chain efficiency. This divergence creates distinct investment profiles: Grainger leans on innovation and customer intimacy, Fastenal on scale and operational leverage.
Income Statement Comparison
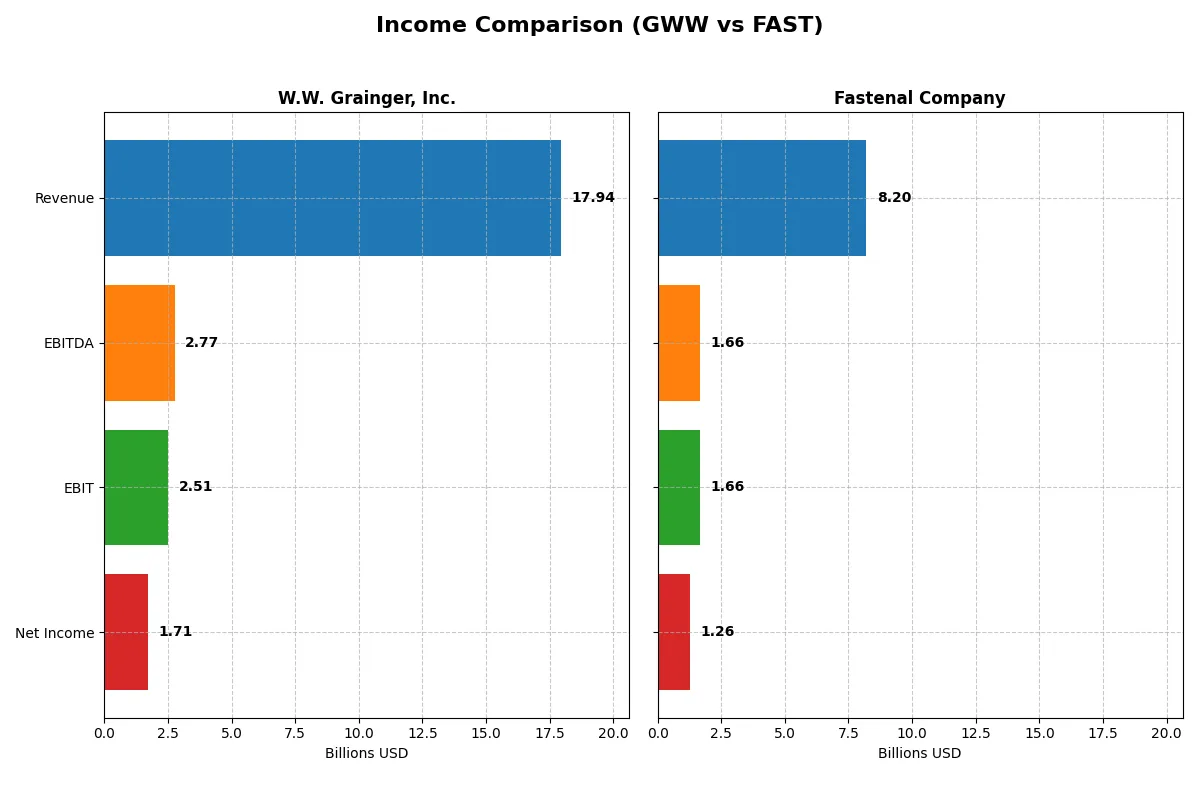
The following data dissects the core profitability and scalability of both corporate engines to reveal who dominates the bottom line:
| Metric | W.W. Grainger, Inc. (GWW) | Fastenal Company (FAST) |
|---|---|---|
| Revenue | 17.9B | 8.2B |
| Cost of Revenue | 10.9B | 4.5B |
| Operating Expenses | 4.3B | 2.0B |
| Gross Profit | 7.0B | 3.7B |
| EBITDA | 2.8B | 1.7B |
| EBIT | 2.5B | 1.7B |
| Interest Expense | 81M | 6.2M |
| Net Income | 1.7B | 1.3B |
| EPS | 35.47 | 1.10 |
| Fiscal Year | 2025 | 2025 |
Income Statement Analysis: The Bottom-Line Duel
This income statement comparison reveals which company operates with superior efficiency and stronger profitability through recent market cycles.
W.W. Grainger, Inc. Analysis
W.W. Grainger’s revenue climbed steadily from 13B in 2021 to 17.9B in 2025, with net income rising from 1.04B to 1.71B. Its gross margin holds firm near 39%, but net margin slipped to 9.5% in 2025, reflecting rising operating expenses. The latest year shows weaker EBIT and net margin growth, signaling margin pressure despite solid top-line gains.
Fastenal Company Analysis
Fastenal’s revenue expanded from 6B in 2021 to 8.2B in 2025, with net income advancing from 925M to 1.26B. It boasts a superior 45% gross margin and a stronger 15.4% net margin. Fastenal sustains robust EBIT and EPS growth, with operating expenses scaling favorably, underscoring increasing operational efficiency and momentum in 2025.
Margin Strength vs. Revenue Momentum
Fastenal outperforms W.W. Grainger on profitability and margin expansion, delivering higher net and EBIT margins alongside consistent earnings growth. Grainger shows stronger absolute revenue and net income growth over five years but faces margin compression recently. Investors prioritizing margin quality and operational efficiency may find Fastenal’s profile more compelling.
Financial Ratios Comparison
These vital ratios act as a diagnostic tool to expose the underlying fiscal health, valuation premiums, and capital efficiency of the companies compared here:
| Ratios | W.W. Grainger, Inc. (GWW) | Fastenal Company (FAST) |
|---|---|---|
| ROE | 41.2% | 31.9% |
| ROIC | 24.3% | 27.5% |
| P/E | 28.3 | 36.6 |
| P/B | 11.7 | 11.7 |
| Current Ratio | 2.83 | 4.85 |
| Quick Ratio | 1.59 | 2.41 |
| D/E | 0.76 | 0.11 |
| Debt-to-Assets | 35.3% | 8.7% |
| Interest Coverage | 30.8 | 267.0 |
| Asset Turnover | 2.00 | 1.62 |
| Fixed Asset Turnover | 6.87 | 5.69 |
| Payout ratio | 27.4% | 79.8% |
| Dividend yield | 0.97% | 2.18% |
| Fiscal Year | 2025 | 2025 |
Efficiency & Valuation Duel: The Vital Signs
Financial ratios serve as a company’s DNA, uncovering hidden risks and revealing operational strengths or weaknesses.
W.W. Grainger, Inc.
W.W. Grainger delivers a strong 41.2% ROE and solid 9.51% net margin, showcasing operational efficiency. Its P/E of 28.3 and P/B of 11.7 mark the stock as stretched relative to average benchmarks. Dividends yield under 1% while reinvestment focuses on maintaining asset turnover and capital returns, signaling disciplined capital allocation.
Fastenal Company
Fastenal posts a 31.9% ROE with a higher net margin at 15.35%, reflecting robust profitability. Despite a steeper P/E of 36.6 and similar P/B to Grainger, Fastenal’s very favorable ratio profile includes a strong dividend yield of 2.18% and low debt, emphasizing shareholder returns and financial stability.
Premium Valuation vs. Operational Safety
Fastenal’s higher profitability and dependable dividends come with a premium valuation, while Grainger balances strong returns with moderate risk in capital structure. Risk-tolerant investors may prefer Fastenal’s yield and growth mix; conservative profiles might lean toward Grainger’s operational resilience and reinvestment discipline.
Which one offers the Superior Shareholder Reward?
I observe W.W. Grainger, Inc. (GWW) delivers a modest 0.97% dividend yield with a prudent 27% payout ratio and robust free cash flow coverage at 66%. Its buyback activity appears conservative but consistent, supporting shareholder value sustainably. Fastenal Company (FAST) offers a higher 2.18% yield but with an aggressive 80% payout ratio, pressuring cash flow coverage near 81%. FAST’s buybacks are more intense, amplifying total returns but raising sustainability concerns given the high payout. I favor GWW’s balanced distribution and buyback strategy for durable total returns in 2026.
Comparative Score Analysis: The Strategic Profile
The radar chart reveals the fundamental DNA and trade-offs of W.W. Grainger, Inc. and Fastenal Company, highlighting their strategic strengths and weaknesses:
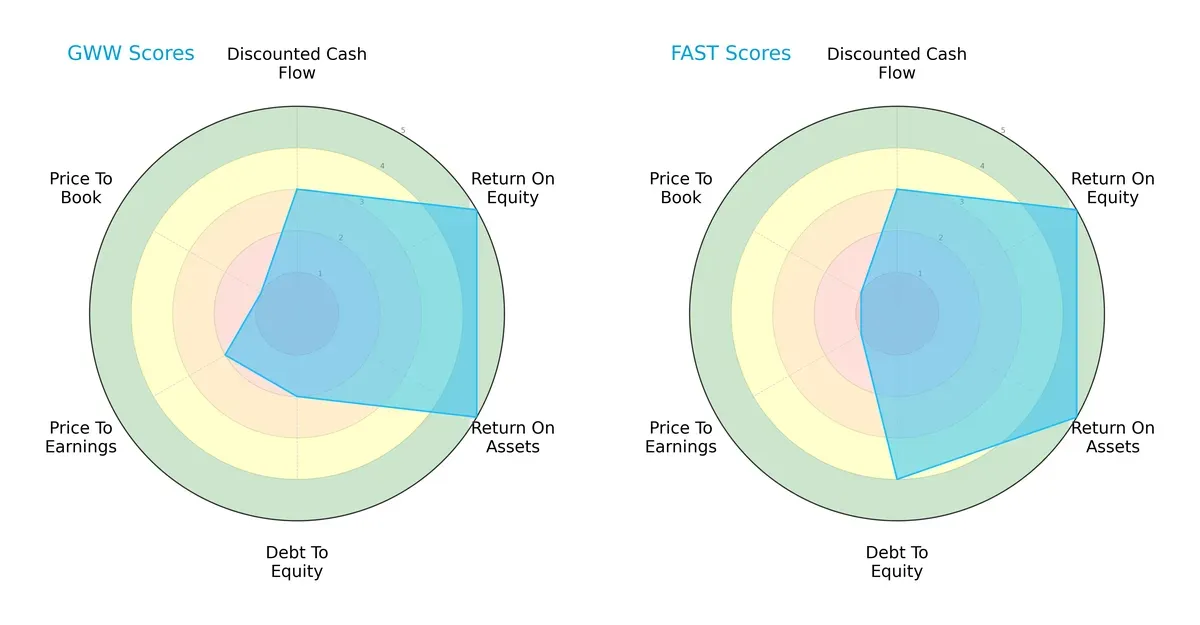
Both firms score equally on discounted cash flow (3), return on equity (5), and return on assets (5), indicating solid profitability and cash flow fundamentals. However, Fastenal holds a clear edge in financial stability with a debt-to-equity score of 4 versus Grainger’s weaker 2. Conversely, Grainger fares worse in valuation metrics, scoring 2 on price-to-earnings and 1 on price-to-book, while Fastenal scores 1 on both, signaling possible overvaluation risks. Overall, Fastenal presents a more balanced profile with superior leverage management, whereas Grainger relies heavily on operational efficiency but faces valuation headwinds.
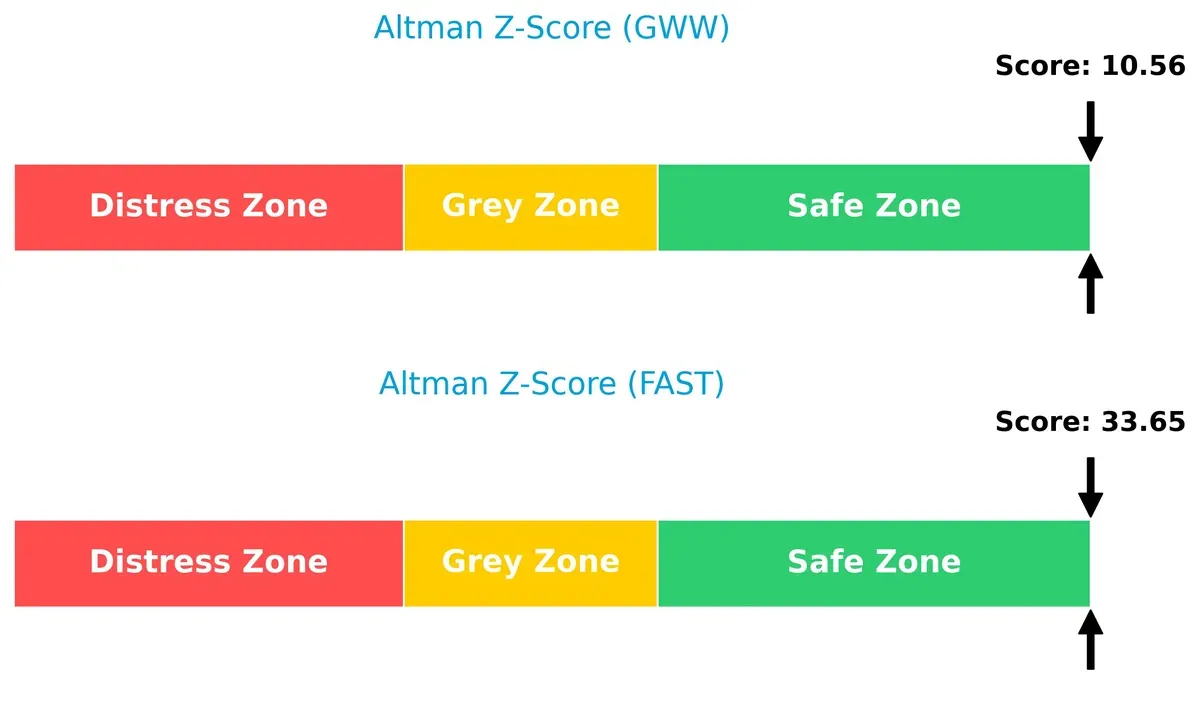
Bankruptcy Risk: Solvency Showdown
The Altman Z-Score delta between Fastenal (33.6) and Grainger (10.6) indicates both firms reside securely in the safe zone, but Fastenal’s much higher score suggests a significantly stronger buffer against bankruptcy risk in this market cycle:
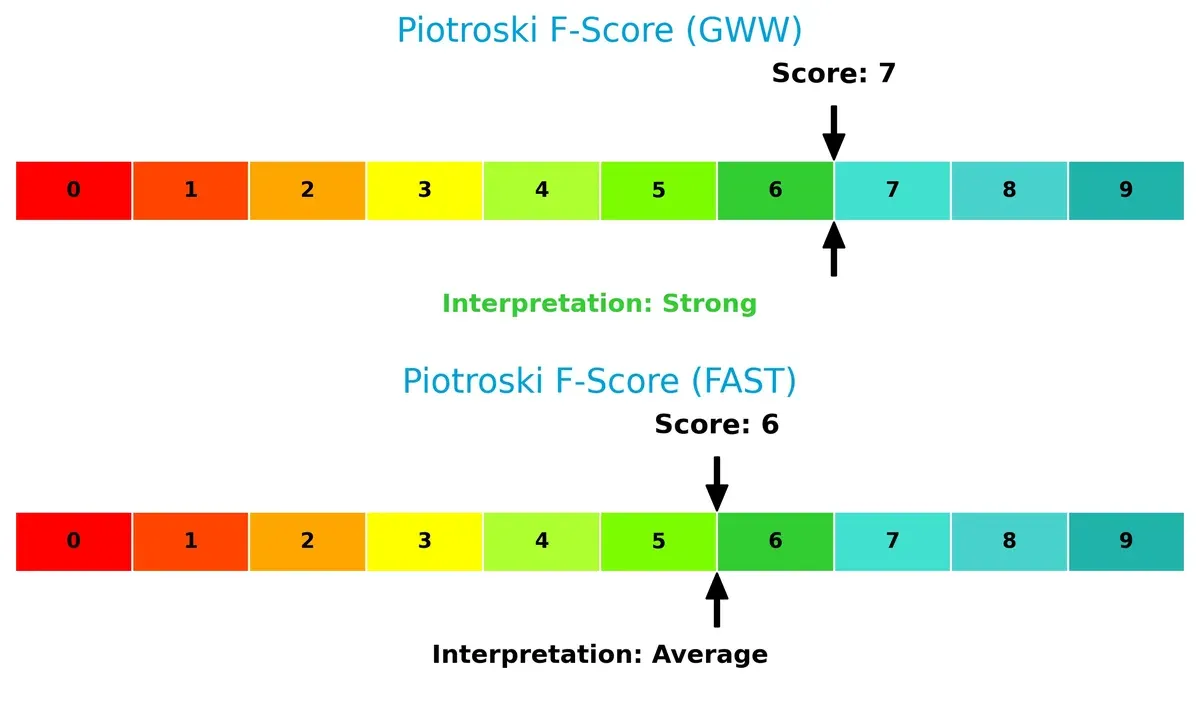
Financial Health: Quality of Operations
Grainger’s Piotroski F-Score of 7 surpasses Fastenal’s 6, signaling slightly stronger financial health and operational quality. Grainger’s higher score suggests fewer red flags in profitability, liquidity, and efficiency metrics:
How are the two companies positioned?
This section dissects the operational DNA of W.W. Grainger and Fastenal by comparing their revenue distribution and internal dynamics. The goal is to confront their economic moats and identify which business model offers the most resilient, sustainable competitive advantage today.
Revenue Segmentation: The Strategic Mix
The following visual comparison dissects how W.W. Grainger, Inc. and Fastenal Company diversify their income streams and where their primary sector bets lie:
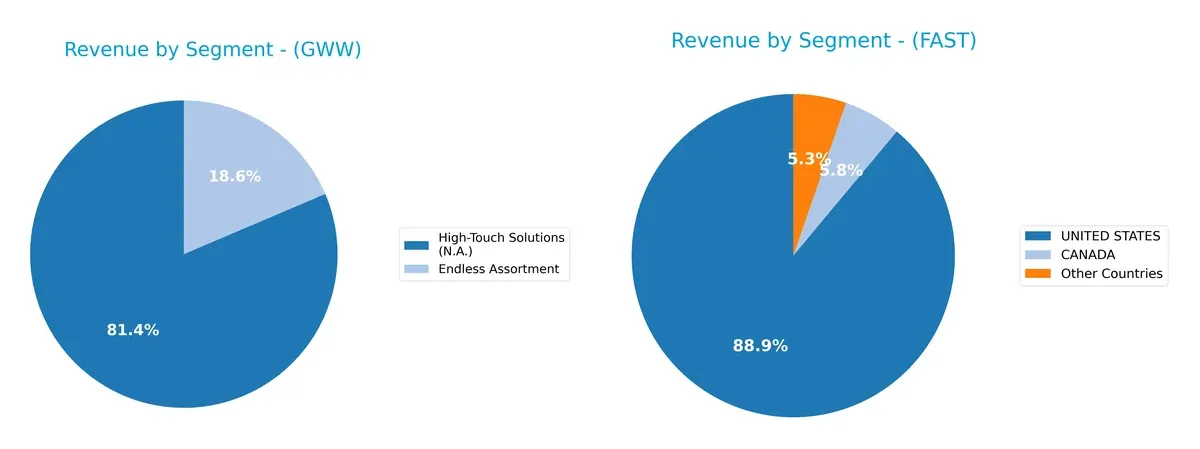
W.W. Grainger leans heavily on its High-Touch Solutions segment, generating $13.7B in 2024, while Endless Assortment adds $3.1B. In contrast, Fastenal’s revenue splits more evenly across the United States ($3.4B), Canada ($223M), and other countries ($205M). Grainger’s concentration in High-Touch Solutions anchors its ecosystem dominance but risks exposure to sector swings. Fastenal’s geographic spread reduces concentration risk, supporting resilient growth.
Strengths and Weaknesses Comparison
This table compares the strengths and weaknesses of W.W. Grainger, Inc. and Fastenal Company:
W.W. Grainger, Inc. Strengths
- Favorable ROE at 41.2% and ROIC at 24.26%
- Strong current and quick ratios indicating liquidity
- High asset turnover and fixed asset turnover
- Diverse revenue streams including Endless Assortment and High-Touch Solutions
- Established global presence with significant revenue from US, Japan, Canada, and other countries
Fastenal Company Strengths
- Higher net margin at 15.35% and favorable ROIC at 27.52%
- Very favorable capital structure with low debt-to-assets
- Outstanding interest coverage at 267
- Strong quick ratio and dividend yield
- Broad geographic revenue diversification with US, Canada, Mexico, and Non-North America markets
W.W. Grainger, Inc. Weaknesses
- Unfavorable valuation multiples: PE at 28.33 and PB at 11.67
- Moderate debt with neutral D/E and debt-to-assets
- Dividend yield below 1% may deter income investors
- Net margin only neutral at 9.51%
Fastenal Company Weaknesses
- Unfavorable PE ratio at 36.6 and high PB at 11.68
- Unfavorable current ratio at 4.85 may indicate inefficient asset use
- Net margin and dividend yield strong but PE valuation is stretched
Both companies show strong operational profitability and geographic diversification. However, Grainger’s valuation appears more reasonable despite lower net margin, while Fastenal excels in capital efficiency and interest coverage but faces valuation risks. These factors shape each company’s strategic focus on balancing growth with prudent capital management.
The Moat Duel: Analyzing Competitive Defensibility
A structural moat is the only thing protecting long-term profits from the erosion of competition. Here’s how these two industrial distributors compare:
W.W. Grainger, Inc.: Switching Costs Moat
I see Grainger’s moat rooted in strong switching costs via integrated inventory management and technical support. Its steady 15.6% ROIC above WACC confirms value creation. New digital tools in 2026 could deepen this advantage, though margin pressure warns of rising competition.
Fastenal Company: Cost Advantage Moat
Fastenal leverages a cost advantage through an expansive, efficient distribution network. Its 19.6% ROIC surpasses Grainger’s, fueling faster growth and margin expansion. Continued investment in local market density and automation in 2026 should solidify its lead in operational efficiency.
Switching Costs vs. Cost Efficiency: The Moat Battle
Fastenal’s cost advantage moat is wider and shows a sharper ROIC growth trend than Grainger’s switching cost moat. I believe Fastenal is better positioned to defend market share amid industry cost pressures and evolving customer demands.
Which stock offers better returns?
The past year saw both W.W. Grainger, Inc. and Fastenal Company exhibit strong upward momentum, with accelerating bullish trends and increasing trading volumes highlighting investor confidence.
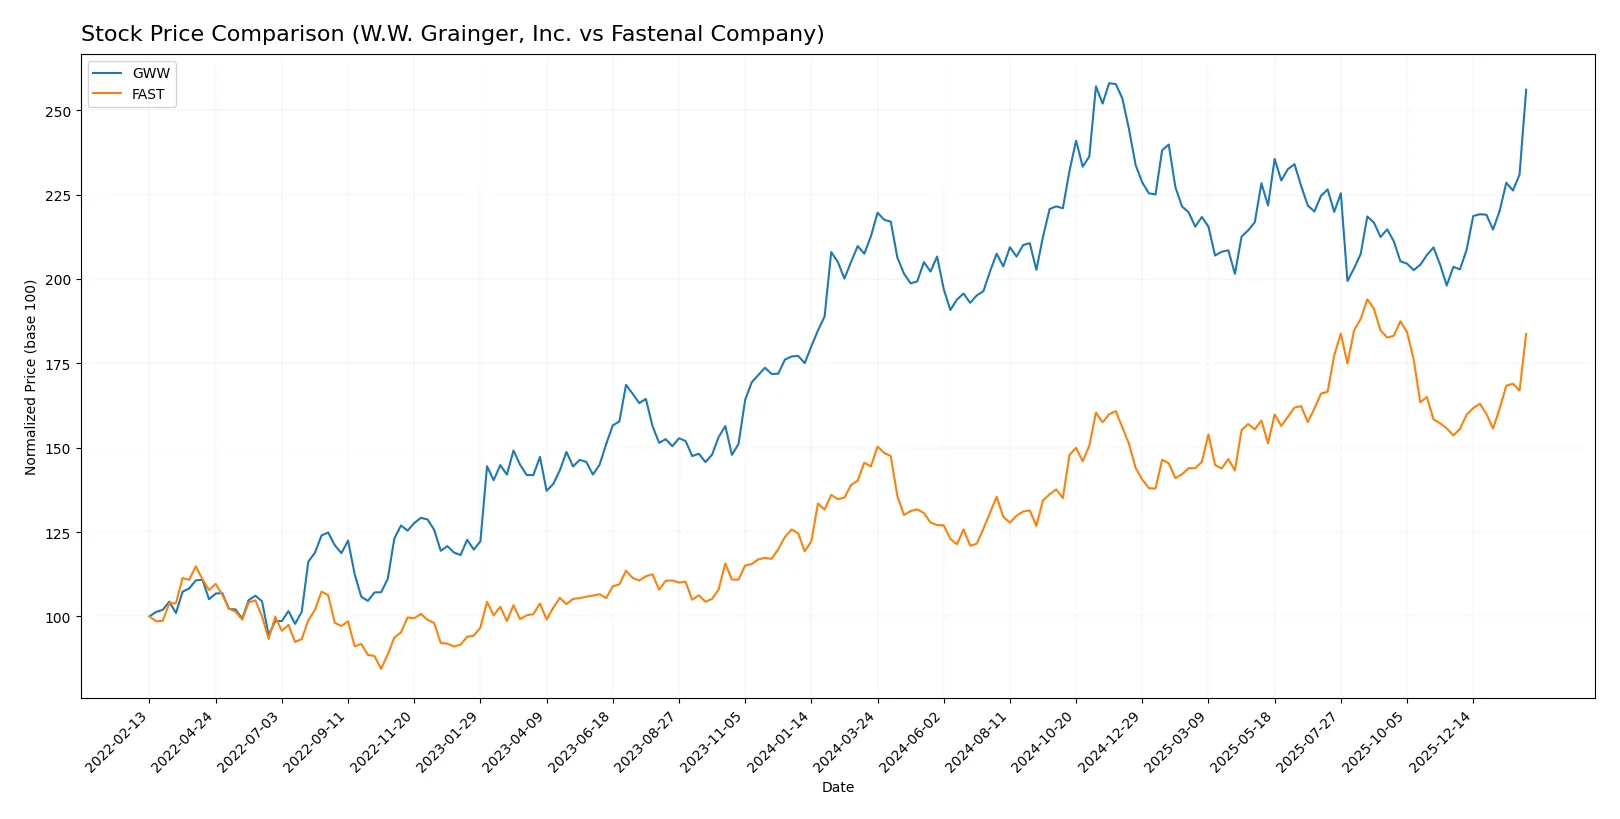
Trend Comparison
W.W. Grainger, Inc. posted a 20.44% price increase over the past 12 months, showing a bullish trend with accelerating momentum and a high price volatility of 72.27. The stock hit a peak of 1206.65 and a low of 892.25.
Fastenal Company experienced a 27.21% price rise in the same period, also bullish with acceleration. It demonstrated significantly lower volatility at 4.7, with a highest price of 50.39 and a lowest of 31.42.
Fastenal outperformed W.W. Grainger with a higher overall price gain of 27.21% versus 20.44%, delivering stronger market performance over the 12-month timeframe.
Target Prices
Analysts present a balanced target consensus for W.W. Grainger, Inc. and Fastenal Company reflecting moderate upside potential.
| Company | Target Low | Target High | Consensus |
|---|---|---|---|
| W.W. Grainger, Inc. | 1,044 | 1,300 | 1,162.83 |
| Fastenal Company | 43 | 52 | 48 |
The consensus target for Grainger stands slightly below its current price of 1,197.65, signaling modest caution. Fastenal’s consensus target at 48 exceeds its current price of 47.73, indicating mild analyst optimism.

Don’t Let Luck Decide Your Entry Point
Optimize your entry points with our advanced ProRealTime indicators. You’ll get efficient buy signals with precise price targets for maximum performance. Start outperforming now!
How do institutions grade them?
W.W. Grainger, Inc. Grades
The following table summarizes recent grades from reputable institutions for W.W. Grainger, Inc.:
| Grading Company | Action | New Grade | Date |
|---|---|---|---|
| JP Morgan | Maintain | Neutral | 2026-02-06 |
| Oppenheimer | Maintain | Outperform | 2026-02-04 |
| Oppenheimer | Upgrade | Outperform | 2026-01-27 |
| JP Morgan | Maintain | Neutral | 2026-01-16 |
| Morgan Stanley | Maintain | Equal Weight | 2025-11-25 |
| Barclays | Maintain | Underweight | 2025-11-07 |
| RBC Capital | Maintain | Sector Perform | 2025-11-03 |
| RBC Capital | Maintain | Sector Perform | 2025-10-16 |
| JP Morgan | Maintain | Neutral | 2025-10-15 |
| JP Morgan | Maintain | Neutral | 2025-09-04 |
Fastenal Company Grades
The following table summarizes recent grades from reputable institutions for Fastenal Company:
| Grading Company | Action | New Grade | Date |
|---|---|---|---|
| Barclays | Maintain | Equal Weight | 2026-01-21 |
| Jefferies | Upgrade | Buy | 2025-12-15 |
| Wolfe Research | Downgrade | Underperform | 2025-11-13 |
| Barclays | Maintain | Equal Weight | 2025-11-13 |
| Barclays | Maintain | Equal Weight | 2025-10-14 |
| JP Morgan | Maintain | Neutral | 2025-09-04 |
| Baird | Upgrade | Outperform | 2025-08-07 |
| Baird | Maintain | Neutral | 2025-07-15 |
| Stephens & Co. | Maintain | Equal Weight | 2025-07-15 |
| JP Morgan | Maintain | Neutral | 2025-07-15 |
Which company has the best grades?
W.W. Grainger, Inc. generally receives neutral to outperform grades, while Fastenal shows more variation including a buy upgrade and an underperform downgrade. Investors may view W.W. Grainger’s steadier ratings as signaling more consistent analyst confidence.
Risks specific to each company
The following categories identify the critical pressure points and systemic threats facing W.W. Grainger, Inc. and Fastenal Company in the 2026 market environment:
1. Market & Competition
W.W. Grainger, Inc.
- Faces intense competition in MRO distribution with pressure on net margin at 9.51%.
Fastenal Company
- Stronger net margin at 15.35% reflects better competitive positioning.
2. Capital Structure & Debt
W.W. Grainger, Inc.
- Debt-to-equity ratio of 0.76 signals moderate leverage risk.
Fastenal Company
- Low debt-to-equity ratio of 0.11 indicates strong balance sheet and financial flexibility.
3. Stock Volatility
W.W. Grainger, Inc.
- Beta at 1.108 implies higher stock volatility than market average.
Fastenal Company
- Beta at 0.885 suggests lower volatility and more stability.
4. Regulatory & Legal
W.W. Grainger, Inc.
- Operates globally with exposure to complex regulatory environments.
Fastenal Company
- Similar international exposure but with more diversified product lines reducing regulatory concentration risk.
5. Supply Chain & Operations
W.W. Grainger, Inc.
- Depends on global supply chains for MRO products, vulnerable to disruptions.
Fastenal Company
- Extensive network of 3,209 locations and 15 distribution centers mitigates operational risks.
6. ESG & Climate Transition
W.W. Grainger, Inc.
- Increasing pressure to align with ESG goals; transition risks remain undefined.
Fastenal Company
- Proactively addressing ESG with operational efficiencies and lower carbon footprint initiatives.
7. Geopolitical Exposure
W.W. Grainger, Inc.
- Exposure to US, Japan, UK, Canada markets with geopolitical uncertainties.
Fastenal Company
- Broad North American focus reduces geopolitical concentration but includes Mexico’s volatility risks.
Which company shows a better risk-adjusted profile?
Fastenal’s low leverage and superior net margin stand out as its most impactful strengths. Grainger’s moderate debt and higher stock volatility pose the greatest risks. Fastenal’s stronger Altman Z-score (33.6 vs. 10.6) and more favorable capital structure underpin a better risk-adjusted profile in today’s uncertain market.
Final Verdict: Which stock to choose?
W.W. Grainger, Inc. excels as a capital allocator with a proven ability to generate returns well above its cost of capital. Its superpower lies in operational efficiency and a resilient competitive advantage. However, investors should watch its recent margin contraction as a point of vigilance. It suits portfolios aiming for aggressive growth with a tolerance for cyclical fluctuations.
Fastenal Company boasts a strategic moat rooted in strong recurring revenues and a conservative balance sheet. Its financial safety profile surpasses Grainger’s, marked by lower leverage and robust liquidity. Fastenal fits well within GARP portfolios seeking steady growth combined with prudent risk management.
If you prioritize high operational leverage and potential upside in cyclical rebounds, W.W. Grainger outshines as the compelling choice due to its superior ROE and expanding moat. However, if you seek better stability and lower financial risk with consistent free cash flow, Fastenal offers a more balanced profile for conservative growth investors. Both exhibit strong moats but cater to distinct investor avatars.
Disclaimer: Investment carries a risk of loss of initial capital. The past performance is not a reliable indicator of future results. Be sure to understand risks before making an investment decision.
Go Further
I encourage you to read the complete analyses of W.W. Grainger, Inc. and Fastenal Company to enhance your investment decisions: