Home > Comparison > Industrials > FAST vs POOL
The strategic rivalry between Fastenal Company and Pool Corporation shapes the industrial distribution landscape. Fastenal operates as a broad-based wholesale distributor of industrial and construction supplies, while Pool Corporation focuses on specialized pool equipment and leisure product distribution. This contrast highlights a battle between diversified industrial supply and niche market dominance. This analysis aims to identify which company offers the superior risk-adjusted return for a well-rounded investment portfolio in 2026.
Table of contents
Companies Overview
Fastenal Company and Pool Corporation hold pivotal roles in industrial distribution, shaping their respective niche markets.
Fastenal Company: Industrial Supply Powerhouse
Fastenal Company dominates the wholesale distribution of industrial and construction supplies across North America and beyond. Its core revenue derives from fasteners like bolts and screws, essential for manufacturing and construction. In 2026, Fastenal sharpened its strategic focus on expanding its network of 3,209 in-market locations and 15 distribution centers, reinforcing its broad physical footprint.
Pool Corporation: Premier Pool Supplies Distributor
Pool Corporation leads in distributing swimming pool supplies and leisure products internationally. It generates revenue through maintenance chemicals, repair parts, and pool construction materials. In 2026, the company emphasized growing its 410 sales centers globally, targeting commercial clients and specialty retailers to deepen market penetration.
Strategic Collision: Similarities & Divergences
Both firms excel in industrial distribution but diverge in product specialization—Fastenal in essential construction fasteners, Pool in recreational pool components. Their battleground lies in servicing professional contractors and retail channels. Fastenal’s extensive location network contrasts Pool’s focused sales centers, defining distinct operational scales and investment risk profiles.
Income Statement Comparison
This data dissects the core profitability and scalability of both corporate engines to reveal who dominates the bottom line:
| Metric | Fastenal Company (FAST) | Pool Corporation (POOL) |
|---|---|---|
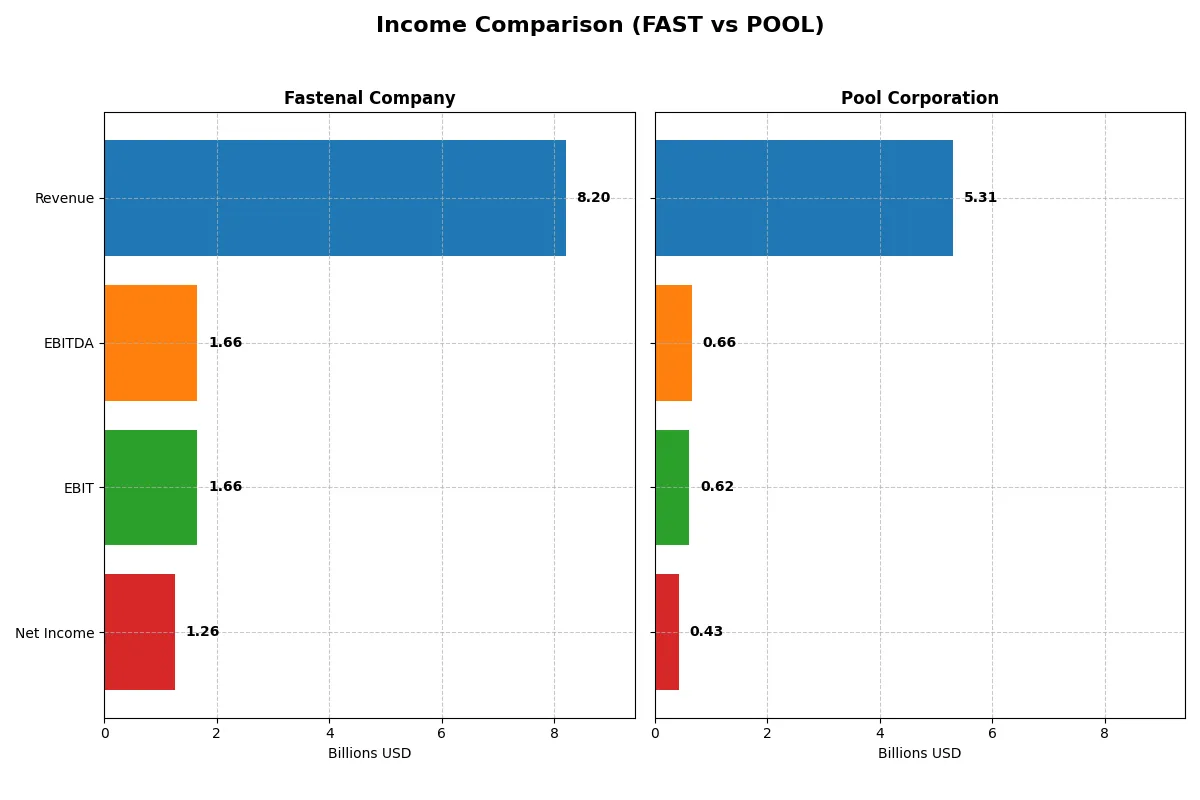
| Revenue | 8.2B | 5.3B |
| Cost of Revenue | 4.5B | 3.7B |
| Operating Expenses | 2.0B | 958M |
| Gross Profit | 3.7B | 1.6B |
| EBITDA | 1.7B | 663M |
| EBIT | 1.7B | 617M |
| Interest Expense | 6.2M | 50M |
| Net Income | 1.3B | 434M |
| EPS | 1.10 | 11.37 |
| Fiscal Year | 2025 | 2024 |
Income Statement Analysis: The Bottom-Line Duel
This income statement comparison reveals which company drives superior operational efficiency and profit generation through recent financial performance.
Fastenal Company Analysis
Fastenal’s revenue climbed steadily from 6B in 2021 to 8.2B in 2025, with net income rising from 925M to 1.26B. The firm sustains healthy margins, boasting a 45% gross margin and 15.4% net margin in 2025. Its latest year shows strong momentum, with revenue and EBIT growing over 8%, signaling efficient cost control and robust profitability.
Pool Corporation Analysis
Pool’s revenue peaked at 6.2B in 2022 but declined to 5.3B by 2024, dragging net income down from 748M to 434M. Despite a respectable 29.7% gross margin, net margin fell to 8.2% in 2024, reflecting margin compression and rising expenses. The latest year reveals negative growth across key metrics, indicating challenges in sustaining operational efficiency.
Verdict: Margin Strength vs. Revenue Momentum
Fastenal outperforms Pool with superior margin profiles and consistent revenue growth, delivering higher net income and expanding profitability. Pool’s declining top line and shrinking margins highlight structural pressures. Investors seeking stable earnings growth will find Fastenal’s efficient, profitable model more attractive than Pool’s recent volatility.
Financial Ratios Comparison
These vital ratios act as a diagnostic tool to expose the underlying fiscal health, valuation premiums, and capital efficiency of the companies compared:
| Ratios | Fastenal Company (FAST) | Pool Corporation (POOL) |
|---|---|---|
| ROE | 32% | 34% |
| ROIC | 28% | 18% |
| P/E | 37 | 30 |
| P/B | 12 | 10 |
| Current Ratio | 4.85 | 2.05 |
| Quick Ratio | 2.41 | 0.52 |
| D/E | 0.11 | 1.00 |
| Debt-to-Assets | 9% | 38% |
| Interest Coverage | 267 | 12 |
| Asset Turnover | 1.62 | 1.58 |
| Fixed Asset Turnover | 5.69 | 9.38 |
| Payout ratio | 80% | 41% |
| Dividend yield | 2.18% | 1.39% |
| Fiscal Year | 2025 | 2024 |
Efficiency & Valuation Duel: The Vital Signs
Financial ratios act as the company’s DNA, unveiling hidden operational strengths and risks that raw numbers alone cannot reveal.
Fastenal Company
Fastenal delivers strong profitability with a 31.9% ROE and a robust 15.35% net margin, signaling operational excellence. The stock trades at a stretched P/E of 36.6 and a high P/B of 11.68, suggesting expensive valuation. It rewards shareholders with a 2.18% dividend yield, reflecting balanced capital allocation between returns and growth.
Pool Corporation
Pool shows a slightly lower net margin at 8.18% but a comparable ROE of 34.1%, indicating efficient equity use. Its P/E of 29.8 and P/B of 10.18 also point to a premium, though less stretched than Fastenal. Pool maintains a modest 1.39% dividend yield and reinvests heavily, evident from its capital structure and operational focus.
Premium Valuation vs. Operational Safety
Fastenal’s superior profitability and yield come at a higher valuation premium, while Pool offers a more moderate price with solid returns and reinvestment. Fastenal suits income-focused investors, whereas Pool appeals to those seeking growth with reasonable risk exposure.
Which one offers the Superior Shareholder Reward?
I find Fastenal delivers a stronger shareholder reward than Pool Corporation in 2026. Fastenal yields ~2.18% with a high payout ratio near 80%, signaling confidence but tight free cash flow coverage. Its steady buybacks complement dividends, enhancing total return. Pool’s 1.39% yield and 41% payout ratio show a conservative distribution, favoring reinvestment. However, Pool’s heavier debt load (debt-to-equity ~1.0 vs. Fastenal’s 0.11) raises sustainability concerns. Fastenal’s disciplined capital allocation and robust cash flow coverage underpin a more sustainable, attractive total return in this cycle.
Comparative Score Analysis: The Strategic Profile
The radar chart reveals the fundamental DNA and trade-offs of Fastenal Company and Pool Corporation, highlighting their financial strengths and valuation challenges:
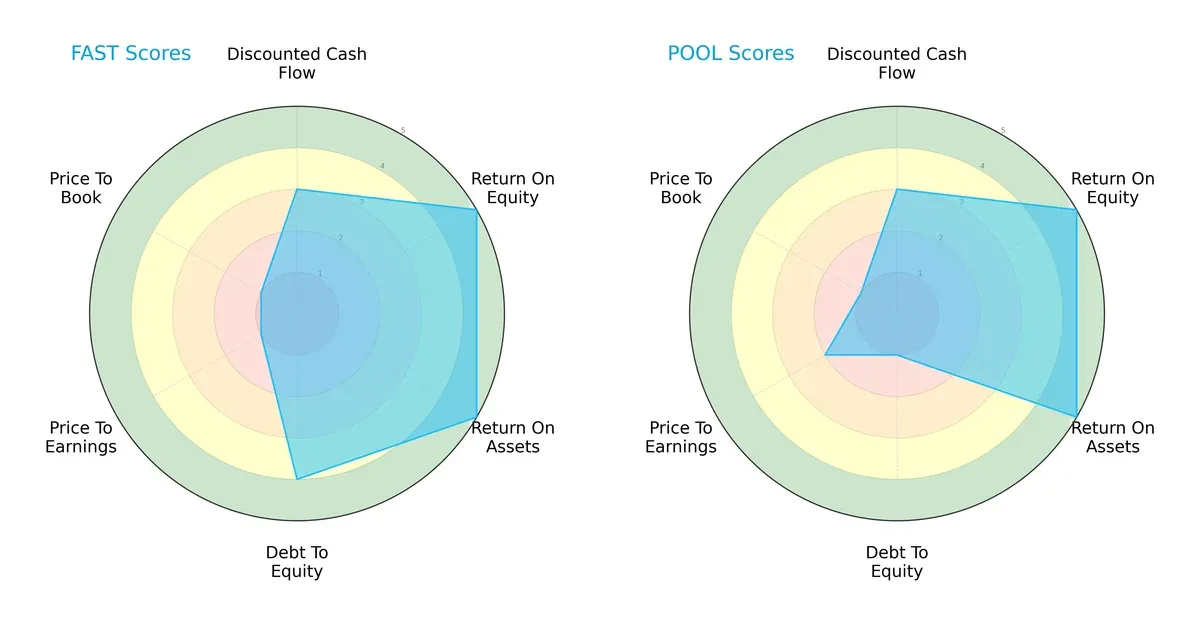
Fastenal Company shows a more balanced profile with strong returns (ROE and ROA at 5) and solid leverage control (Debt/Equity score of 4). Pool Corporation matches Fastenal’s operational efficiency but carries much higher financial risk with a Debt/Equity score of 1. Valuation metrics (P/E and P/B) are weak for both, though Pool slightly edges out Fastenal on P/E. Fastenal relies on a more prudent capital structure, while Pool leverages operational strength but accepts higher debt risk.
Bankruptcy Risk: Solvency Showdown
Fastenal’s Altman Z-Score of 33.6 far exceeds Pool’s 5.4, signaling a vastly stronger buffer against bankruptcy risk in this cycle:
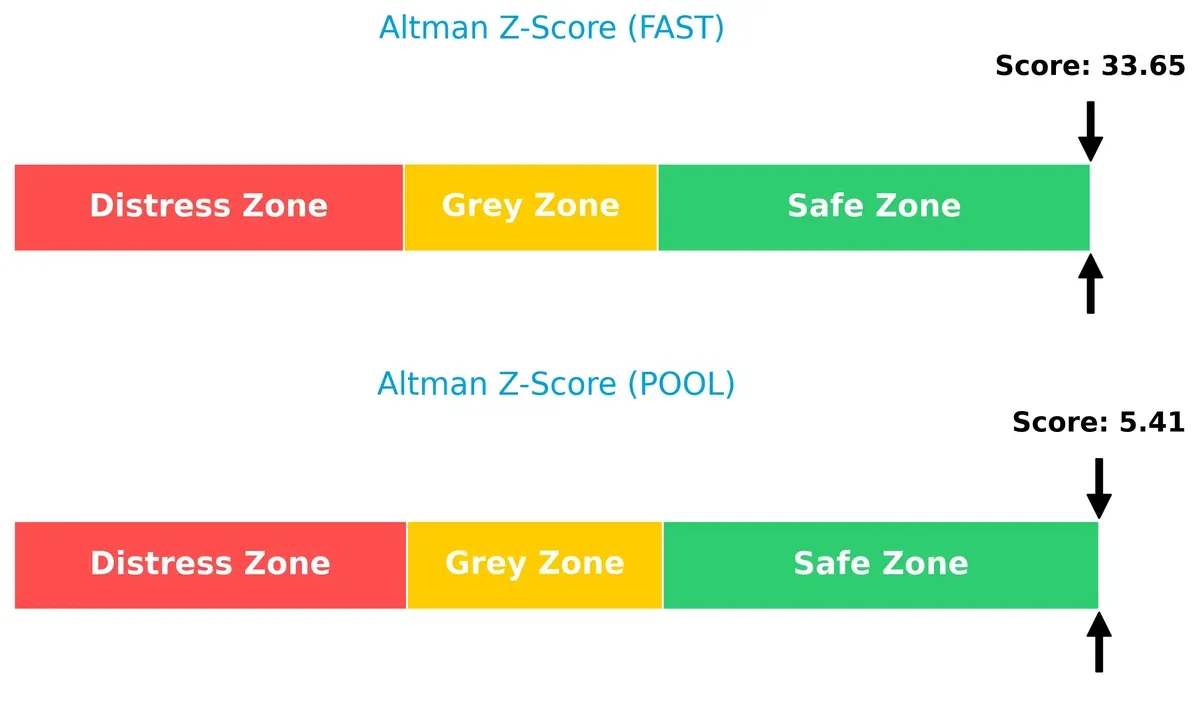
Fastenal’s score confirms a dominant safe zone status, reflecting robust financial stability and low default probability. Pool remains in the safe zone too but with a much thinner margin, indicating higher sensitivity to adverse market shifts.
Financial Health: Quality of Operations
Pool edges out Fastenal with a Piotroski F-Score of 7 versus 6, suggesting marginally stronger internal financial health and operational quality:
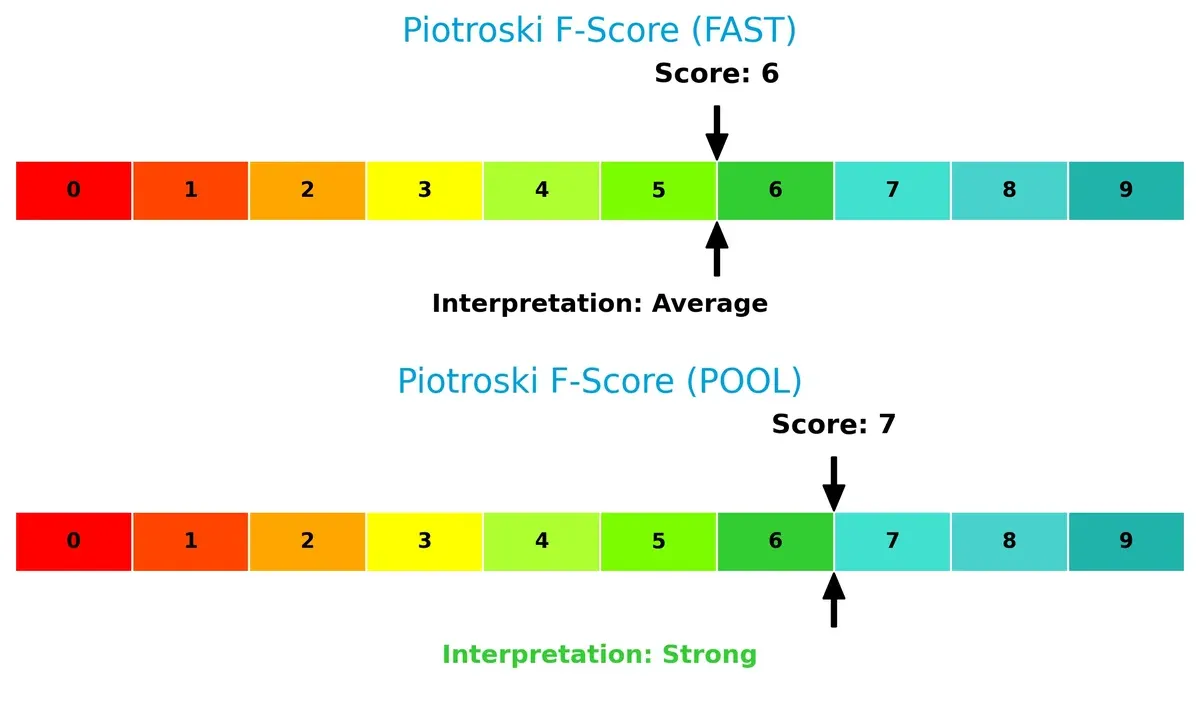
Both companies exhibit healthy fundamentals, but Pool’s higher score hints at fewer red flags and better profitability, leverage, and liquidity metrics. Fastenal’s slightly lower score calls for cautious monitoring of internal efficiencies amid its conservative leverage stance.
How are the two companies positioned?
This section dissects the operational DNA of Fastenal and Pool by comparing their revenue distribution by segment alongside their internal strengths and weaknesses. The ultimate goal is to confront their economic moats to reveal which business model builds the most durable and sustainable competitive advantage today.
Revenue Segmentation: The Strategic Mix
This comparison dissects how Fastenal Company and Pool Corporation diversify their income streams and where their primary sector bets lie:
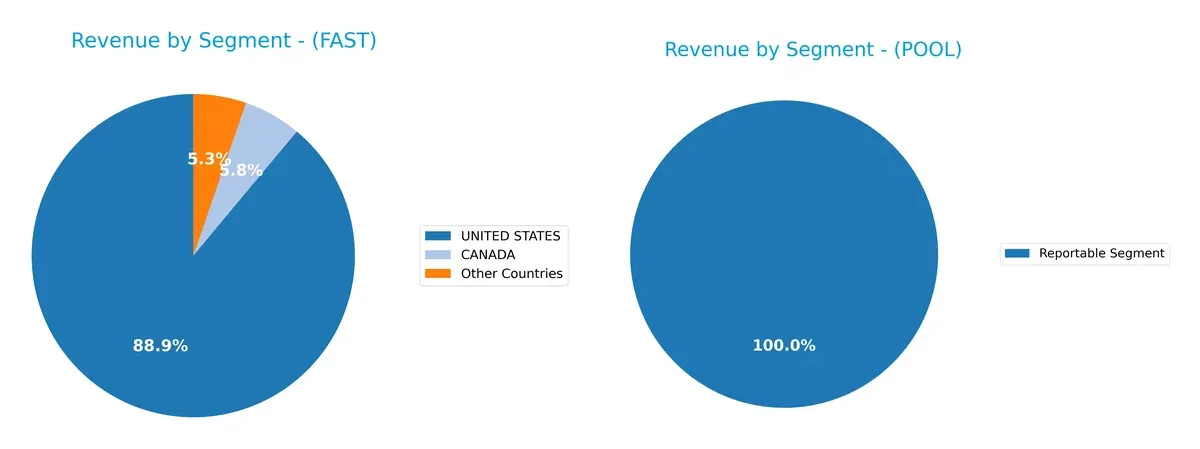
Fastenal Company diversifies its revenue across the United States ($3.44B), Canada ($223M), and other countries ($205M) in 2015, showing geographic spread. Pool Corporation relies entirely on a single reportable segment totaling $5.31B in 2024, indicating concentration risk. Fastenal’s diversified footprint reduces dependency on one market, while Pool’s dominance suggests focus on infrastructure or niche specialization, increasing vulnerability to sector shifts.
Strengths and Weaknesses Comparison
This table compares the Strengths and Weaknesses of Fastenal Company and Pool Corporation:
Fastenal Company Strengths
- High net margin at 15.35% supports superior profitability
- ROE of 31.91% indicates efficient equity use
- Strong ROIC of 27.52% well above WACC of 7.9%
- Very low debt-to-assets ratio at 8.75% limits financial risk
- Robust current quick ratio of 2.41 signals solid liquidity
- Diversified geographic revenue with $6.8B in US and $1.28B in other regions
Pool Corporation Strengths
- Strong ROE at 34.11%, showing effective shareholder returns
- ROIC of 17.69% exceeds WACC of 8.84%, indicating value creation
- Favorable current ratio at 2.05 reflects good short-term liquidity
- High fixed asset turnover at 9.38 suggests efficient asset use
- Concentrated US market revenue of $4.94B with some international sales
Fastenal Company Weaknesses
- High P/E of 36.6 and P/B of 11.68 suggest valuation premium risk
- Unfavorable current ratio at 4.85 may indicate excess short-term assets
- Limited global presence with majority revenue from US and Canada
- Dividend yield moderate at 2.18%, less attractive for income focus
Pool Corporation Weaknesses
- Low net margin at 8.18% signals weaker profitability
- Quick ratio of 0.52 flags potential liquidity constraints
- Debt-to-assets at 37.76% increases financial leverage risk
- Dividend yield moderate at 1.39%, less compelling for yield investors
Fastenal exhibits strong profitability and conservative financial structure but faces valuation and liquidity trade-offs. Pool Corporation shows efficient returns but weaker profitability and higher leverage, highlighting strategic differences in capital allocation and risk tolerance.
The Moat Duel: Analyzing Competitive Defensibility
A structural moat is the only reliable barrier that protects long-term profits from relentless competition erosion. Let’s dissect the competitive moats of two industrial distributors:
Fastenal Company: Distribution Network and Operational Efficiency Moat
Fastenal leverages an extensive in-market location network and superior operational efficiency. It sustains high ROIC at 19.6%, well above WACC, showing value creation with margin stability. New product lines and international expansion in 2026 could deepen this moat.
Pool Corporation: Niche Market Expertise and Product Range Moat
Pool Corporation’s moat rests on its specialized pool and leisure product distribution. While generating positive ROIC at 8.8%, it trails Fastenal and suffers from a declining ROIC trend. Market saturation and revenue contraction in 2025 pose challenges, yet expansion into commercial outdoor living offers growth potential.
Network Scale vs. Specialized Product Focus: The Moat Showdown
Fastenal’s wider moat derives from scalable distribution and robust profitability growth. Pool’s narrower moat shows vulnerability with declining returns. Fastenal is better equipped to defend and grow its market share sustainably in 2026.
Which stock offers better returns?
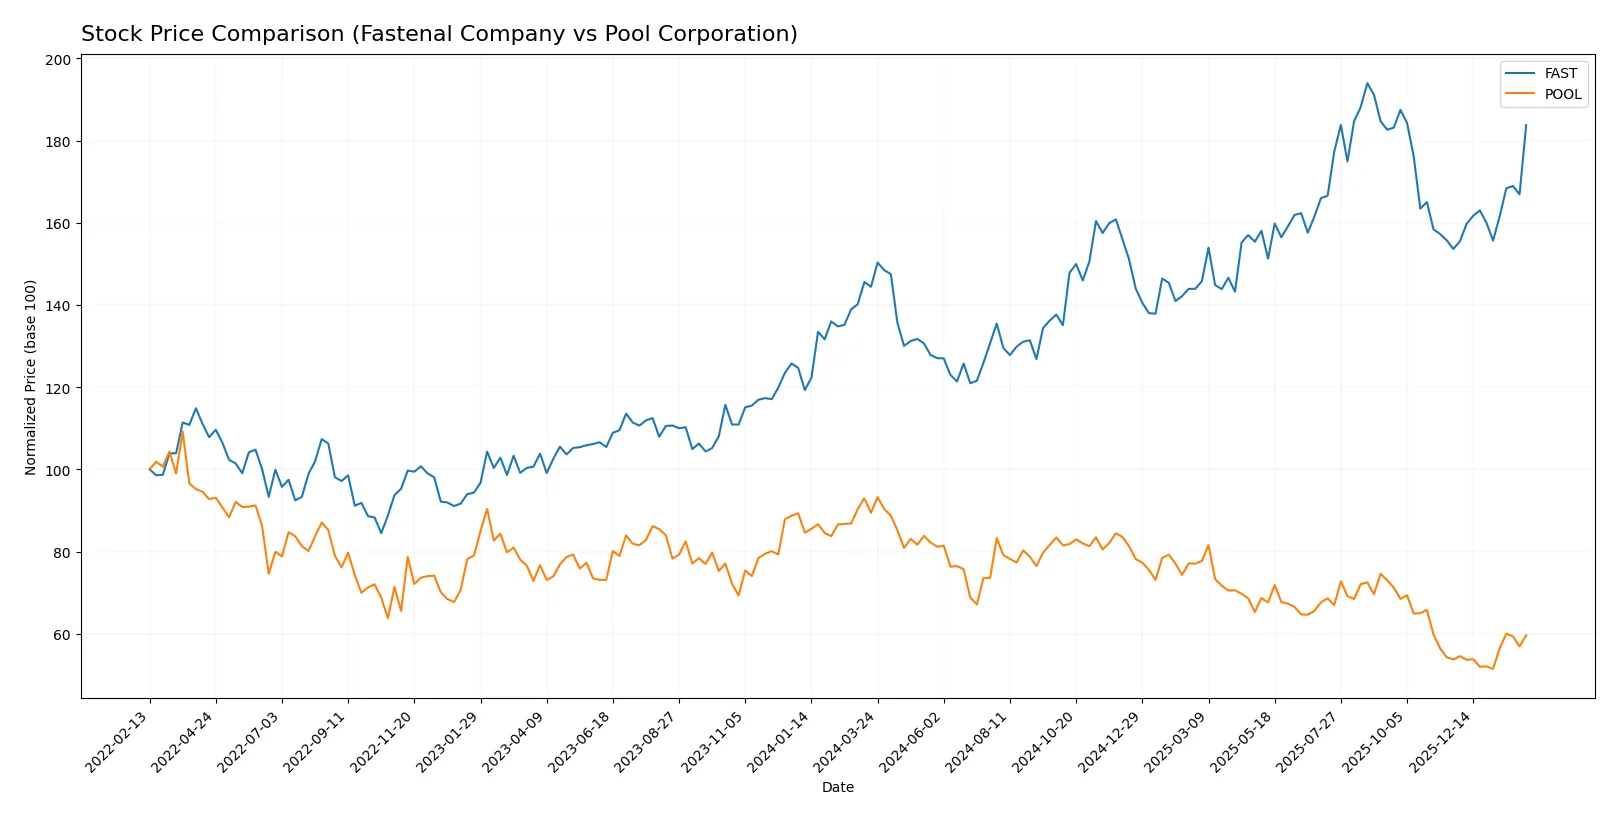
Both Fastenal Company and Pool Corporation exhibit contrasting price movements over the past year, with Fastenal showing steady gains and Pool facing significant declines before partial recovery.
Trend Comparison
Fastenal Company’s stock price rose 27.21% over the past year, indicating a bullish trend with accelerating momentum. The price ranged between 31.42 and 50.39, supported by moderate volatility (4.7% std deviation).
Pool Corporation’s stock declined 33.35% over the same period, marking a bearish trend despite recent acceleration. Its price fluctuated widely between 229.71 and 416.38, with high volatility at 42.91% standard deviation.
Fastenal outperformed Pool significantly over the past year, delivering strong positive returns versus Pool’s steep overall losses despite recent partial recovery.
Target Prices
Analysts present a clear target price consensus for Fastenal Company and Pool Corporation.
| Company | Target Low | Target High | Consensus |
|---|---|---|---|
| Fastenal Company | 43 | 52 | 48 |
| Pool Corporation | 250 | 320 | 296 |
Fastenal’s target consensus of 48 slightly exceeds its current price of 47.73, signaling moderate upside potential. Pool Corporation’s consensus target of 296 also surpasses its current 266.16 price, indicating bullish analyst expectations.

Don’t Let Luck Decide Your Entry Point
Optimize your entry points with our advanced ProRealTime indicators. You’ll get efficient buy signals with precise price targets for maximum performance. Start outperforming now!
How do institutions grade them?
Fastenal Company Grades
The table below shows recent grades from recognized institutions for Fastenal Company.
| Grading Company | Action | New Grade | Date |
|---|---|---|---|
| Barclays | Maintain | Equal Weight | 2026-01-21 |
| Jefferies | Upgrade | Buy | 2025-12-15 |
| Wolfe Research | Downgrade | Underperform | 2025-11-13 |
| Barclays | Maintain | Equal Weight | 2025-11-13 |
| Barclays | Maintain | Equal Weight | 2025-10-14 |
| JP Morgan | Maintain | Neutral | 2025-09-04 |
| Baird | Upgrade | Outperform | 2025-08-07 |
| Baird | Maintain | Neutral | 2025-07-15 |
| Stephens & Co. | Maintain | Equal Weight | 2025-07-15 |
| JP Morgan | Maintain | Neutral | 2025-07-15 |
Pool Corporation Grades
Recent institutional grades for Pool Corporation are summarized in the table below.
| Grading Company | Action | New Grade | Date |
|---|---|---|---|
| Goldman Sachs | Maintain | Buy | 2026-01-13 |
| Baird | Upgrade | Outperform | 2026-01-12 |
| CFRA | Upgrade | Buy | 2025-12-23 |
| Stifel | Maintain | Hold | 2025-12-16 |
| Wells Fargo | Maintain | Equal Weight | 2025-12-15 |
| William Blair | Downgrade | Market Perform | 2025-10-15 |
| Oppenheimer | Maintain | Outperform | 2025-07-29 |
| Baird | Maintain | Neutral | 2025-07-25 |
| Wells Fargo | Maintain | Equal Weight | 2025-07-08 |
| Stephens & Co. | Maintain | Overweight | 2025-04-28 |
Which company has the best grades?
Pool Corporation shows a stronger grade trend with multiple upgrades to Buy and Outperform ratings. Fastenal Company’s grades mostly cluster around Neutral and Equal Weight, indicating less enthusiasm. Investors may view Pool’s better grades as a signal of higher institutional confidence.
Risks specific to each company
The following categories identify critical pressure points and systemic threats facing both firms in the 2026 market environment:
1. Market & Competition
Fastenal Company
- Strong foothold in industrial distribution, but faces pricing pressure due to high valuation multiples (PE 36.6).
Pool Corporation
- Pool operates in a niche leisure products market with growth potential but contends with more volatile demand cycles.
2. Capital Structure & Debt
Fastenal Company
- Maintains a very conservative debt profile (D/E 0.11), minimizing financial risk.
Pool Corporation
- Leverages heavily with D/E of 1.0, increasing financial vulnerability despite manageable interest coverage.
3. Stock Volatility
Fastenal Company
- Exhibits lower beta (0.885), indicating less stock price volatility relative to the market.
Pool Corporation
- Higher beta (1.23) signals greater stock price swings and risk for investors.
4. Regulatory & Legal
Fastenal Company
- Industrial distribution faces standard compliance risks but no major litigation threats reported.
Pool Corporation
- Leisure and construction segments exposed to product safety and environmental regulations, increasing legal risk.
5. Supply Chain & Operations
Fastenal Company
- Extensive network of 3,200+ locations supports supply chain resilience but complexity may raise costs.
Pool Corporation
- Smaller global footprint (410 sales centers) heightens exposure to regional supply disruptions.
6. ESG & Climate Transition
Fastenal Company
- Industrial sector pressure to improve sustainability metrics; climate transition could raise operational costs.
Pool Corporation
- Faces increasing scrutiny on product environmental impact and resource usage amid rising ESG expectations.
7. Geopolitical Exposure
Fastenal Company
- Operates primarily in North America with moderate international exposure, limiting geopolitical risk.
Pool Corporation
- More internationally diversified, increasing exposure to geopolitical instability and trade disruptions.
Which company shows a better risk-adjusted profile?
Fastenal’s strongest risk is its stretched valuation amid market competition, risking downside if growth slows. Pool’s most impactful risk lies in its high leverage, elevating financial risk during economic stress. I see Fastenal’s conservative capital structure and lower volatility offering a superior risk-adjusted profile. Recent financial ratios confirm Fastenal’s robust balance sheet and operational resilience, justifying cautious optimism despite valuation concerns.
Final Verdict: Which stock to choose?
Fastenal Company’s superpower lies in its unmatched efficiency and strong capital discipline. It consistently generates high returns well above its cost of capital, signaling a durable competitive advantage. A key point of vigilance is its elevated current ratio, which might hint at excess working capital. Fastenal suits aggressive growth portfolios focused on operational excellence.
Pool Corporation offers a strategic moat through its recurring revenue streams and strong asset turnover, underpinning steady profitability. Compared to Fastenal, it presents a more moderate safety profile due to higher leverage and a declining return on invested capital trend. Pool fits well within GARP portfolios seeking growth tempered by reasonable valuation.
If you prioritize operational efficiency and strong value creation, Fastenal outshines as the compelling choice due to its sustainable moat and robust returns. However, if you seek growth with recurring revenue stability and can tolerate moderate financial risk, Pool offers better stability in that niche despite recent margin pressures. Both stocks merit consideration within distinct investor strategies.
Disclaimer: Investment carries a risk of loss of initial capital. The past performance is not a reliable indicator of future results. Be sure to understand risks before making an investment decision.
Go Further
I encourage you to read the complete analyses of Fastenal Company and Pool Corporation to enhance your investment decisions: