Home > Comparison > Technology > WDAY vs FICO
The strategic rivalry between Workday, Inc. and Fair Isaac Corporation shapes the Technology sector’s software application landscape. Workday operates as a broad enterprise cloud applications provider, emphasizing human capital and financial management. Fair Isaac focuses on analytic software and decision management, specializing in risk and scoring solutions. This analysis will assess which company’s operational model and growth trajectory present a superior risk-adjusted return for a diversified portfolio in today’s evolving tech environment.
Table of contents
Companies Overview
Workday and Fair Isaac Corporation stand as pivotal players in enterprise software, shaping critical decision-making and management processes globally.
Workday, Inc.: Enterprise Cloud Applications Leader
Workday dominates the enterprise cloud applications market, generating revenue through its integrated financial and human capital management suites. Its 2026 focus sharpens on real-time financial insights, augmented analytics, and machine learning to enhance automation and operational efficiency. Workday’s cloud spend management also streamlines supplier and contract management, reinforcing its competitive edge in diverse industries.
Fair Isaac Corporation: Analytics and Decision Solutions Pioneer
Fair Isaac leads the analytic and decision management software space by delivering scoring solutions and modular platforms that automate complex business decisions. Its 2026 strategy centers on expanding its FICO Platform to support advanced analytics and decision use cases across marketing, fraud detection, and compliance. It combines direct and indirect sales channels to reach a global customer base.
Strategic Collision: Similarities & Divergences
Both firms emphasize software-driven business optimization but diverge in approach: Workday invests heavily in a cloud-based ecosystem for enterprise operations, while Fair Isaac offers configurable decision management tools emphasizing analytics. Their primary battleground lies in automating business processes through data intelligence. Investors should note Workday’s broader industry reach contrasts with Fair Isaac’s specialized analytic niche, reflecting distinct risk and growth profiles.
Income Statement Comparison
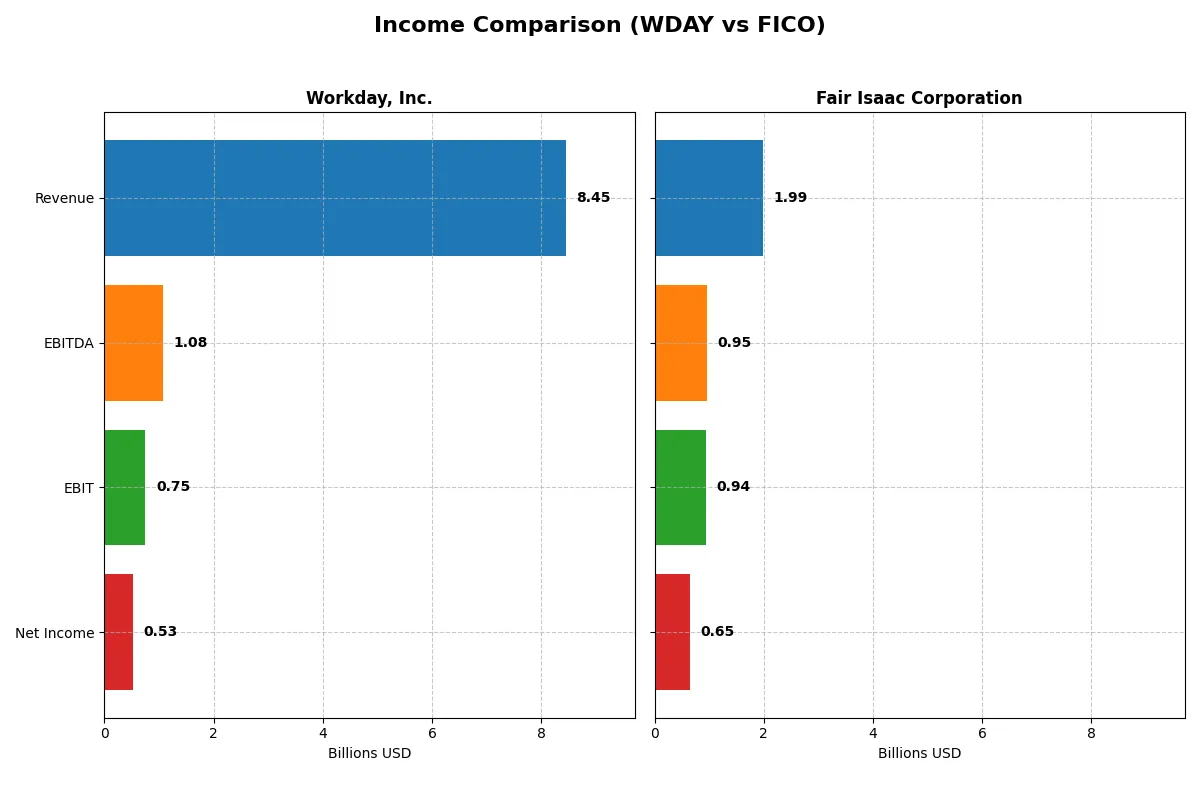
This data dissects the core profitability and scalability of both corporate engines to reveal who dominates the bottom line:
| Metric | Workday, Inc. (WDAY) | Fair Isaac Corporation (FICO) |
|---|---|---|
| Revenue | 8.45B | 1.99B |
| Cost of Revenue | 2.07B | 354M |
| Operating Expenses | 5.96B | 712M |
| Gross Profit | 6.38B | 1.64B |
| EBITDA | 1.08B | 951M |
| EBIT | 752M | 936M |
| Interest Expense | 114M | 134M |
| Net Income | 526M | 652M |
| EPS | 1.98 | 26.90 |
| Fiscal Year | 2025 | 2025 |
Income Statement Analysis: The Bottom-Line Duel
This income statement comparison reveals the operational efficiency and profitability momentum of two leading tech companies over recent years.
Workday, Inc. Analysis
Workday’s revenue nearly doubles from 4.3B in 2021 to 8.4B in 2025, showing robust growth. Gross margins stay healthy around 75.5%, but net margin falls sharply in 2025 to 6.23%, reflecting margin pressure despite a 60% jump in EBIT. The company’s net income swings from losses in early years to 526M in 2025, signaling improving but volatile profitability.
Fair Isaac Corporation Analysis
Fair Isaac grows revenue steadily from 1.3B in 2021 to 2.0B in 2025, with consistent top-line expansion at 15.9% annually. Gross margin remains strong at 82.2%, while EBIT margin impressively holds above 47%. Net margin expands to 32.75%, with net income rising to 652M in 2025. This reflects a highly efficient cost structure and stable profitability growth.
Efficiency and Margin Strength: Growth Volatility vs. Consistent Profitability
Fair Isaac clearly outperforms Workday in margin quality and net income stability. Workday’s rapid revenue scale contrasts with its volatile profitability and declining net margin last year. Investors prioritizing steady earnings and margin resilience should find Fair Isaac’s profile more attractive, while those favoring high growth with risk tolerance may lean toward Workday’s trajectory.
Financial Ratios Comparison
These vital ratios act as a diagnostic tool to expose underlying fiscal health, valuation premiums, and capital efficiency of the companies compared:
| Ratios | Workday, Inc. (WDAY) | Fair Isaac Corporation (FICO) |
|---|---|---|
| ROE | 5.8% | -37.3% |
| ROIC | 2.7% | 53.0% |
| P/E | 132.2 | 55.6 |
| P/B | 7.7 | -20.8 |
| Current Ratio | 1.85 | 0.83 |
| Quick Ratio | 1.85 | 0.83 |
| D/E | 0.37 | -1.76 |
| Debt-to-Assets | 18.7% | 165.0% |
| Interest Coverage | 3.64 | 6.92 |
| Asset Turnover | 0.47 | 1.07 |
| Fixed Asset Turnover | 5.36 | 21.20 |
| Payout Ratio | 0 | 0 |
| Dividend Yield | 0 | 0 |
| Fiscal Year | 2025 | 2025 |
Efficiency & Valuation Duel: The Vital Signs
Financial ratios serve as a company’s DNA, revealing both hidden risks and operational strengths that shape investor decisions.
Workday, Inc.
Workday shows modest profitability with a 5.82% ROE and a net margin near 6.23%, signaling moderate efficiency. The stock trades at a stretched P/E of 132.15 and high P/B of 7.69, indicating expensive valuation. Workday does not pay dividends, instead reinvesting heavily in R&D, supporting future growth potential.
Fair Isaac Corporation
Fair Isaac posts a strong 32.75% net margin and an impressive 52.96% ROIC, highlighting operational excellence. Despite this, its P/E of 55.64 remains expensive, though less so than Workday. The company lacks dividends but appears focused on capital efficiency and maintaining a healthy interest coverage of 7.01.
Premium Valuation vs. Operational Safety
Fair Isaac offers superior profitability and capital returns, balancing its pricey valuation with strong fundamentals. Workday’s valuation is more stretched, with weaker returns but solid reinvestment. Investors favoring growth at high cost may lean toward Workday; those prioritizing operational safety and returns might prefer Fair Isaac.
Which one offers the Superior Shareholder Reward?
Workday, Inc. (WDAY) and Fair Isaac Corporation (FICO) both forgo dividends, focusing on reinvestment and buybacks. WDAY shows no dividend yield or payout but generates solid free cash flow at 8.25/share and maintains a strong buyback culture supporting shareholder value. FICO also pays no dividends but exhibits robust free cash flow of 31.76/share with high operating margins near 47%, fueling aggressive share repurchases. Despite FICO’s superior free cash flow and margins, its negative equity and leveraged balance sheet raise sustainability concerns. I find WDAY’s balanced reinvestment and moderate leverage offer a more reliable total return profile for 2026 investors.
Comparative Score Analysis: The Strategic Profile
The radar chart reveals the fundamental DNA and trade-offs of Workday, Inc. and Fair Isaac Corporation, highlighting their financial strengths and weaknesses:
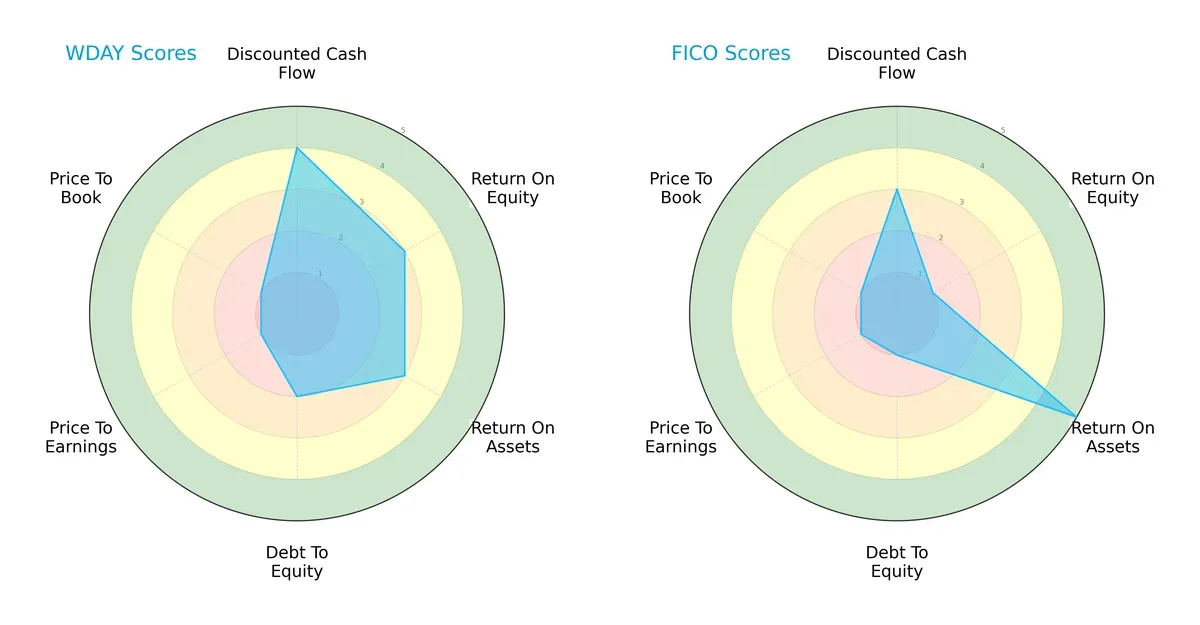
Workday shows strength in discounted cash flow (4) and moderate returns on equity (3) and assets (3). Fair Isaac excels in return on assets (5) but lags in return on equity (1) and carries higher financial risk with a weaker debt-to-equity score (1). Workday offers a more balanced profile, while Fair Isaac relies heavily on asset efficiency.
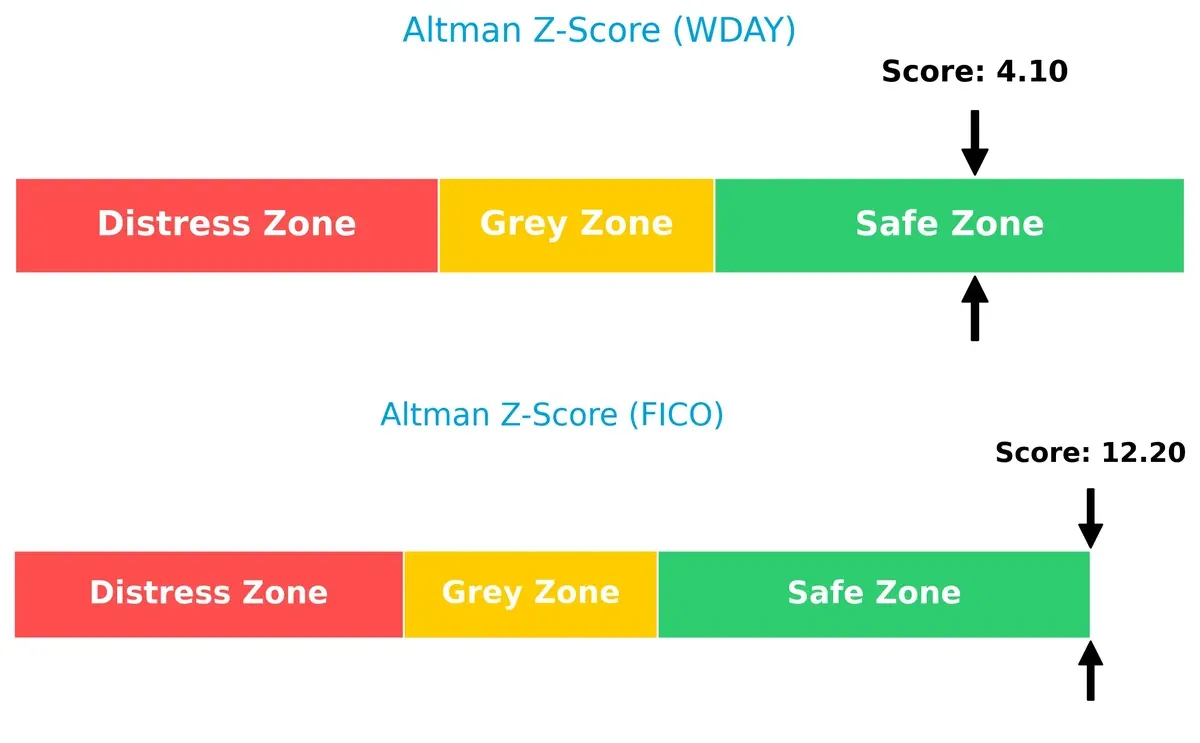
Bankruptcy Risk: Solvency Showdown
Fair Isaac’s Altman Z-Score (12.2) far exceeds Workday’s (4.1), placing both in the safe zone but signaling Fair Isaac’s superior long-term solvency and resilience in this cycle:
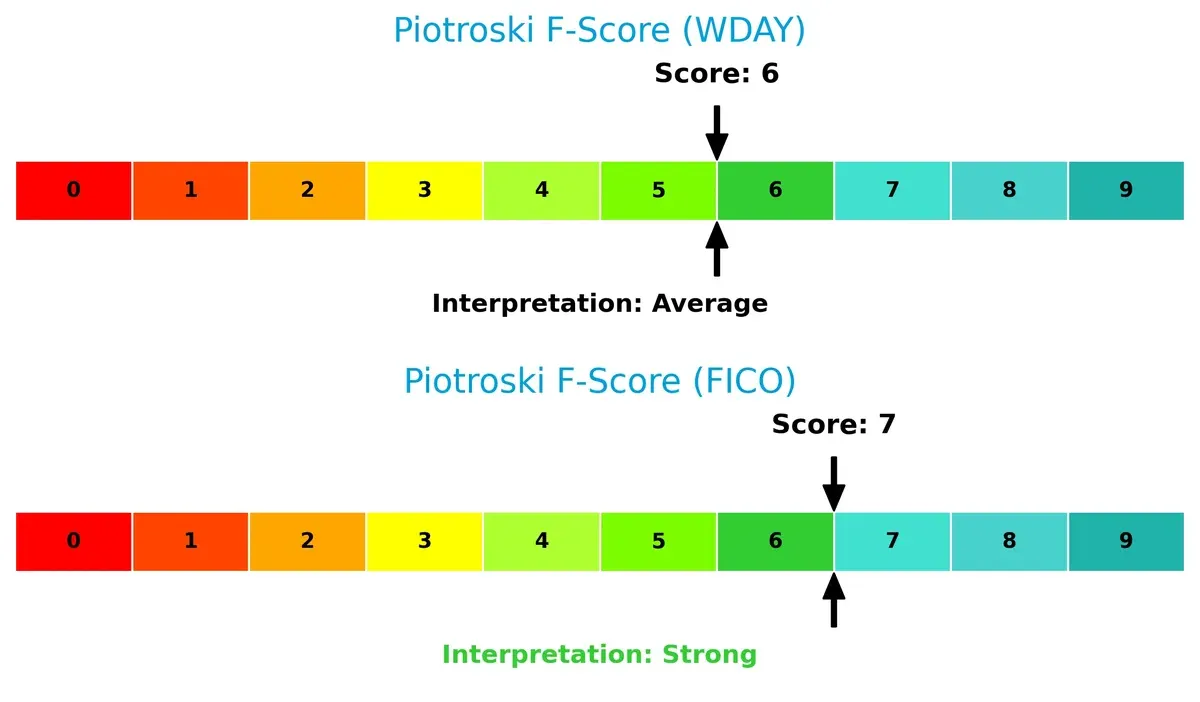
Financial Health: Quality of Operations
Fair Isaac’s Piotroski F-Score of 7 indicates strong financial health, outperforming Workday’s average score of 6. Workday shows no immediate red flags but lags slightly in operational quality:
How are the two companies positioned?
This section dissects the operational DNA of Workday and Fair Isaac by comparing their revenue distribution and internal strengths and weaknesses. The ultimate goal is to confront their economic moats and identify which business model offers the most resilient, sustainable advantage in today’s market.
Revenue Segmentation: The Strategic Mix
This visual comparison dissects how Workday, Inc. and Fair Isaac Corporation diversify their income streams and where their primary sector bets lie:
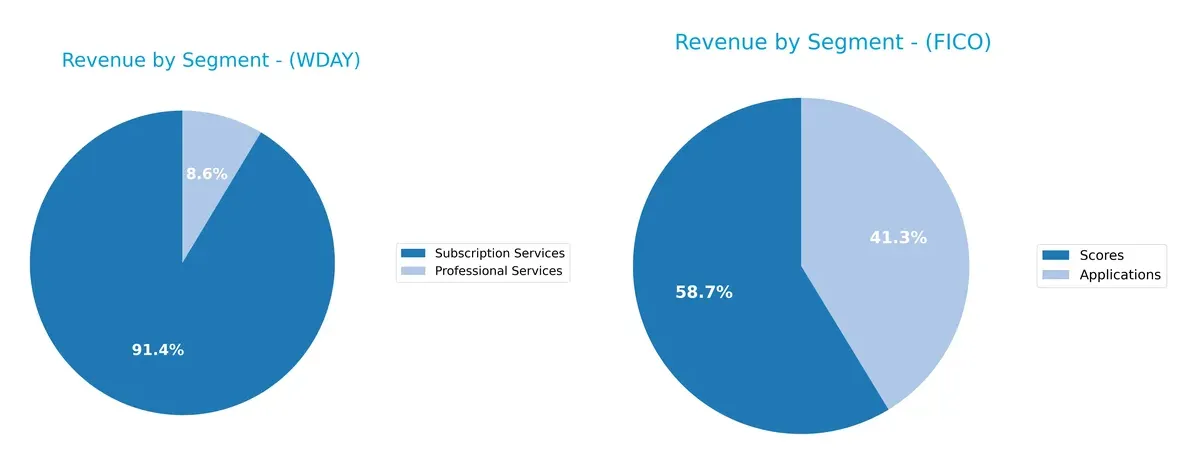
Workday anchors its revenue in Subscription Services with $7.7B in 2025, dwarfing $728M from Professional Services. This signals a recurring revenue moat and ecosystem lock-in. Fair Isaac splits more evenly between Scores at $1.17B and Applications at $822M, reflecting a balanced mix with less concentration risk. Workday’s heavy subscription focus suggests a scalable cloud infrastructure dominance, while Fair Isaac’s dual streams support steady growth and client diversification.
Strengths and Weaknesses Comparison
This table compares the Strengths and Weaknesses of Workday, Inc. and Fair Isaac Corporation:
WDAY Strengths
- Strong subscription services revenue of 7.7B USD in 2025
- Favorable liquidity ratios with current and quick ratios at 1.85
- Low debt-to-assets ratio at 18.7%
- Solid interest coverage of 6.6
- Increasing non-US revenue reaching 2.1B USD in 2025
FICO Strengths
- High net margin at 32.75%
- Exceptional ROIC of 52.96%
- Strong asset turnover at 1.07 and fixed asset turnover of 21.2
- Favorable price-to-book ratio
- Interest coverage slightly higher at 7.01
- Diversified global presence with Americas, Asia Pacific, and EMEA revenues
WDAY Weaknesses
- ROE and ROIC below WACC indicating weak capital efficiency
- High PE and PB ratios suggest overvaluation risk
- Asset turnover relatively low at 0.47
- No dividend yield
- Subscription services dominate revenue, limited diversification
- US market concentration with 6.3B USD
FICO Weaknesses
- Negative ROE at -37.34% signals profitability concerns
- Current ratio below 1 at 0.83 poses liquidity risk
- Extremely high debt-to-assets ratio at 164.6%
- No dividend yield
- PE ratio still high at 55.64
- Heavy reliance on Americas for revenue with limited diversification
Both companies show strong areas: WDAY excels in liquidity and steady subscription revenue growth, while FICO delivers superior profitability and asset efficiency. However, WDAY’s capital returns lag its cost of capital, and FICO faces liquidity and leverage challenges. These factors shape each firm’s strategic priorities around efficiency and risk management.
The Moat Duel: Analyzing Competitive Defensibility
A structural moat alone preserves long-term profits against relentless competitive erosion. Let’s dissect how these giants defend their turf:
Workday, Inc.: Switching Costs Powerhouse
Workday’s moat stems from high switching costs embedded in its integrated enterprise cloud solutions. This manifests in steady revenue growth and margin stability. Expanding international sales in 2026 could deepen its customer lock-in but ROIC below WACC signals value destruction risks.
Fair Isaac Corporation: Analytic Intangibles Fortress
FICO’s moat is anchored in proprietary analytics and data assets, delivering superior EBIT margins around 47%. Its durable and growing ROIC confirms efficient capital use. In 2026, expanding decision management software globally may further fortify its competitive edge.
Verdict: Switching Costs vs. Analytic Intangibles
FICO boasts a deeper, more durable moat with ROIC well above WACC and strong margin expansion. Workday’s switching costs create entry barriers but its negative ROIC warns of vulnerability. FICO is better positioned to defend market share long term.
Which stock offers better returns?
The past year reveals contrasting stock price dynamics: Workday, Inc. faces a sustained decline, while Fair Isaac Corporation shows overall gains despite recent pullbacks.
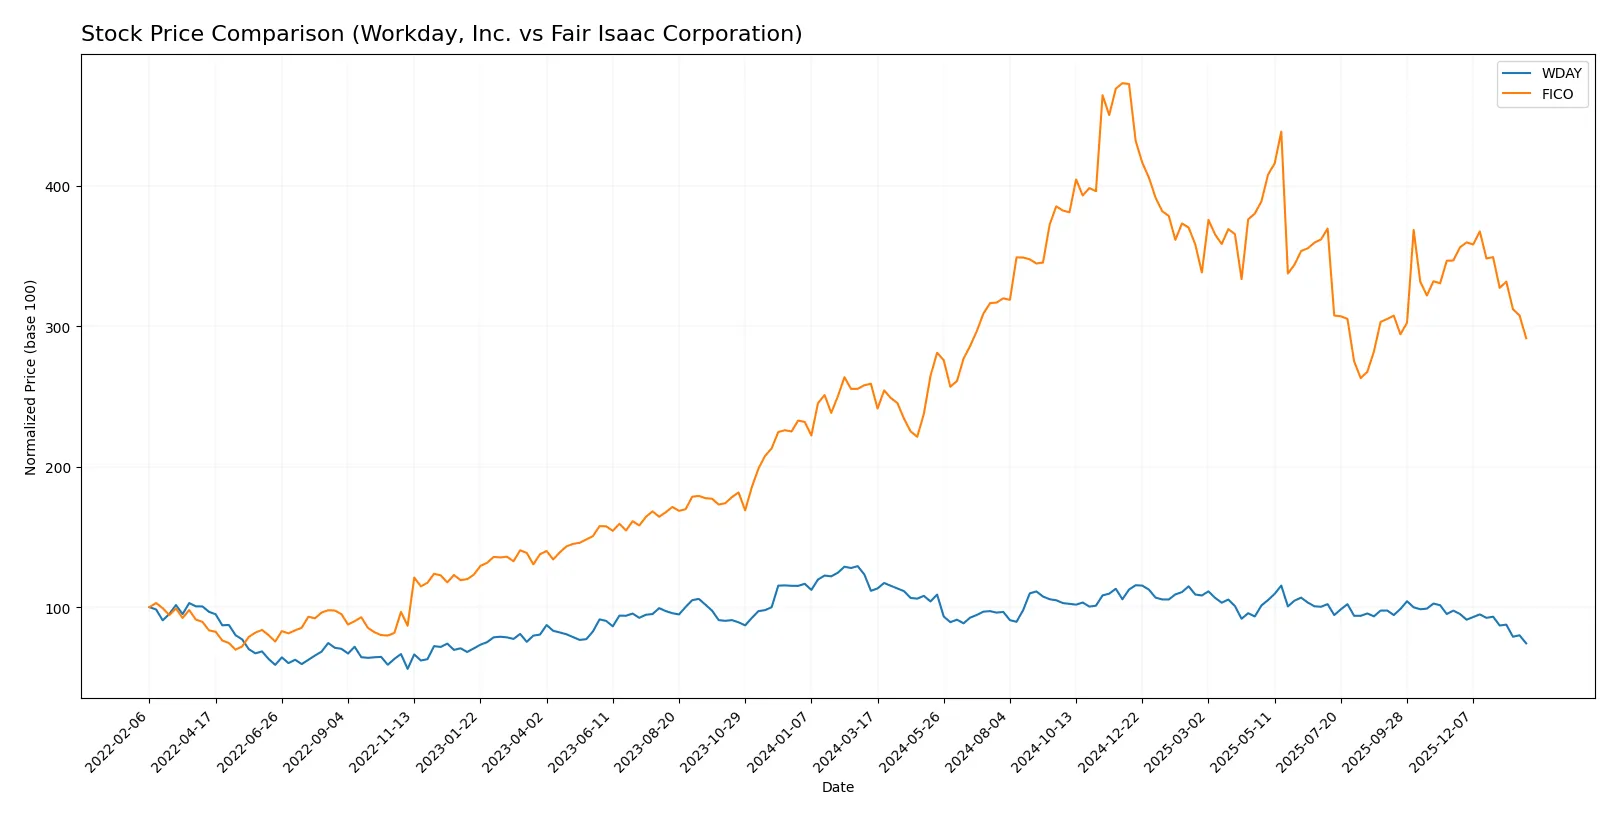
Trend Comparison
Workday, Inc. shows a bearish trend over 12 months with a -33.55% price change and deceleration. The stock hit a high of 277.5 and a low of 175.63, with moderate volatility (std dev 20.24).
Fair Isaac Corporation posts a bullish 12-month trend with a 12.51% gain but deceleration. The stock ranged between 1110.85 and 2375.03, exhibiting high volatility (std dev 285.65).
Comparing both, Fair Isaac outperformed Workday with positive returns over the year, despite recent declines in both stocks’ prices.
Target Prices
Analysts show a positive outlook with target consensus prices well above current market levels.
| Company | Target Low | Target High | Consensus |
|---|---|---|---|
| Workday, Inc. | 235 | 320 | 274.47 |
| Fair Isaac Corporation | 1640 | 2400 | 2115 |
Workday’s target consensus at $274.47 far exceeds its current $175.63 price, suggesting significant upside potential. Fair Isaac’s consensus target of $2115 also implies a strong valuation premium over its $1463.17 market price.

Don’t Let Luck Decide Your Entry Point
Optimize your entry points with our advanced ProRealTime indicators. You’ll get efficient buy signals with precise price targets for maximum performance. Start outperforming now!
How do institutions grade them?
This section compares the recent grades assigned to Workday, Inc. and Fair Isaac Corporation by leading financial institutions:
Workday, Inc. Grades
The following table summarizes Workday’s recent grades from established grading companies:
| Grading Company | Action | New Grade | Date |
|---|---|---|---|
| Barclays | Maintain | Overweight | 2026-01-12 |
| RBC Capital | Maintain | Outperform | 2026-01-05 |
| RBC Capital | Maintain | Outperform | 2025-11-26 |
| DA Davidson | Maintain | Neutral | 2025-11-26 |
| Barclays | Maintain | Overweight | 2025-11-26 |
| Keybanc | Maintain | Overweight | 2025-11-26 |
| JP Morgan | Maintain | Overweight | 2025-11-26 |
| UBS | Maintain | Neutral | 2025-11-26 |
| TD Cowen | Maintain | Buy | 2025-11-26 |
| Citigroup | Maintain | Neutral | 2025-11-26 |
Fair Isaac Corporation Grades
The following table summarizes Fair Isaac’s recent grades from established grading companies:
| Grading Company | Action | New Grade | Date |
|---|---|---|---|
| Needham | Maintain | Buy | 2026-01-29 |
| Jefferies | Maintain | Buy | 2026-01-16 |
| Wells Fargo | Maintain | Overweight | 2026-01-14 |
| JP Morgan | Maintain | Neutral | 2025-11-06 |
| Baird | Maintain | Outperform | 2025-11-06 |
| Jefferies | Maintain | Buy | 2025-11-06 |
| BMO Capital | Maintain | Outperform | 2025-11-06 |
| Wells Fargo | Maintain | Overweight | 2025-10-14 |
| Barclays | Maintain | Overweight | 2025-10-02 |
| Needham | Maintain | Buy | 2025-10-02 |
Which company has the best grades?
Fair Isaac Corporation has received a higher proportion of Buy and Outperform ratings compared to Workday, which mostly holds Overweight and Neutral grades. This suggests stronger institutional confidence in Fair Isaac’s near-term prospects, potentially influencing investor sentiment and demand.
Risks specific to each company
The following categories identify the critical pressure points and systemic threats facing both firms in the 2026 market environment:
1. Market & Competition
Workday, Inc.
- Faces intense competition in enterprise cloud applications; high valuation pressures with a P/E of 132.15.
Fair Isaac Corporation
- Strong niche in analytic software but struggles with negative ROE and high debt leverage.
2. Capital Structure & Debt
Workday, Inc.
- Maintains moderate debt-to-equity (0.37) and healthy interest coverage (6.6), signaling prudent leverage use.
Fair Isaac Corporation
- Exhibits concerning debt-to-assets at 164.6%, signaling heavy financial risk despite decent interest coverage (7.01).
3. Stock Volatility
Workday, Inc.
- Beta at 1.142 reflects moderate volatility; share price range is wide but with stable average volume.
Fair Isaac Corporation
- Beta higher at 1.293, indicating greater price swings; recent 2.57% drop highlights vulnerability to market shifts.
4. Regulatory & Legal
Workday, Inc.
- Operates under stringent data privacy laws impacting SaaS providers, requiring ongoing compliance investment.
Fair Isaac Corporation
- Faces regulatory scrutiny in credit scoring and financial compliance sectors, heightening legal risk exposure.
5. Supply Chain & Operations
Workday, Inc.
- Relies on robust cloud infrastructure; operational risks tied to technology disruptions and service uptime.
Fair Isaac Corporation
- Software delivery depends on stable data partnerships; any disruptions could affect product deployment and reputation.
6. ESG & Climate Transition
Workday, Inc.
- Increasing focus on sustainable cloud services and social governance can drive competitive advantage.
Fair Isaac Corporation
- ESG integration slower; potential reputational risks from lagging behind peers in climate-related initiatives.
7. Geopolitical Exposure
Workday, Inc.
- Global presence exposes it to trade tensions and data localization laws, especially in Europe and Asia.
Fair Isaac Corporation
- Operations in diverse regions face geopolitical risks, particularly in regulatory environments and cross-border data flows.
Which company shows a better risk-adjusted profile?
Workday’s most impactful risk lies in its lofty valuation and competitive pressure in a crowded market. Fair Isaac’s critical risk centers on its excessive leverage, undermining financial stability despite strong operational metrics. I consider Workday to have a better risk-adjusted profile, supported by its favorable liquidity ratios and safer debt levels. Notably, Fair Isaac’s debt-to-assets ratio over 160% flags significant balance sheet stress, raising caution for investors prioritizing financial resilience.
Final Verdict: Which stock to choose?
Workday, Inc. wields its superpower in relentless innovation and robust cash flow generation, fueling growth despite margin pressures. Its key point of vigilance lies in its struggle to convert invested capital into returns above its cost, signaling caution. This stock fits best in portfolios aiming for aggressive growth with a tolerance for valuation risks.
Fair Isaac Corporation’s strategic moat centers on its exceptional return on invested capital and commanding market position in analytics software. It offers better financial stability than Workday, though at a premium valuation. FICO suits investors seeking growth at a reasonable price, valuing sustainable profitability and durable competitive advantage.
If you prioritize high-growth potential and can weather valuation volatility, Workday stands out due to its innovation-driven momentum. However, if you seek a balance of growth and financial resilience, Fair Isaac offers better stability and a proven moat, though it carries valuation premiums. Each presents a distinct analytical scenario depending on your risk appetite and investment horizon.
Disclaimer: Investment carries a risk of loss of initial capital. The past performance is not a reliable indicator of future results. Be sure to understand risks before making an investment decision.
Go Further
I encourage you to read the complete analyses of Workday, Inc. and Fair Isaac Corporation to enhance your investment decisions: