Home > Comparison > Technology > FICO vs U
The strategic rivalry between Fair Isaac Corporation and Unity Software Inc. shapes innovation within the Technology sector. Fair Isaac operates as a mature, analytics-driven software provider specializing in decision management, while Unity leads with a dynamic platform for real-time 3D content creation. This head-to-head contrasts steady, data-centric solutions against high-growth interactive software. This analysis aims to identify which business model delivers superior risk-adjusted returns for a diversified portfolio in today’s evolving tech landscape.
Table of contents
Companies Overview
Fair Isaac Corporation and Unity Software dominate distinct niches within the software application sector, shaping key digital frontiers.
Fair Isaac Corporation: Pioneer in Decision Analytics
Fair Isaac Corporation leads in analytic and decision management software, driving revenue through business-to-business scoring and decision automation solutions. Its core strength lies in sophisticated software platforms that enhance fraud detection, marketing, and customer engagement. In 2026, it focuses strategically on expanding modular software offerings that integrate advanced analytics to optimize complex decision processes across industries.
Unity Software Inc.: Leader in Real-Time 3D Content
Unity Software Inc. commands the interactive 3D content creation market with its real-time 2D and 3D development platform. It generates revenue by enabling creators to build, run, and monetize immersive experiences across mobile, PC, console, and AR/VR devices. Unity’s 2026 strategy emphasizes broadening its ecosystem to attract developers and designers, reinforcing its position as the go-to platform for interactive content innovation.
Strategic Collision: Similarities & Divergences
Fair Isaac and Unity both excel in software but diverge sharply in focus: one automates decisions; the other empowers creative content. They compete indirectly by addressing different digital transformation needs—data-driven business intelligence versus immersive experience creation. Their investment profiles contrast as well; Fair Isaac offers stability through entrenched analytics, while Unity presents dynamic growth potential amid evolving interactive media demands.
Income Statement Comparison
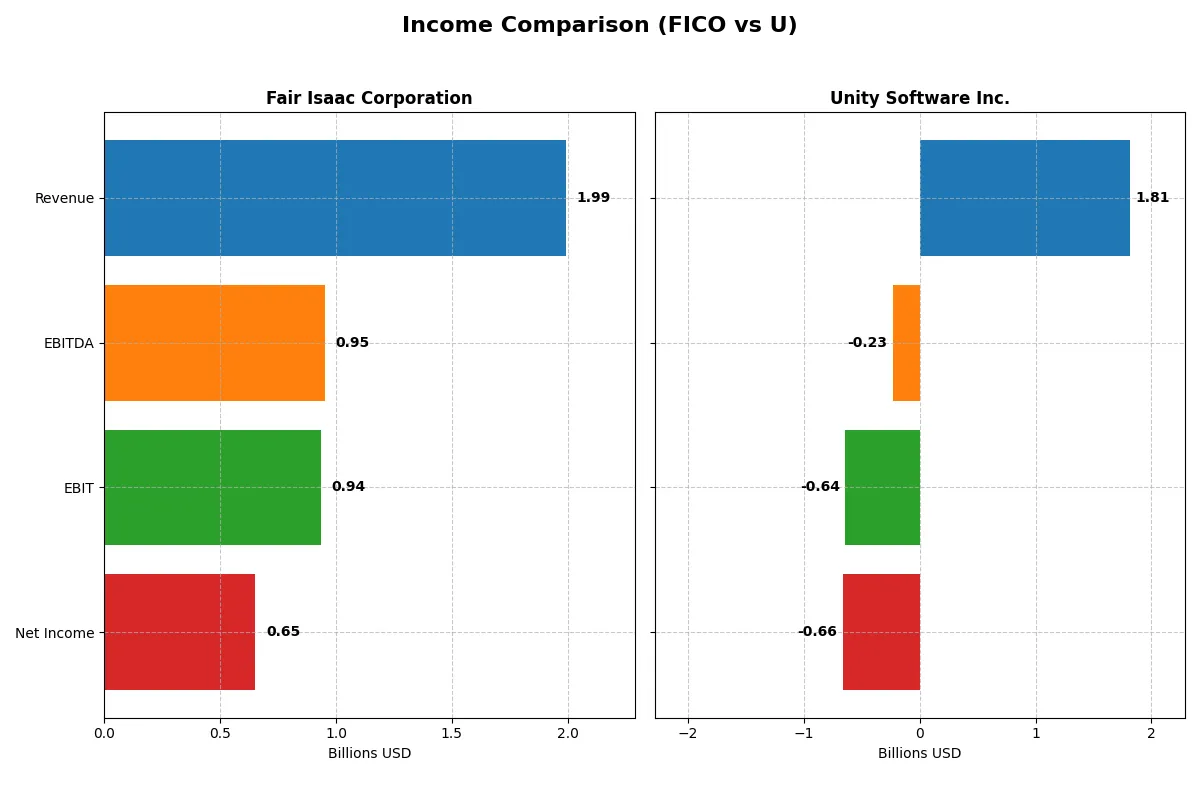
The following data dissects the core profitability and scalability of both corporate engines to reveal who dominates the bottom line:
| Metric | Fair Isaac Corporation (FICO) | Unity Software Inc. (U) |
|---|---|---|
| Revenue | 1.99B | 1.81B |
| Cost of Revenue | 354M | 481M |
| Operating Expenses | 712M | 2.09B |
| Gross Profit | 1.64B | 1.33B |
| EBITDA | 951M | -235M |
| EBIT | 936M | -644M |
| Interest Expense | 134M | 24M |
| Net Income | 652M | -664M |
| EPS | 26.9 | -1.68 |
| Fiscal Year | 2025 | 2024 |
Income Statement Analysis: The Bottom-Line Duel
This income statement comparison reveals the true efficiency and profitability of Fair Isaac Corporation and Unity Software Inc. over recent years.
Fair Isaac Corporation Analysis
Fair Isaac Corporation shows a robust growth trajectory, with revenue rising from 1.32B in 2021 to nearly 2B in 2025. Net income climbs from 392M to 652M over the same period. The company maintains strong gross margins above 82%, and net margins exceed 32%, reflecting efficient cost control and solid profitability. The 2025 fiscal year highlights a 15.9% revenue growth and a 29.8% EPS increase, illustrating accelerating momentum.
Unity Software Inc. Analysis
Unity Software’s revenue increased significantly from 772M in 2020 to 2.18B in 2023, but declined to 1.81B in 2024. Despite a favorable gross margin near 73%, Unity struggles with negative EBIT and net margins, reflecting substantial operating losses. The 2024 fiscal year shows a revenue drop of 17.1%, though EBIT improved by 16.8%. Net losses remain deep at -664M, signaling ongoing challenges in turning scale into profit.
Margin Power vs. Revenue Scale
Fair Isaac leads with consistent margin expansion and positive net income growth, while Unity’s revenue scale masks profitability struggles. Fair Isaac’s strong 32.7% net margin sharply contrasts with Unity’s -36.6%, making it the clear fundamental winner. Investors seeking reliable profitability will find Fair Isaac’s profile more attractive than Unity’s high-growth but loss-heavy model.
Financial Ratios Comparison
These vital ratios act as a diagnostic tool to expose the underlying fiscal health, valuation premiums, and capital efficiency of the companies analyzed below:
| Ratios | Fair Isaac Corporation (FICO) | Unity Software Inc. (U) |
|---|---|---|
| ROE | -37.3% | -20.8% |
| ROIC | 52.96% | -12.78% |
| P/E | 55.6 | -13.4 |
| P/B | -20.8 | 2.79 |
| Current Ratio | 0.83 | 2.50 |
| Quick Ratio | 0.83 | 2.50 |
| D/E | -1.76 | 0.74 |
| Debt-to-Assets | 1.65 | 0.35 |
| Interest Coverage | 6.92 | -32.08 |
| Asset Turnover | 1.07 | 0.27 |
| Fixed Asset Turnover | 21.20 | 18.35 |
| Payout ratio | 0 | 0 |
| Dividend yield | 0 | 0 |
| Fiscal Year | 2025 | 2024 |
Efficiency & Valuation Duel: The Vital Signs
Financial ratios serve as a company’s DNA, unlocking insights into hidden risks and operational strengths that raw figures alone cannot reveal.
Fair Isaac Corporation
Fair Isaac exhibits a strong net margin of 32.75%, signaling robust profitability, yet its ROE is deeply negative at -37.34%, reflecting shareholder equity challenges. The stock trades at a stretched P/E of 55.64, implying high valuation risk. With no dividend payout, Fair Isaac reinvests heavily in R&D, fueling growth but leaving investors reliant on capital appreciation.
Unity Software Inc.
Unity Software shows negative profitability with a net margin of -36.63% and ROE of -20.81%, underscoring ongoing losses. Its P/E ratio is negative but considered favorable due to earnings deficits, while the current ratio of 2.5 highlights strong liquidity. Unity also foregoes dividends, channeling resources into intensive R&D, indicating a growth-focused, yet financially vulnerable, profile.
Premium Valuation vs. Operational Fragility
Fair Isaac commands a premium valuation supported by solid margins but suffers from poor ROE and liquidity concerns. Unity’s lower valuation contrasts with weak profitability and heavy losses. Fair Isaac suits investors prioritizing operational efficiency and growth reinvestment. Unity fits those willing to tolerate risk for potential turnaround rewards.
Which one offers the Superior Shareholder Reward?
Fair Isaac Corporation (FICO) and Unity Software Inc. (U) both forgo dividends, focusing instead on reinvestment and buybacks. FICO operates with no dividend yield but boasts robust free cash flow (FCF) of 31.8/share and a near 99% FCF coverage ratio, signaling ample capital for sustainable buybacks. Unity, suffering persistent net losses, delivers a mere 0.69/share in free cash flow and a weaker 87% FCF coverage, with no buyback history. Historically, FICO’s strong margins and capital efficiency fuel consistent shareholder returns via buybacks, while Unity’s growth investments remain unproven. I conclude FICO offers the superior total shareholder reward in 2026 due to its sustainable buyback program and disciplined capital allocation.
Comparative Score Analysis: The Strategic Profile
The radar chart reveals the fundamental DNA and trade-offs of Fair Isaac Corporation and Unity Software Inc., highlighting their distinct financial strengths and weaknesses:
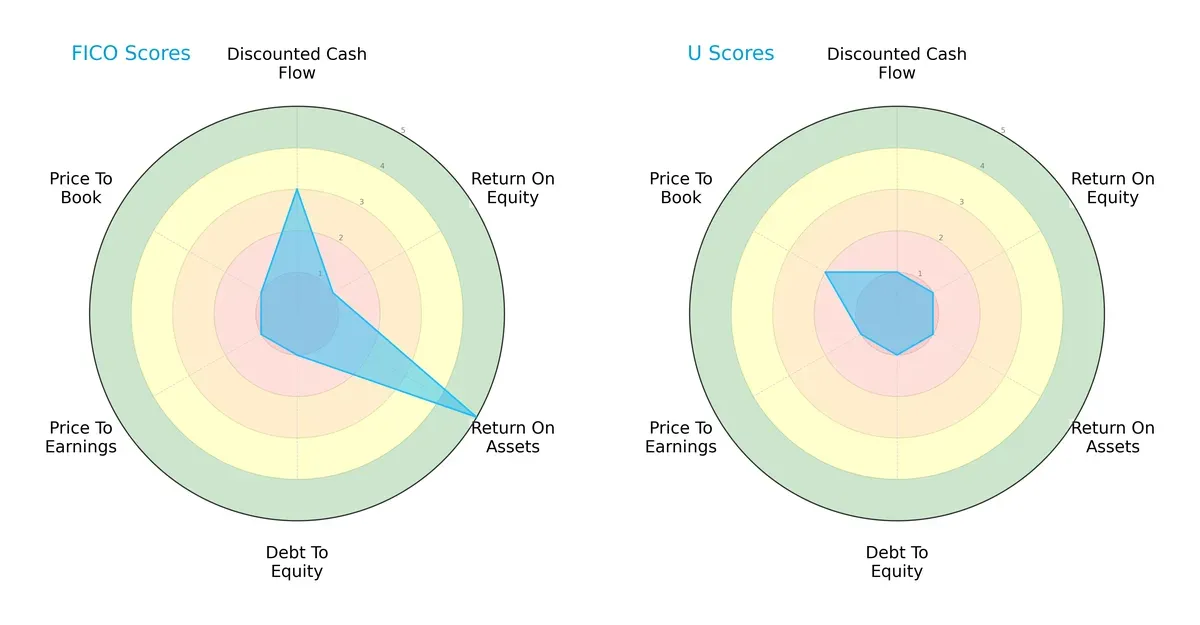
Fair Isaac demonstrates strength in asset utilization (ROA 5) and discounted cash flow (DCF 3), but suffers from weak equity returns (ROE 1) and a high debt burden (Debt/Equity 1). Unity shows uniformly poor scores across all metrics except a slightly better price-to-book valuation (P/B 2). Fair Isaac’s profile is more balanced, leveraging operational efficiency, while Unity relies on modest valuation appeal amid financial weaknesses.
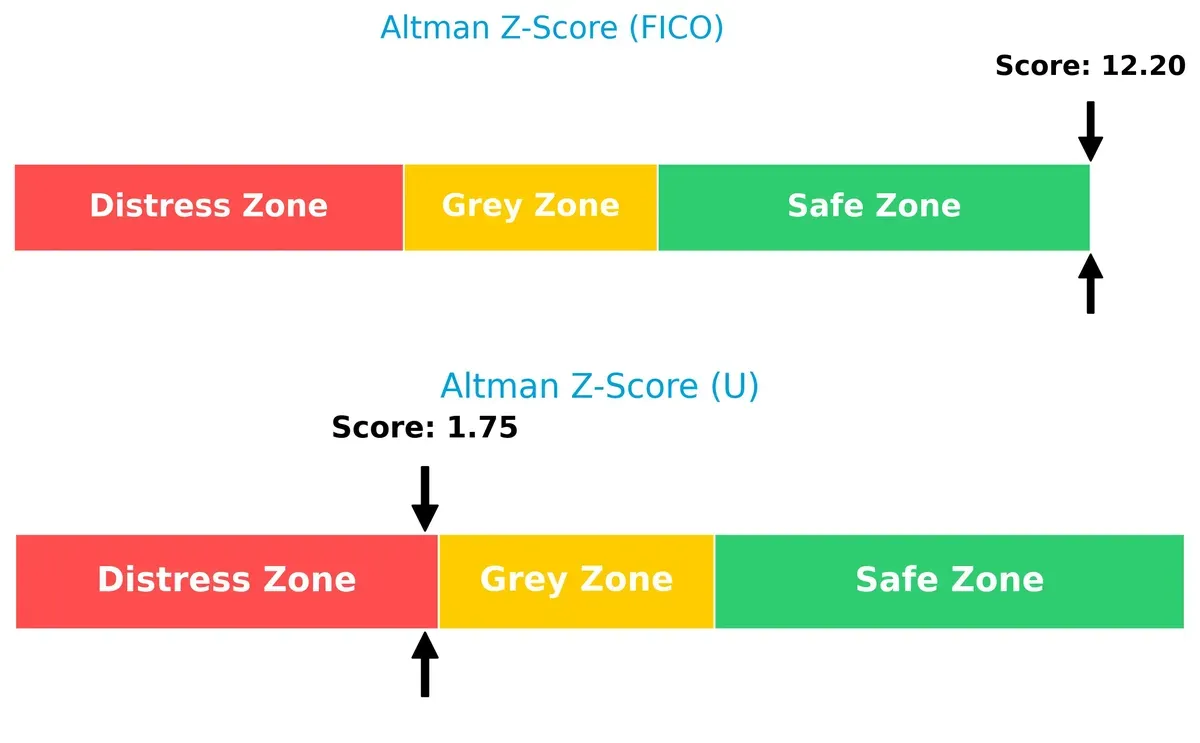
Bankruptcy Risk: Solvency Showdown
Fair Isaac’s Altman Z-Score of 12.2 places it firmly in the safe zone, signaling robust long-term survival potential. Unity’s 1.75 score lands it in the distress zone, warning of significant bankruptcy risk in this cycle:
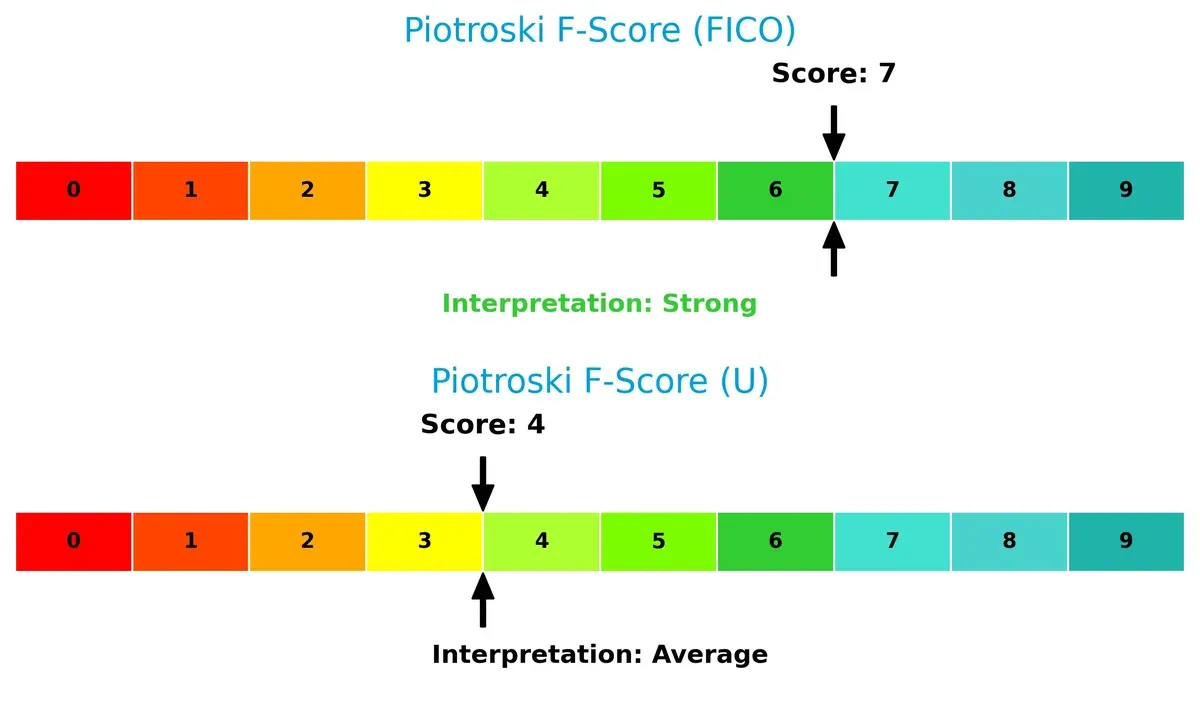
Financial Health: Quality of Operations
Fair Isaac scores a 7 on the Piotroski F-Score, indicating strong financial health with solid internal metrics. Unity’s score of 4 signals average financial quality and potential red flags in operational efficiency and profitability:
How are the two companies positioned?
This section dissects the operational DNA of FICO and Unity by comparing their revenue distribution and internal dynamics, including strengths and weaknesses. The goal is to confront their economic moats and reveal which business model delivers the most resilient, sustainable competitive advantage today.
Revenue Segmentation: The Strategic Mix
This visual comparison dissects how Fair Isaac Corporation and Unity Software diversify their income streams and reveals their primary sector bets:
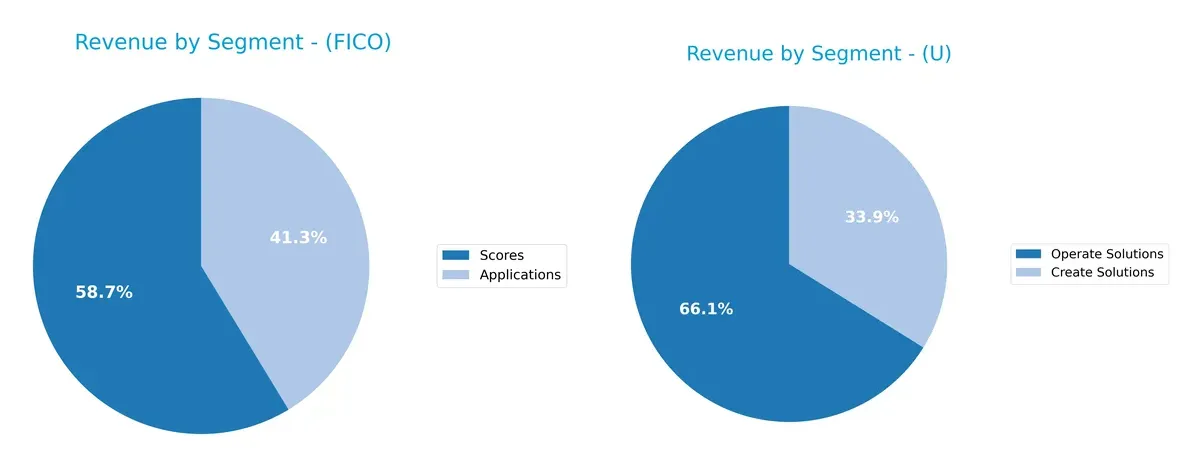
Fair Isaac Corporation anchors its revenue in two segments: Scores at $1.17B and Applications near $822M in 2025, showing a balanced but Scores-focused mix. Unity Software pivots around Operate Solutions at $1.2B, dwarfs Create Solutions with $614M. FICO’s dual-segment approach suggests steady software and scoring ecosystem lock-in. Unity’s heavy reliance on Operate Solutions signals concentration risk but highlights infrastructure dominance in game development.
Strengths and Weaknesses Comparison
This table compares the Strengths and Weaknesses of Fair Isaac Corporation and Unity Software Inc.:
FICO Strengths
- Strong profitability with 32.75% net margin
- High ROIC at 52.96% beats WACC
- Favorable asset turnover ratios
- Large revenue base in Americas and steady growth in Scores segment
U Strengths
- Favorable liquidity with 2.5 current and quick ratios
- Positive fixed asset turnover at 18.35
- Diversified revenue streams in Create and Operate Solutions
- Geographic presence across US, EMEA, Asia Pacific and Greater China
FICO Weaknesses
- Negative ROE at -37.34% signals equity inefficiency
- High debt to assets ratio at 164.6% raises leverage concerns
- Low current ratio at 0.83 risks short-term liquidity
- Unfavorable P/E at 55.64 indicates high valuation
U Weaknesses
- Negative profitability metrics: net margin -36.63%, ROE -20.81%, ROIC -12.78%
- Unfavorable WACC at 11.82% exceeds returns
- Negative interest coverage at -27.34 signals financial strain
- Weak asset turnover at 0.27 limits operational efficiency
FICO exhibits strong profitability and efficient capital use but faces leverage and liquidity risks. Unity shows diverse revenue and solid liquidity but struggles with profitability and financial stability. These factors shape each company’s strategic challenges and opportunities.
The Moat Duel: Analyzing Competitive Defensibility
A structural moat is the only thing protecting long-term profits from the erosion of competition. Let’s dissect the moats of two tech leaders:
Fair Isaac Corporation: Intangible Assets Powerhouse
FICO’s moat centers on its proprietary analytics and scoring algorithms. This moat yields high ROIC (43.6% above WACC) and margin stability. In 2026, expanding decision management software could deepen its competitive edge.
Unity Software Inc.: Network Effects Under Pressure
Unity relies on network effects from its real-time 3D content platform. Unlike FICO, Unity suffers declining ROIC and negative margins, signaling a fragile moat. However, growth in AR/VR markets offers potential to rebuild value.
Moat Strength Showdown: Intangible Assets vs. Network Effects
FICO’s wide, durable moat outpaces Unity’s weakening economic returns by a large margin. FICO stands better equipped to defend and expand its market share in 2026 and beyond.
Which stock offers better returns?
Over the past 12 months, Fair Isaac Corporation’s stock gained 12.51%, showing a bullish trend with decelerating momentum. Unity Software’s shares rose 7.54%, also bullish but with lower volatility and deceleration.
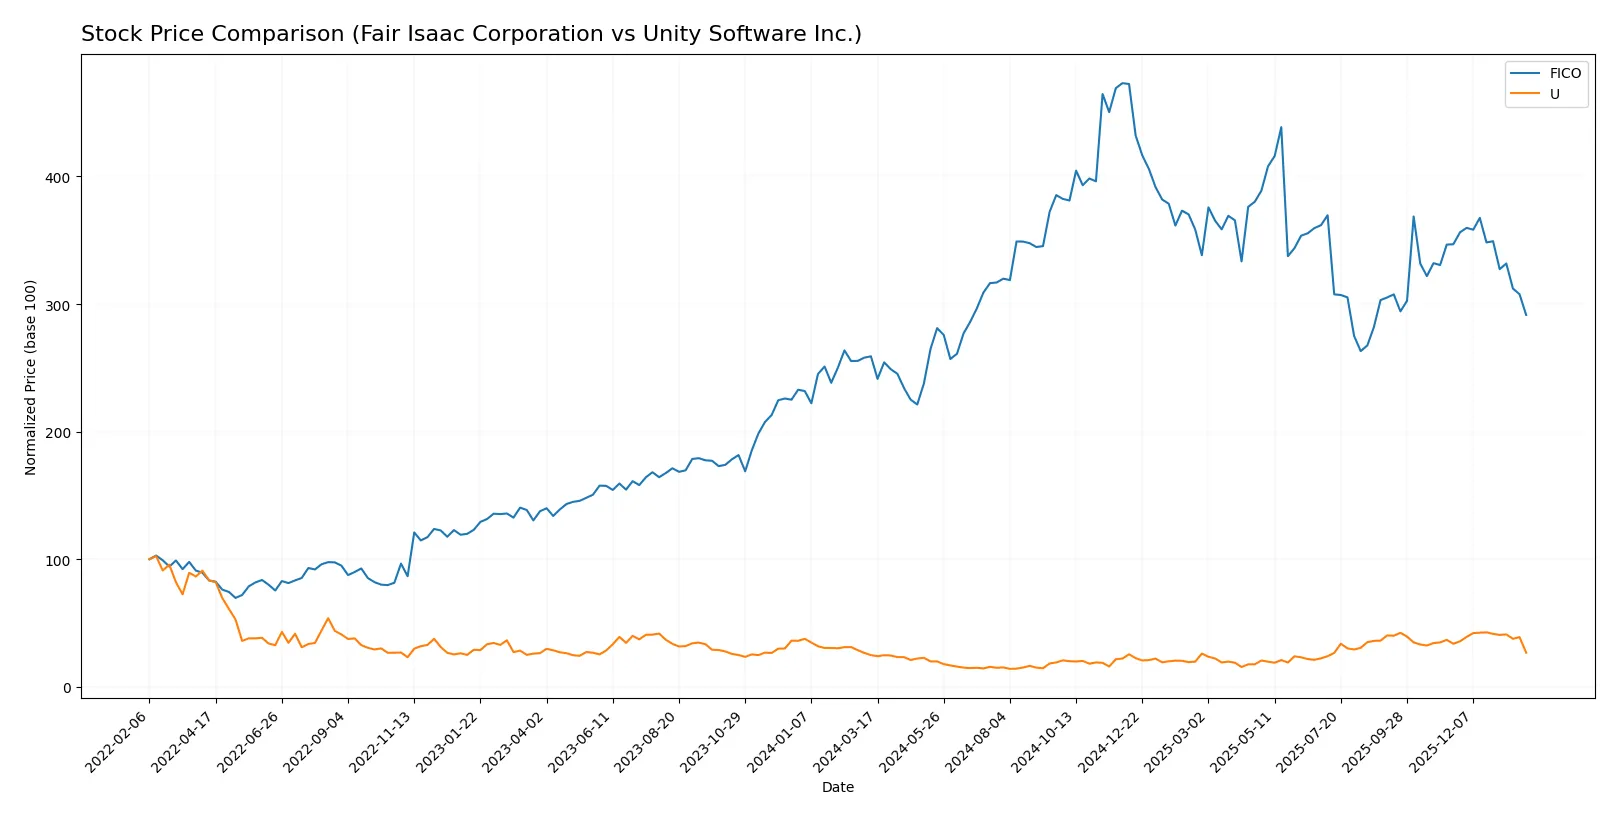
Trend Comparison
Fair Isaac Corporation’s stock climbed 12.51% over the past year, marking a bullish trend with deceleration. The price ranged from 1,110.85 to 2,375.03, though recent months show a negative 15.98% pullback.
Unity Software’s shares increased 7.54% over the last year, maintaining a bullish but decelerating trend. Price volatility remained low, between 15.32 and 46.42, with a sharper recent decline of 20.75%.
Fair Isaac Corporation outperformed Unity Software in total returns, despite both stocks facing recent downward pressure. FICO delivered the highest market performance over the 12-month period.
Target Prices
Analysts show a bullish consensus for both Fair Isaac Corporation and Unity Software Inc.
| Company | Target Low | Target High | Consensus |
|---|---|---|---|
| Fair Isaac Corporation | 1,640 | 2,400 | 2,115 |
| Unity Software Inc. | 39 | 60 | 50.98 |
Fair Isaac’s target consensus sits 45% above its current 1,463 price, indicating strong growth expectations. Unity’s consensus target more than doubles its 29.1 price, signaling high analyst optimism despite recent volatility.

Don’t Let Luck Decide Your Entry Point
Optimize your entry points with our advanced ProRealTime indicators. You’ll get efficient buy signals with precise price targets for maximum performance. Start outperforming now!
How do institutions grade them?
This section compares the recent grades assigned to Fair Isaac Corporation and Unity Software Inc. by reputable financial institutions:
Fair Isaac Corporation Grades
Below is the summary of recent grades given by established grading firms:
| Grading Company | Action | New Grade | Date |
|---|---|---|---|
| Needham | Maintain | Buy | 2026-01-29 |
| Jefferies | Maintain | Buy | 2026-01-16 |
| Wells Fargo | Maintain | Overweight | 2026-01-14 |
| JP Morgan | Maintain | Neutral | 2025-11-06 |
| Baird | Maintain | Outperform | 2025-11-06 |
| Jefferies | Maintain | Buy | 2025-11-06 |
| BMO Capital | Maintain | Outperform | 2025-11-06 |
| Wells Fargo | Maintain | Overweight | 2025-10-14 |
| Barclays | Maintain | Overweight | 2025-10-02 |
| Needham | Maintain | Buy | 2025-10-02 |
Unity Software Inc. Grades
The table below shows recent institutional grades for Unity Software:
| Grading Company | Action | New Grade | Date |
|---|---|---|---|
| Goldman Sachs | Maintain | Neutral | 2026-01-13 |
| Morgan Stanley | Maintain | Overweight | 2026-01-13 |
| Wells Fargo | Maintain | Overweight | 2026-01-08 |
| Jefferies | Maintain | Buy | 2026-01-05 |
| Piper Sandler | Upgrade | Overweight | 2025-12-11 |
| BTIG | Upgrade | Buy | 2025-12-11 |
| Wells Fargo | Upgrade | Overweight | 2025-12-05 |
| Arete Research | Upgrade | Buy | 2025-12-01 |
| Citigroup | Maintain | Buy | 2025-11-11 |
| Wells Fargo | Maintain | Equal Weight | 2025-11-07 |
Which company has the best grades?
Fair Isaac Corporation consistently receives “Buy,” “Outperform,” and “Overweight” ratings from multiple firms. Unity Software shows a mix of “Buy” and “Overweight” grades with several recent upgrades. Fair Isaac’s broader consensus of positive ratings may indicate stronger institutional confidence, potentially attracting more investor interest.
Risks specific to each company
The following categories identify critical pressure points and systemic threats facing both firms in the 2026 market environment:
1. Market & Competition
Fair Isaac Corporation
- Established scoring and analytic software with strong market presence but faces innovation pressure.
Unity Software Inc.
- Rapidly evolving 3D content platform sector with intense competition and high innovation demands.
2. Capital Structure & Debt
Fair Isaac Corporation
- High debt-to-assets ratio at 165% signals leverage risk despite good interest coverage.
Unity Software Inc.
- Moderate debt levels with balanced debt-to-assets ratio around 35%, but interest coverage is negative, indicating financial strain.
3. Stock Volatility
Fair Isaac Corporation
- Beta at 1.29 suggests moderate volatility, within typical tech sector range.
Unity Software Inc.
- Beta above 2.0 signals high stock volatility, increasing risk for investors seeking stability.
4. Regulatory & Legal
Fair Isaac Corporation
- Operates globally with compliance demands, but stable regulatory environment in financial services analytics.
Unity Software Inc.
- Exposure to multiple jurisdictions with evolving regulations in interactive content and data privacy risks.
5. Supply Chain & Operations
Fair Isaac Corporation
- Relies on data and software delivery systems with limited physical supply chain risks.
Unity Software Inc.
- Dependent on cloud infrastructure and global developer ecosystems, vulnerable to tech disruptions.
6. ESG & Climate Transition
Fair Isaac Corporation
- Moderate ESG risks, with growing pressure to align analytics with sustainable finance trends.
Unity Software Inc.
- Faces increasing scrutiny over digital carbon footprint and social governance in tech content creation.
7. Geopolitical Exposure
Fair Isaac Corporation
- Global presence exposes it to geopolitical tensions, but diversified markets reduce single-region risk.
Unity Software Inc.
- High international exposure, especially in Asia and Europe, increasing geopolitical and trade risk.
Which company shows a better risk-adjusted profile?
Fair Isaac Corporation’s most impactful risk is its elevated leverage, which could strain financial flexibility despite strong profitability metrics. Unity Software’s chief risk is severe financial distress indicated by negative profitability and poor interest coverage. Given these factors, Fair Isaac shows a superior risk-adjusted profile, supported by a robust Altman Z-Score of 12.2 (safe zone) versus Unity’s 1.75 (distress zone). The stark contrast in financial stability and debt management underscores my concern for Unity’s near-term solvency.
Final Verdict: Which stock to choose?
Fair Isaac Corporation’s superpower lies in its durable competitive advantage, evidenced by a strong and growing ROIC well above its WACC. It efficiently converts invested capital into substantial value, supported by robust income growth. The point of vigilance is its below-par current ratio, signaling liquidity risks. This stock suits portfolios aiming for aggressive growth with a tolerance for operational leverage.
Unity Software’s strategic moat centers on its innovative platform and recurring revenue potential, fueling high revenue growth despite current profitability challenges. It offers a comparatively safer liquidity profile, supported by a strong current ratio and manageable debt levels. Unity fits well within growth-at-a-reasonable-price (GARP) portfolios seeking exposure to transformative tech with a higher risk appetite.
If you prioritize value creation and proven profitability, Fair Isaac outshines with its superior capital efficiency and income stability. However, if you seek high growth potential with better liquidity safeguards, Unity offers a compelling albeit riskier scenario. Both demand cautious monitoring of their respective weaknesses to navigate market cycles prudently.
Disclaimer: Investment carries a risk of loss of initial capital. The past performance is not a reliable indicator of future results. Be sure to understand risks before making an investment decision.
Go Further
I encourage you to read the complete analyses of Fair Isaac Corporation and Unity Software Inc. to enhance your investment decisions: