Home > Comparison > Technology > UBER vs FICO
The strategic rivalry between Uber Technologies, Inc. and Fair Isaac Corporation shapes the evolution of the technology sector. Uber operates as a capital-intensive platform connecting mobility, delivery, and freight services globally. In contrast, Fair Isaac focuses on high-margin analytic software and decision management solutions. This head-to-head pits disruptive scale against specialized expertise. This analysis aims to identify which trajectory offers superior risk-adjusted returns for a diversified portfolio in today’s competitive landscape.
Table of contents
Companies Overview
Uber Technologies, Inc. and Fair Isaac Corporation are pivotal players in the software application landscape with distinct market roles.
Uber Technologies, Inc.: Global Mobility and Delivery Innovator
Uber dominates as a mobility platform connecting riders with drivers worldwide. It generates revenue primarily through Mobility, Delivery, and Freight segments, facilitating ridesharing, meal and goods delivery, and logistics. In 2026, Uber emphasizes expanding its delivery services and enhancing platform integration to capture broader market share across continents.
Fair Isaac Corporation: Decision Analytics Powerhouse
Fair Isaac Corporation excels in analytic and decision management software, enabling businesses to automate and optimize decisions. Its core revenue stems from Scores and Software segments, providing scoring solutions and modular analytics platforms. The company focuses on enhancing AI-driven decision tools and expanding cloud-based services to meet evolving enterprise needs in 2026.
Strategic Collision: Similarities & Divergences
Uber and Fair Isaac pursue technology-driven growth but diverge in end markets: consumer mobility versus enterprise analytics. Their competition centers on data utilization—Uber leverages real-time consumer data for logistics, while Fair Isaac drives decision automation with predictive analytics. These contrasting models yield distinct investment profiles: Uber bets on scale and network effects, Fair Isaac on software innovation and recurring revenue stability.
Income Statement Comparison
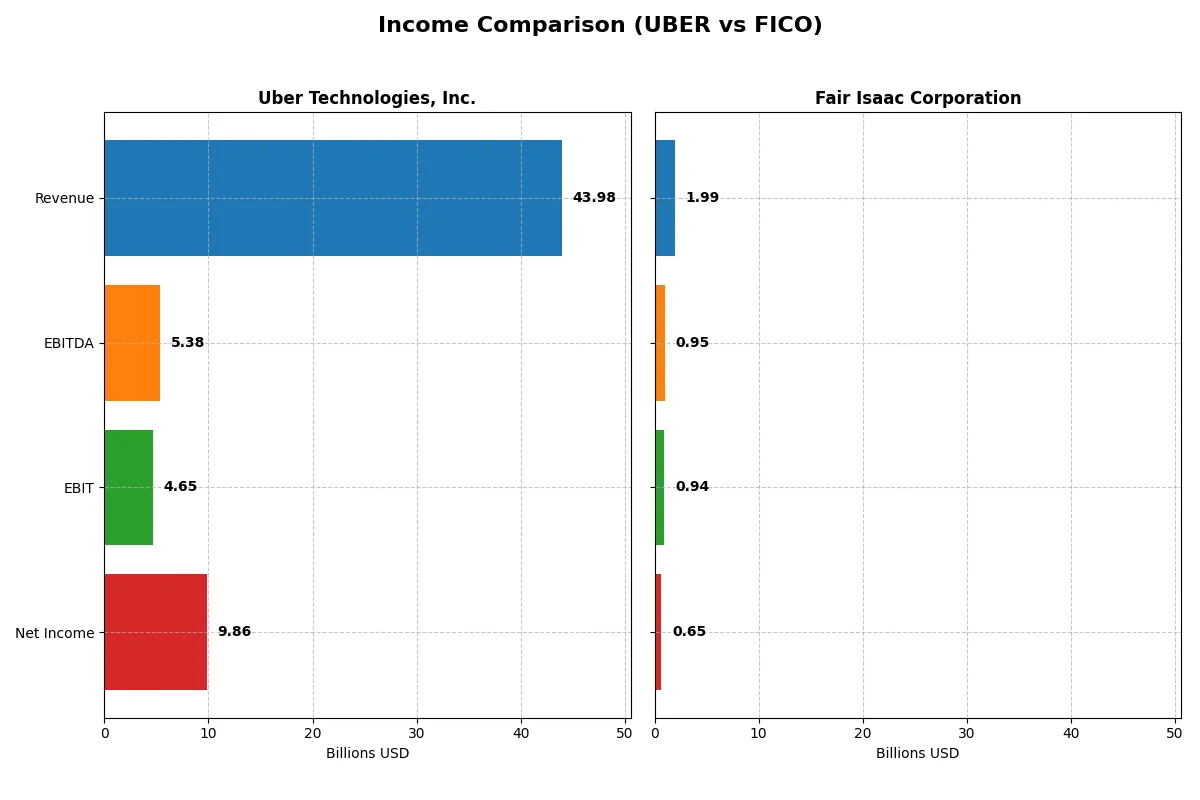
This data dissects the core profitability and scalability of both corporate engines to reveal who dominates the bottom line:
| Metric | Uber Technologies, Inc. (UBER) | Fair Isaac Corporation (FICO) |
|---|---|---|
| Revenue | 43.98B | 1.99B |
| Cost of Revenue | 26.65B | 354M |
| Operating Expenses | 14.53B | 712M |
| Gross Profit | 17.33B | 1.64B |
| EBITDA | 5.39B | 951M |
| EBIT | 4.65B | 936M |
| Interest Expense | 523M | 134M |
| Net Income | 9.86B | 652M |
| EPS | 4.71 | 26.9 |
| Fiscal Year | 2024 | 2025 |
Income Statement Analysis: The Bottom-Line Duel
The income statement comparison reveals which company drives superior profitability and operational efficiency through its core business model.
Uber Technologies, Inc. Analysis
Uber’s revenue surged from $17.5B in 2021 to $44B in 2024, reflecting a robust 295% growth over five years. Net income swung dramatically from a $496M loss in 2021 to a $9.8B profit in 2024. Gross margin improved to 39.4%, and net margin expanded to 22.4%, signaling strong margin recovery and operational momentum in 2024.
Fair Isaac Corporation Analysis
FICO’s revenue grew steadily from $1.3B in 2021 to $1.99B in 2025, marking a 51% increase over five years. Net income rose consistently to $652M in 2025. The company maintained an impressive gross margin of 82.2% and a net margin of 32.8%, showcasing high profitability and efficient cost control as it scaled.
Margin Power vs. Revenue Scale
Uber’s explosive revenue growth outpaces FICO’s more modest increase, yet FICO delivers superior gross and net margins consistently. Uber’s margin expansion is notable but still trails FICO’s high profitability levels. Investors seeking rapid top-line growth may favor Uber, while those prioritizing margin strength and stable earnings might prefer FICO’s profile.
Financial Ratios Comparison
These vital ratios act as a diagnostic tool to expose the underlying fiscal health, valuation premiums, and capital efficiency of the companies compared below:
| Ratios | Uber Technologies, Inc. (UBER) | Fair Isaac Corporation (FICO) |
|---|---|---|
| ROE | 45.7% | -37.3% |
| ROIC | 6.8% | 53.0% |
| P/E | 12.8 | 55.6 |
| P/B | 5.86 | -20.8 |
| Current Ratio | 1.07 | 0.83 |
| Quick Ratio | 1.07 | 0.83 |
| D/E | 0.53 | -1.76 |
| Debt-to-Assets | 22.3% | 164.6% |
| Interest Coverage | 5.35 | 6.92 |
| Asset Turnover | 0.86 | 1.07 |
| Fixed Asset Turnover | 14.1 | 21.2 |
| Payout ratio | 0% | 0% |
| Dividend yield | 0% | 0% |
| Fiscal Year | 2024 | 2025 |
Efficiency & Valuation Duel: The Vital Signs
Financial ratios serve as a company’s DNA, exposing hidden risks and revealing operational excellence crucial for investment decisions.
Uber Technologies, Inc.
Uber posts a strong ROE of 45.7% and a healthy net margin of 22.4%, signaling robust profitability. Its P/E of 12.8 suggests an attractive valuation, though a high P/B at 5.86 hints at some premium pricing. Uber offers no dividends but reinvests heavily in R&D and growth, aiming to sustain its competitive edge.
Fair Isaac Corporation
FICO demonstrates an impressive net margin of 32.8% and a stellar ROIC of 53.0%, reflecting operational efficiency. However, its P/E of 55.6 marks the stock as expensive relative to peers. The firm pays no dividend, instead channeling resources into research and development to fuel long-term innovation and expansion.
Premium Valuation vs. Operational Safety
Uber offers a balanced risk-reward profile with strong profitability and reasonable valuation metrics. FICO excels in operational efficiency but trades at a stretched valuation with higher risk indicators. Investors seeking growth with a margin of safety may lean toward Uber’s profile, while those chasing high operational returns might consider FICO despite its premium price.
Which one offers the Superior Shareholder Reward?
Uber Technologies, Inc. and Fair Isaac Corporation both pay no dividends, focusing on reinvestment and buybacks for shareholder return. Uber’s free cash flow per share stands at $3.29 with modest buybacks, emphasizing growth. FICO, with a much higher free cash flow per share of $31.76, aggressively deploys cash in buybacks, signaling strong capital return. Uber’s payout is growth-driven, while FICO’s distribution through buybacks is more intense but risks leverage concerns. I find FICO offers a superior total return profile in 2026 due to robust free cash flow and efficient capital allocation, despite its complex balance sheet.
Comparative Score Analysis: The Strategic Profile
The radar chart reveals the fundamental DNA and trade-offs of Uber Technologies, Inc. and Fair Isaac Corporation, highlighting their financial strengths and weaknesses:
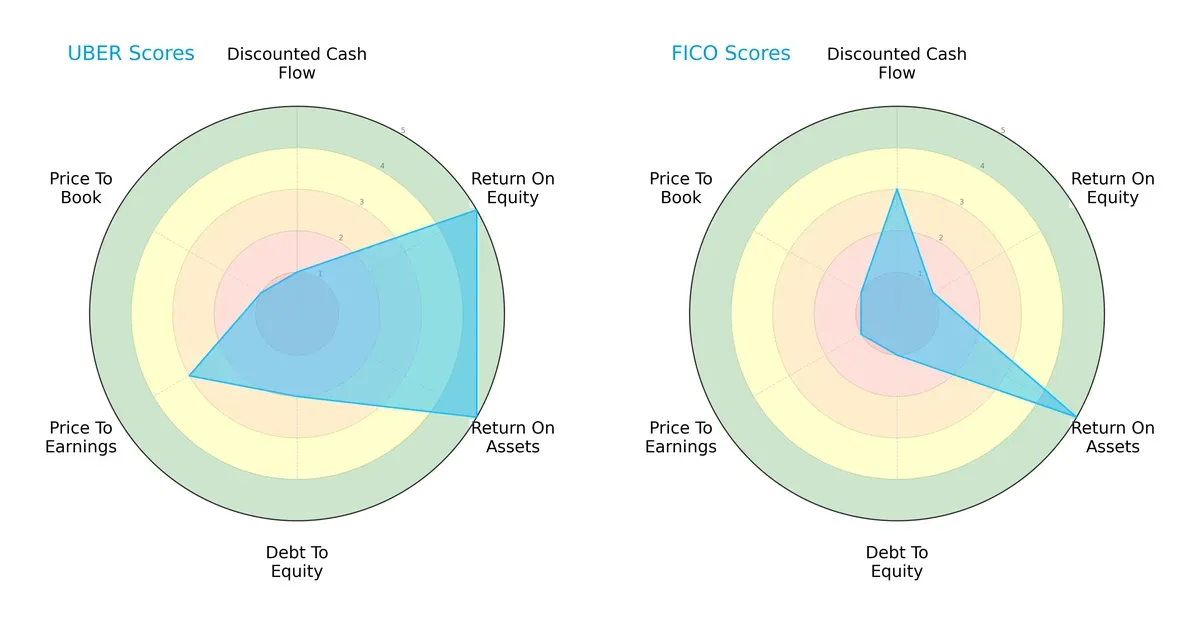
Uber shows strength in return metrics with very favorable ROE and ROA scores, reflecting efficient capital and asset use. However, its discounted cash flow and price-to-book scores indicate valuation challenges. Fair Isaac leans heavily on asset efficiency but struggles with return on equity and valuation metrics, suggesting reliance on operational efficiency over profitability. Uber presents a more balanced profile, while Fair Isaac depends on specific asset utilization advantages.
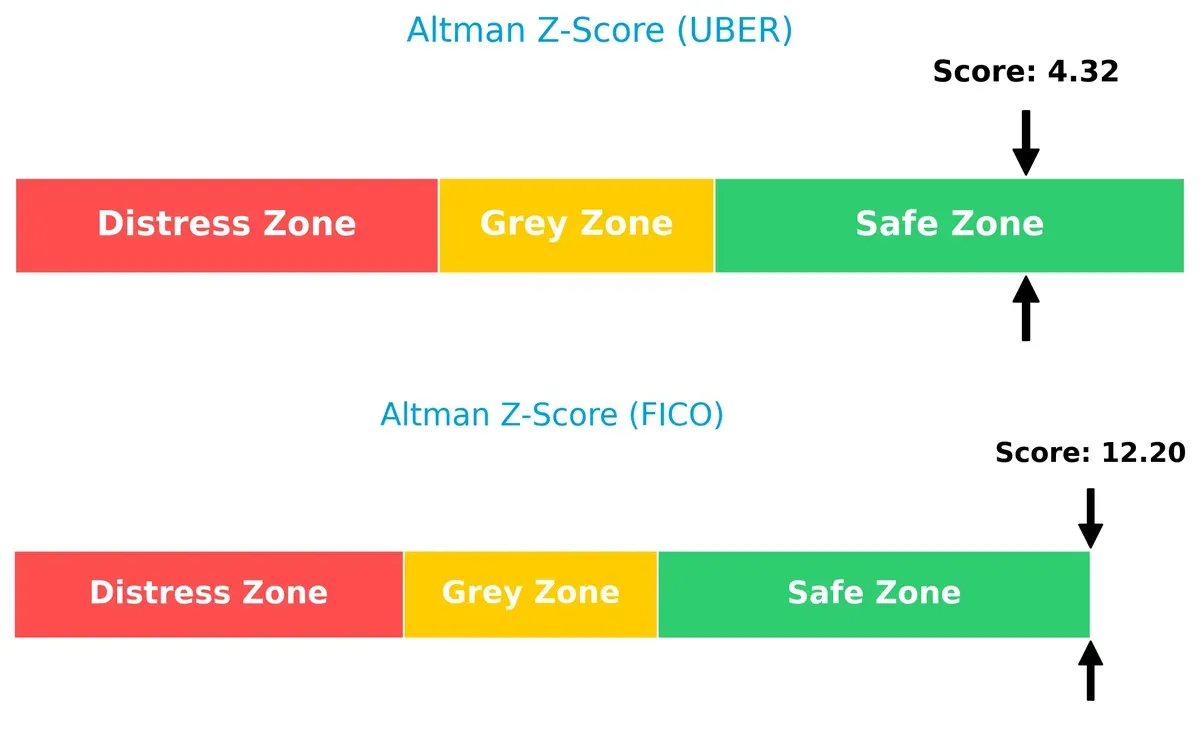
Bankruptcy Risk: Solvency Showdown
The Altman Z-Score difference indicates both firms are solid, but Fair Isaac’s much higher score signals superior financial safety in this cycle:
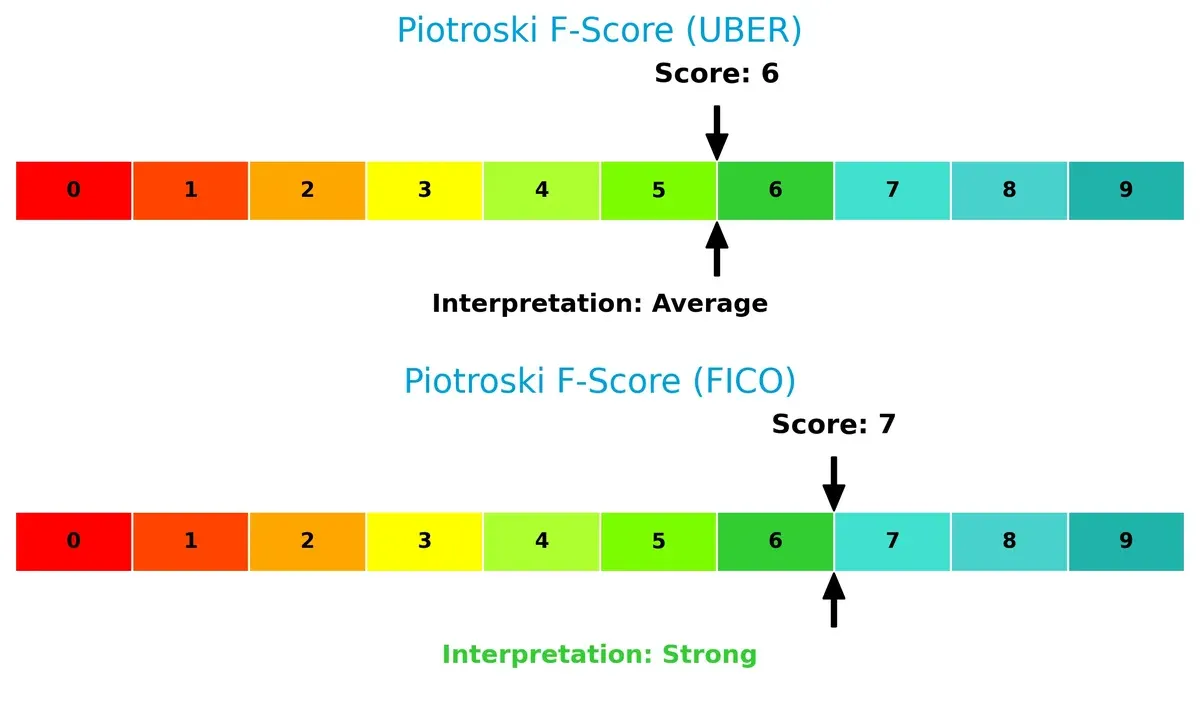
Financial Health: Quality of Operations
Fair Isaac’s Piotroski F-Score of 7 outperforms Uber’s 6, signaling stronger overall financial health and fewer red flags in operational metrics:
How are the two companies positioned?
This section dissects Uber and FICO’s operational DNA by comparing their revenue distribution and internal strengths and weaknesses. The goal: confront their economic moats to identify which model offers the most resilient, sustainable competitive edge today.
Revenue Segmentation: The Strategic Mix
This visual comparison dissects how Uber Technologies, Inc. and Fair Isaac Corporation diversify their income streams and where their primary sector bets lie:
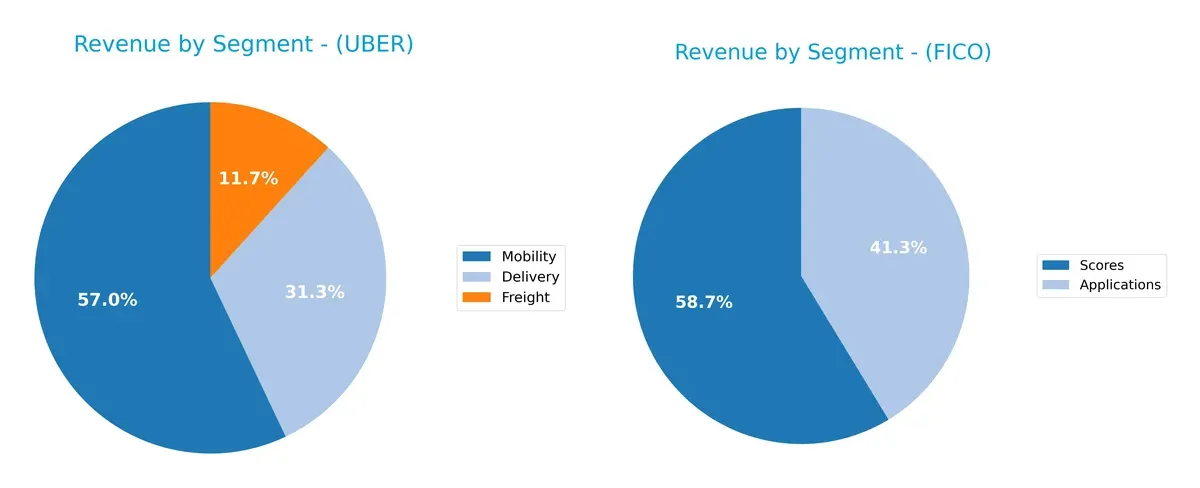
Uber’s revenue pivots heavily on Mobility at $25B, dwarfing its Delivery ($13.75B) and Freight ($5.14B) segments. In contrast, FICO shows a balanced split between Scores ($1.17B) and Applications ($822M) in 2025. Uber’s concentration in Mobility suggests infrastructure dominance but raises concentration risk. FICO’s diversified software and scoring streams reflect steady ecosystem lock-in, reducing volatility and enhancing resilience.
Strengths and Weaknesses Comparison
This table compares the Strengths and Weaknesses of Uber Technologies, Inc. and Fair Isaac Corporation:
Uber Strengths
- Strong diversification with Mobility, Delivery, Freight segments
- Favorable net margin at 22.41%
- Robust ROE at 45.72%
- Favorable debt-to-assets at 22.32%
- High fixed asset turnover of 14.14
- Significant global presence across US, EMEA, Asia Pacific
FICO Strengths
- High net margin at 32.75%
- Exceptional ROIC at 52.96% beating WACC
- Favorable PB and debt-to-equity ratios
- Strong asset and fixed asset turnover ratios
- Focused product segmentation in Applications and Scores
- Global reach with Americas, EMEA, Asia Pacific revenues
Uber Weaknesses
- Unfavorable PB ratio at 5.86 indicating potential overvaluation
- Neutral current ratio at 1.07 may constrain liquidity
- No dividend yield
- ROIC below WACC at 6.79%
- PE relatively low at 12.82 indicating market skepticism
FICO Weaknesses
- Negative ROE at -37.34% signals profitability issues
- Unfavorable debt-to-assets at 164.6% poses financial risk
- Unfavorable PE at 55.64 suggests overvaluation
- Current ratio low at 0.83 indicating liquidity concerns
- No dividend yield
Both companies show strengths in profitability and global reach but face distinct financial risks. Uber’s diversified segments support resilience, while FICO’s strong ROIC contrasts with weak ROE and leverage concerns. These factors shape their strategic priorities and risk management.
The Moat Duel: Analyzing Competitive Defensibility
A structural moat protects long-term profits from competitive erosion. Only a durable advantage sustains value creation over time:
Uber Technologies, Inc.: Platform Network Effects with Emerging Profitability
Uber’s moat stems from network effects connecting riders and drivers worldwide. Its growing ROIC signals improving capital efficiency despite current value destruction. Expansion in delivery and freight markets could deepen this advantage in 2026.
Fair Isaac Corporation: Data-Driven Intangible Asset Moat
FICO’s moat arises from proprietary analytics and strong brand trust in credit scoring. It consistently creates value with ROIC well above WACC. Continued innovation in decision management software supports steady growth and margin resilience.
Network Effects vs. Intangible Assets: The Moat Showdown
FICO holds a deeper moat with ROIC surpassing WACC by 43.6%, reflecting superior value creation. Uber’s network effects are promising but haven’t translated into positive economic profit yet. FICO is better positioned to defend and grow its market share.
Which stock offers better returns?
Stock prices of Uber Technologies, Inc. and Fair Isaac Corporation reveal distinct trading dynamics and key price movements over the past 12 months.
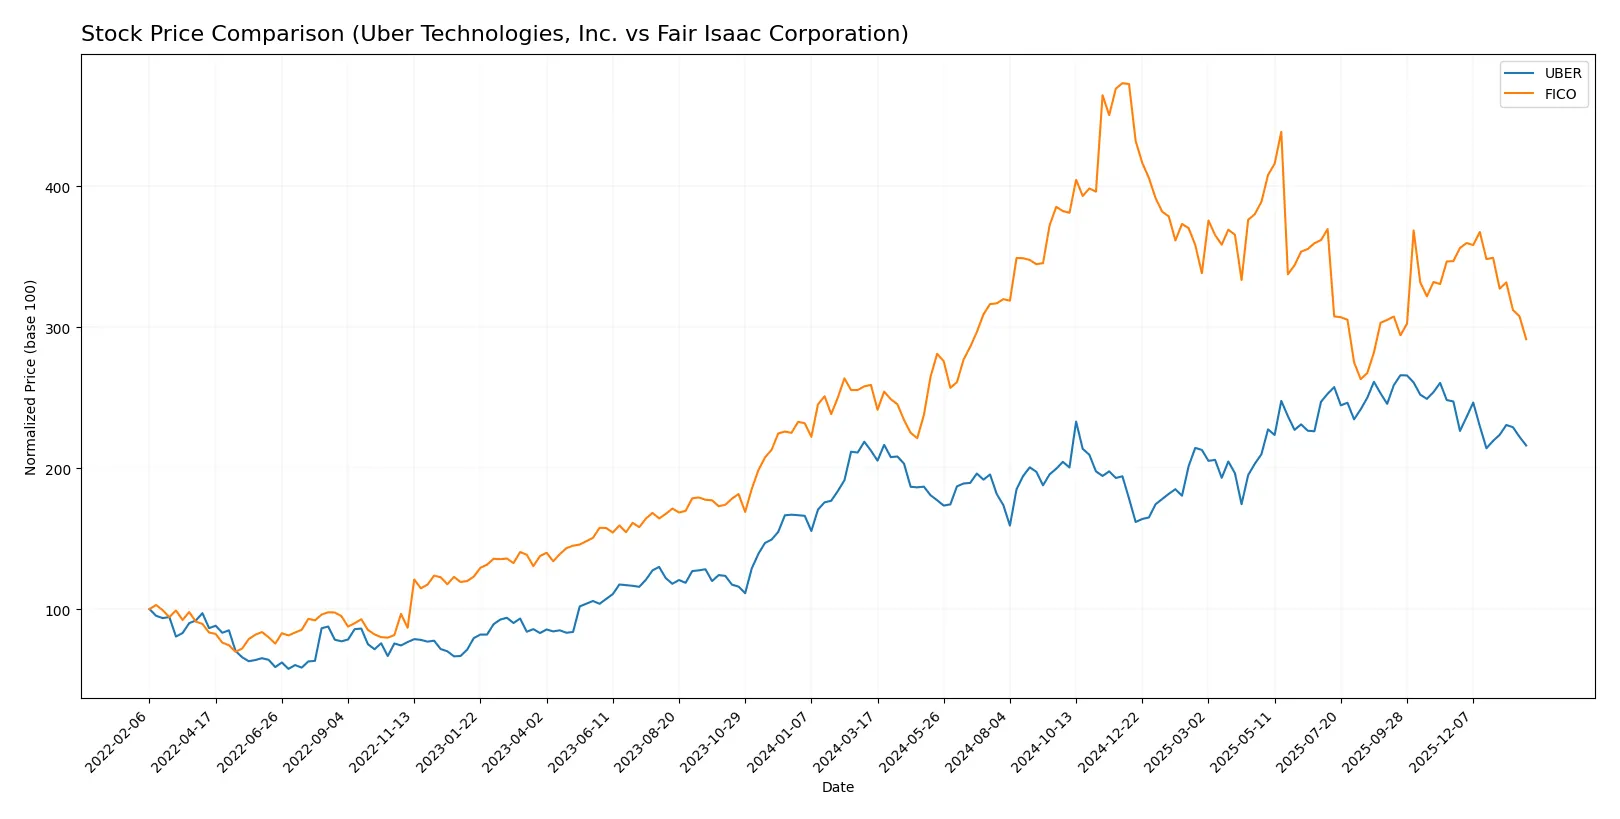
Trend Comparison
Uber’s stock shows a marginal 1.72% price increase over the past year, indicating a bullish but decelerating trend. The stock peaked at 98.51 and bottomed at 58.99 during this period.
Fair Isaac’s stock gained 12.51% over 12 months, reflecting a strong bullish trend with deceleration. It experienced a high of 2375.03 and a low of 1110.85, with significant volatility.
Comparatively, Fair Isaac outperformed Uber, delivering substantially higher returns and more pronounced price appreciation over the last year.
Target Prices
Analysts present a bullish consensus for both Uber Technologies, Inc. and Fair Isaac Corporation.
| Company | Target Low | Target High | Consensus |
|---|---|---|---|
| Uber Technologies, Inc. | 73 | 140 | 110.1 |
| Fair Isaac Corporation | 1640 | 2400 | 2115 |
The consensus target for Uber sits 37% above its current 80.05 price, signaling strong growth expectations. Fair Isaac’s target consensus exceeds its 1463.17 price by 45%, reflecting robust optimism in its software-driven model.

Don’t Let Luck Decide Your Entry Point
Optimize your entry points with our advanced ProRealTime indicators. You’ll get efficient buy signals with precise price targets for maximum performance. Start outperforming now!
How do institutions grade them?
The following tables present the latest institutional grades for Uber Technologies, Inc. and Fair Isaac Corporation:
Uber Technologies, Inc. Grades
This table summarizes recent grades issued by reputable financial institutions for Uber Technologies, Inc.
| Grading Company | Action | New Grade | Date |
|---|---|---|---|
| Stifel | Maintain | Buy | 2026-01-27 |
| Guggenheim | Maintain | Buy | 2026-01-22 |
| Keybanc | Maintain | Overweight | 2026-01-20 |
| BTIG | Maintain | Buy | 2026-01-15 |
| Cantor Fitzgerald | Maintain | Overweight | 2026-01-08 |
| Wells Fargo | Maintain | Overweight | 2026-01-08 |
| Wolfe Research | Maintain | Outperform | 2026-01-06 |
| Wedbush | Maintain | Neutral | 2025-12-19 |
| Morgan Stanley | Maintain | Overweight | 2025-12-08 |
| Arete Research | Upgrade | Buy | 2025-12-03 |
Fair Isaac Corporation Grades
This table lists recent institutional grades for Fair Isaac Corporation from recognized grading firms.
| Grading Company | Action | New Grade | Date |
|---|---|---|---|
| Needham | Maintain | Buy | 2026-01-29 |
| Jefferies | Maintain | Buy | 2026-01-16 |
| Wells Fargo | Maintain | Overweight | 2026-01-14 |
| JP Morgan | Maintain | Neutral | 2025-11-06 |
| Baird | Maintain | Outperform | 2025-11-06 |
| Jefferies | Maintain | Buy | 2025-11-06 |
| BMO Capital | Maintain | Outperform | 2025-11-06 |
| Wells Fargo | Maintain | Overweight | 2025-10-14 |
| Barclays | Maintain | Overweight | 2025-10-02 |
| Needham | Maintain | Buy | 2025-10-02 |
Which company has the best grades?
Both companies have consistent positive grades from reputable institutions. Uber shows a strong Buy and Overweight consensus with recent upgrades. Fair Isaac also maintains Buy and Outperform ratings but includes some Neutral grades. Investors may view Uber’s more recent upgrades as a signal of improving sentiment.
Risks specific to each company
The following categories identify the critical pressure points and systemic threats facing both firms in the 2026 market environment:
1. Market & Competition
Uber Technologies, Inc.
- Faces intense competition in ridesharing and delivery with pressure on margins from new entrants.
Fair Isaac Corporation
- Operates in niche analytics with strong positioning but faces disruption from AI-driven competitors.
2. Capital Structure & Debt
Uber Technologies, Inc.
- Maintains moderate leverage with debt-to-assets at 22%, manageable interest coverage at 8.9x.
Fair Isaac Corporation
- Exhibits high debt-to-assets at 165%, raising red flags despite good interest coverage of 7x.
3. Stock Volatility
Uber Technologies, Inc.
- Beta at 1.20 suggests moderate volatility aligned with tech sector benchmarks.
Fair Isaac Corporation
- Slightly higher beta at 1.29 indicates above-average stock price swings.
4. Regulatory & Legal
Uber Technologies, Inc.
- Faces ongoing regulatory challenges in multiple geographies impacting operational flexibility.
Fair Isaac Corporation
- Regulatory risks are lower but subject to data privacy and financial compliance scrutiny.
5. Supply Chain & Operations
Uber Technologies, Inc.
- Operational complexity across mobility, delivery, and freight segments increases supply chain risks.
Fair Isaac Corporation
- Less exposed to physical supply chain risks; operational risks center on software delivery and data integrity.
6. ESG & Climate Transition
Uber Technologies, Inc.
- Under pressure to reduce emissions and improve driver welfare amid growing ESG investor demands.
Fair Isaac Corporation
- ESG risks are primarily related to data ethics and sustainable software development practices.
7. Geopolitical Exposure
Uber Technologies, Inc.
- Global footprint exposes it to geopolitical tensions and regulatory divergence.
Fair Isaac Corporation
- More concentrated operations reduce geopolitical risk but still face global market uncertainties.
Which company shows a better risk-adjusted profile?
Uber’s greatest risk lies in regulatory and operational complexity that could pressure margins and growth. Fair Isaac’s precarious capital structure, marked by excessive debt, threatens financial stability despite strong operating performance. Uber presents a more balanced risk profile, supported by a safer debt level and moderate volatility. Recently, Uber’s interest coverage ratio at 8.9x highlights its capacity to service debt comfortably, unlike Fair Isaac’s strained leverage. I find Uber better positioned to manage 2026’s market uncertainties with a more prudent financial foundation.
Final Verdict: Which stock to choose?
Uber Technologies, Inc. impresses with its unmatched operational efficiency and rapid profit growth, transforming losses into strong net margins. Its main point of vigilance remains the moderate return on invested capital, which currently trails its cost of capital. Uber fits well in an aggressive growth portfolio seeking high upside with manageable financial risks.
Fair Isaac Corporation commands a durable strategic moat through its high return on invested capital and robust profitability in the analytics software space. Compared to Uber, FICO offers better capital efficiency but carries a higher leverage risk and valuation premium. It suits a GARP investor seeking stability combined with quality growth.
If you prioritize operational momentum and accelerating profitability, Uber presents a compelling scenario due to its improving income profile and market traction. However, if you seek durable competitive advantage with superior capital returns and a more conservative risk profile, Fair Isaac outshines as the better fit. Both demand careful risk calibration given their distinct profiles and market dynamics.
Disclaimer: Investment carries a risk of loss of initial capital. The past performance is not a reliable indicator of future results. Be sure to understand risks before making an investment decision.
Go Further
I encourage you to read the complete analyses of Uber Technologies, Inc. and Fair Isaac Corporation to enhance your investment decisions: