Home > Comparison > Technology > FICO vs TYL
The strategic rivalry between Fair Isaac Corporation and Tyler Technologies defines the current trajectory in the Technology sector’s software application industry. Fair Isaac Corporation operates as a specialized analytics and decision management software provider, while Tyler Technologies delivers integrated public sector information management solutions. This head-to-head contrasts focused innovation versus broad market presence. This analysis will determine which company’s corporate trajectory offers the superior risk-adjusted outlook for a diversified portfolio.

Table of contents
Companies Overview
Fair Isaac Corporation and Tyler Technologies, Inc. are pivotal players in the software application market with distinct public sector and analytics strengths.
Fair Isaac Corporation: Analytics Powerhouse
Fair Isaac Corporation dominates the analytic and decision management software space. It generates revenue through its Scores and Software segments, offering credit scoring and decision automation solutions globally. In 2026, it strategically focuses on enhancing its modular FICO Platform to support advanced analytics and broaden its client customization capabilities.
Tyler Technologies, Inc.: Public Sector Innovator
Tyler Technologies leads in integrated public sector software solutions. Its revenue stems from enterprise software, appraisal and tax, and judicial systems, serving government agencies and schools. The company prioritizes cloud collaboration with Amazon Web Services to improve scalability and service delivery for its extensive public sector client base in 2026.
Strategic Collision: Similarities & Divergences
Both firms emphasize software-driven decision support but diverge in target markets—Fair Isaac focuses on financial analytics while Tyler targets public administration. Their competition centers on software adaptability and client integration capabilities. Fair Isaac presents a high-margin analytics model, whereas Tyler offers diversified public sector solutions, reflecting distinct risk-return profiles for investors.
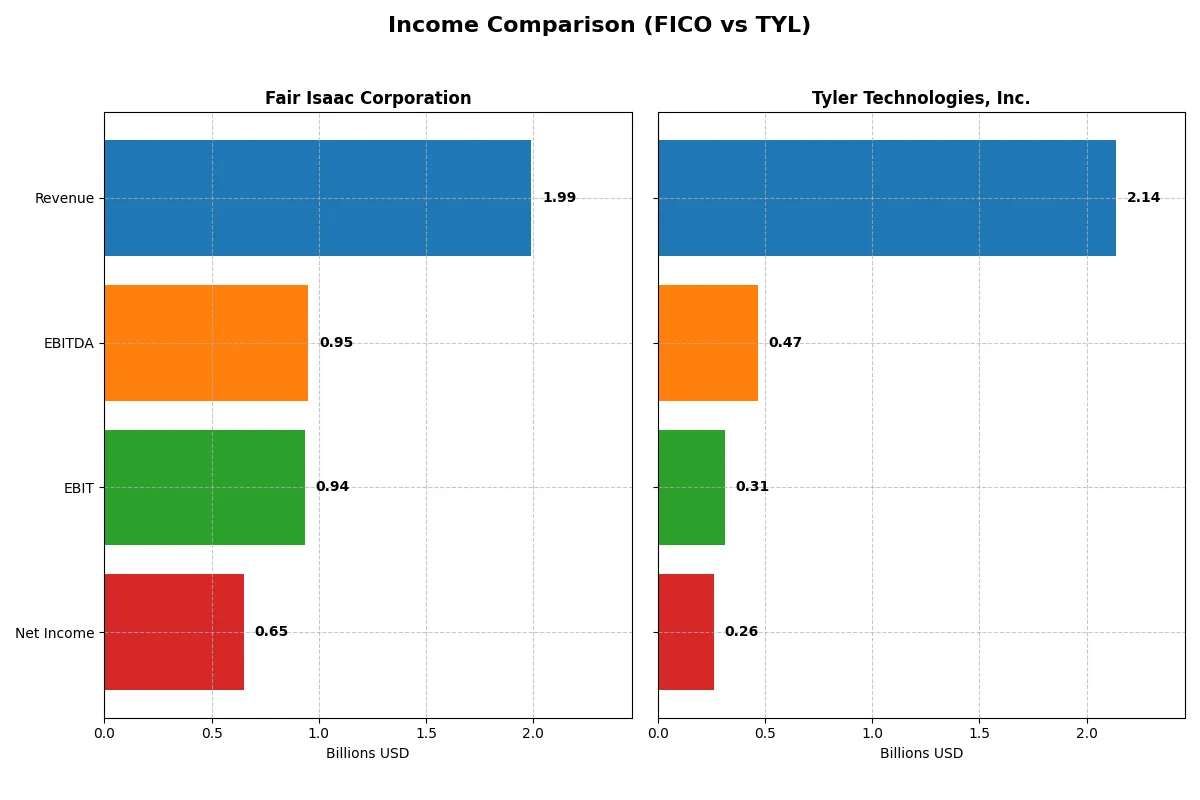
Income Statement Comparison
This data dissects the core profitability and scalability of both corporate engines to reveal who dominates the bottom line:
| Metric | Fair Isaac Corporation (FICO) | Tyler Technologies, Inc. (TYL) |
|---|---|---|
| Revenue | 1.99B | 2.14B |
| Cost of Revenue | 354M | 1.26B |
| Operating Expenses | 712M | 577M |
| Gross Profit | 1.64B | 876M |
| EBITDA | 951M | 466M |
| EBIT | 936M | 314M |
| Interest Expense | 134M | 6M |
| Net Income | 652M | 263M |
| EPS | 26.9 | 6.17 |
| Fiscal Year | 2025 | 2024 |
Income Statement Analysis: The Bottom-Line Duel
This income statement comparison exposes which company converts revenue into profit most efficiently, revealing the strength of their operational engines.
Fair Isaac Corporation Analysis
Fair Isaac’s revenue climbed from 1.3B in 2021 to nearly 2B in 2025, with net income soaring from 392M to 652M. Gross margins remain robust above 82%, and net margins expanded to 32.75%. The 2025 results highlight accelerating profitability and operational leverage, with EBIT growing 25.2% year-over-year, underscoring strong margin momentum.
Tyler Technologies, Inc. Analysis
Tyler’s revenue nearly doubled from 1.1B in 2020 to 2.1B in 2024, while net income increased more modestly from 195M to 263M. Gross margin sits at 41%, with net margin of 12.3%. Despite strong revenue growth and a 41.6% EBIT surge in 2024, margin compression over the longer term signals cost pressures limiting bottom-line efficiency.
Margin Dominance vs. Top-Line Expansion
Fair Isaac clearly leads in profitability and margin health, converting revenue into cash more effectively than Tyler. Tyler excels in top-line growth but struggles to maintain margin gains, reducing net income growth pace. Investors seeking steady, high-margin profit growth will find Fair Isaac’s profile more compelling.
Financial Ratios Comparison
These vital ratios act as a diagnostic tool to expose the underlying fiscal health, valuation premiums, and capital efficiency of the companies analyzed:
| Ratios | Fair Isaac Corporation (FICO) | Tyler Technologies, Inc. (TYL) |
|---|---|---|
| ROE | -37.3% | 7.76% |
| ROIC | 52.96% | 6.20% |
| P/E | 55.6 | 93.4 |
| P/B | -20.8 | 7.25 |
| Current Ratio | 0.83 | 1.35 |
| Quick Ratio | 0.83 | 1.35 |
| D/E (Debt/Equity) | -1.76 | 0.19 |
| Debt-to-Assets | 164.6% | 12.3% |
| Interest Coverage | 6.92 | 50.5 |
| Asset Turnover | 1.07 | 0.41 |
| Fixed Asset Turnover | 21.2 | 10.95 |
| Payout Ratio | 0 | 0 |
| Dividend Yield | 0 | 0 |
| Fiscal Year | 2025 | 2024 |
Efficiency & Valuation Duel: The Vital Signs
Financial ratios serve as a company’s DNA, uncovering hidden risks and operational strengths critical for investment insights.
Fair Isaac Corporation
Fair Isaac posts a strong net margin of 32.75%, signaling robust profitability, yet its ROE is deeply negative at -37.34%, reflecting shareholder equity challenges. The P/E ratio at 55.64 marks the stock as expensive, despite a favorable ROIC of 52.96%. The company pays no dividends, reinvesting heavily in R&D to fuel growth.
Tyler Technologies, Inc.
Tyler delivers a modest net margin of 12.3% with a positive but low ROE of 7.76%, indicating limited shareholder returns. Its P/E ratio stands at 93.42, suggesting a stretched valuation. The company also yields no dividends, focusing on steady reinvestment in operations and maintaining a strong interest coverage ratio of 52.96.
Premium Valuation vs. Operational Safety
Both companies show slightly favorable overall ratios but carry distinct risks. Fair Isaac combines operational efficiency with expensive valuation and equity strain, while Tyler’s stretched valuation contrasts with safer debt metrics. Investors seeking growth with operational resilience may prefer Fair Isaac; those cautious about leverage might lean toward Tyler.
Which one offers the Superior Shareholder Reward?
Fair Isaac Corporation (FICO) and Tyler Technologies, Inc. (TYL) both skip dividends, focusing on reinvestment and buybacks. FICO delivers high free cash flow per share (~$32 in 2025) and operates with near-zero dividend payout, fueling aggressive buybacks. Tyler posts lower free cash flow (~$14) but maintains moderate buybacks and robust cash reserves ($18/share in 2024). FICO’s distribution relies on capital-light efficiency and high operating margins (46%), supporting sustainable buybacks. Tyler’s model leans on steady growth with a solid balance sheet but thinner margins (14%). I find FICO offers superior total shareholder returns in 2026 due to its scalable cash conversion and intense buyback strategy, which historically correlates with outperformance in tech sectors. Tyler is more conservative, risking slower capital return but lower volatility.
Comparative Score Analysis: The Strategic Profile
The radar chart reveals the fundamental DNA and trade-offs shaping Fair Isaac Corporation and Tyler Technologies, Inc.:
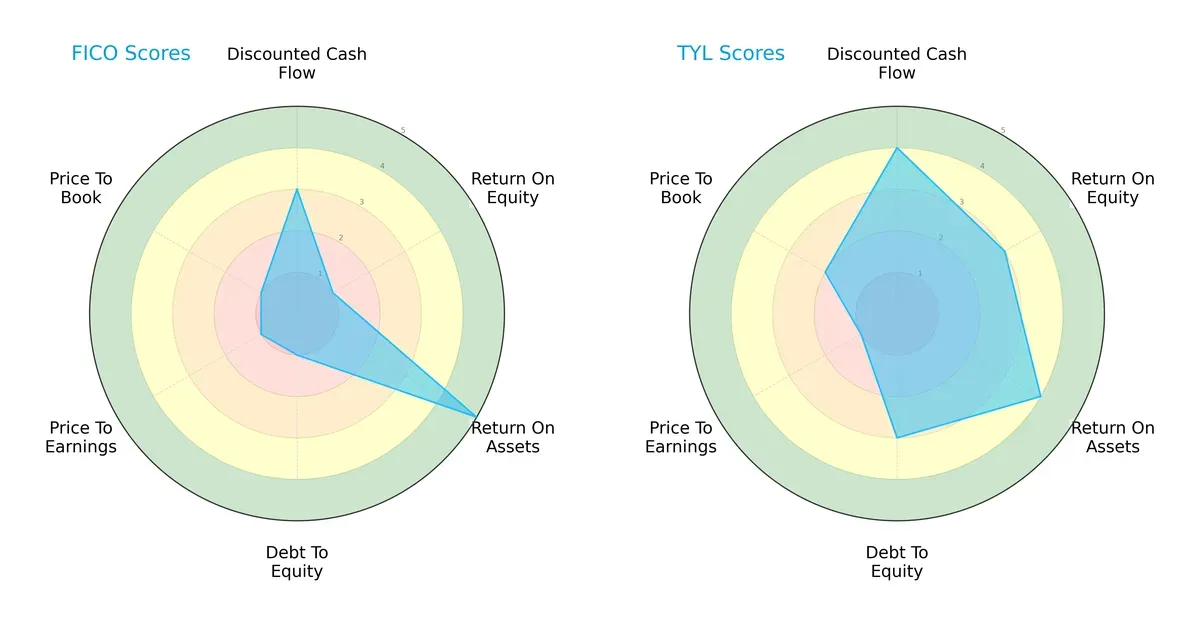
Fair Isaac Corporation shows a polarized profile with strong asset efficiency (ROA 5) but weak equity returns (ROE 1) and heavy financial leverage (Debt/Equity 1). Tyler Technologies delivers a more balanced scorecard, excelling in discounted cash flow (DCF 4), profitability (ROE 3, ROA 4), and maintaining moderate leverage (Debt/Equity 3). Tyler’s diversified strengths suggest a resilient business model, while Fair Isaac leans heavily on asset productivity, exposing it to risks if leverage costs rise.
Bankruptcy Risk: Solvency Showdown
Fair Isaac’s Altman Z-Score of 12.2 versus Tyler’s 7.1 confirms both firms operate safely above distress thresholds, but Fair Isaac holds a commanding margin of solvency:
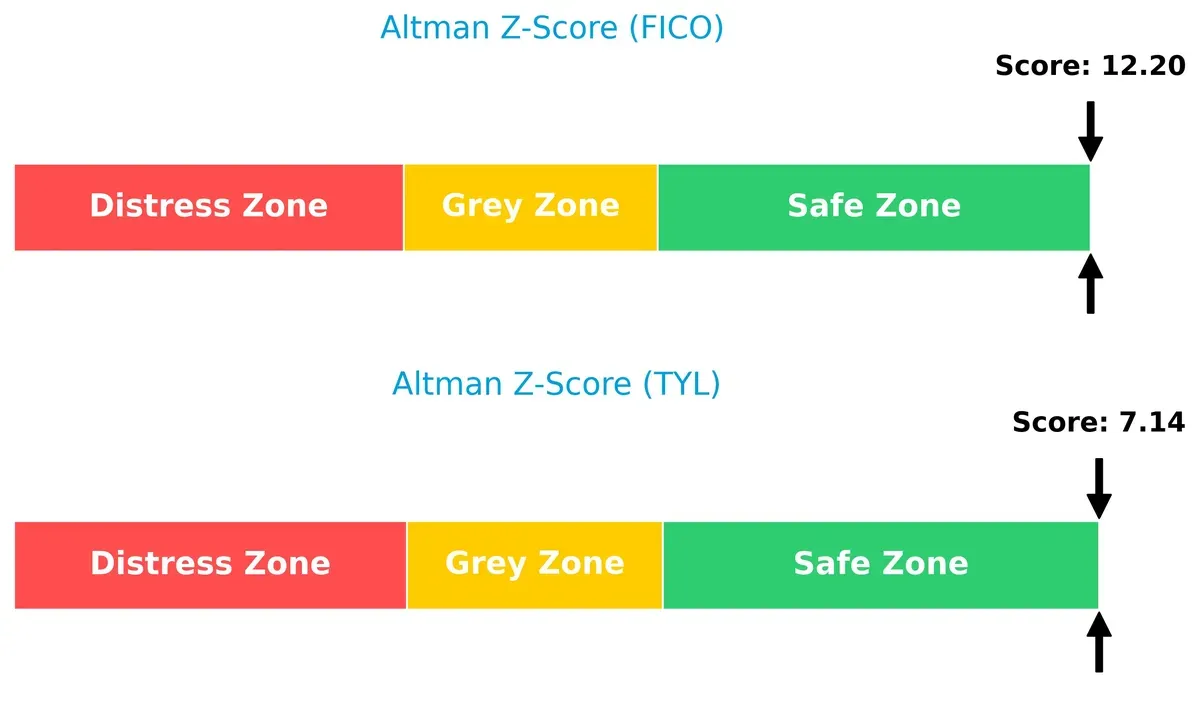
This wide delta signals Fair Isaac’s superior buffer against economic downturns. Historically, such a cushion allows strategic flexibility and lowers default risk, critical in volatile cycles. Tyler remains safe but with less margin for error, implying closer monitoring is warranted.
Financial Health: Quality of Operations
Fair Isaac’s Piotroski F-Score of 7 surpasses Tyler’s 6, highlighting stronger operational quality and financial discipline:
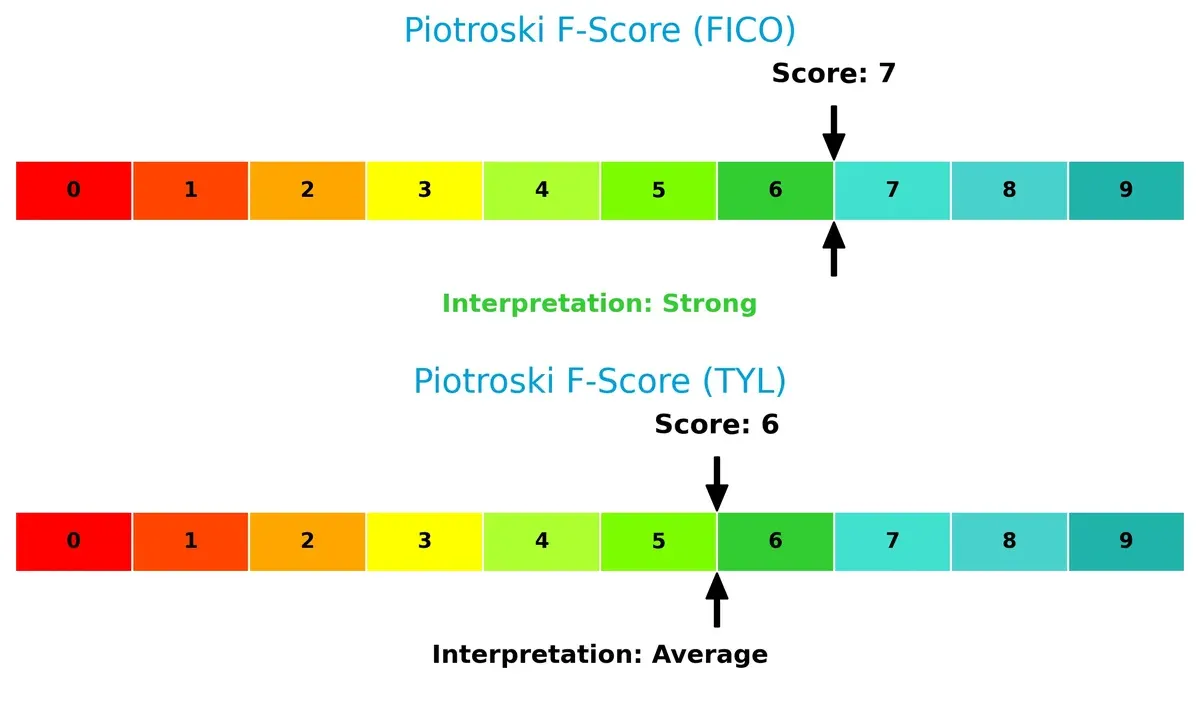
Scores near 7 indicate robust profitability, liquidity, and efficiency metrics. While both firms demonstrate solid fundamentals, Tyler’s average score suggests potential internal weaknesses or less consistent execution. Investors should weigh these nuances when assessing long-term financial resilience.
How are the two companies positioned?
This section dissects the operational DNA of Fair Isaac Corporation and Tyler Technologies by comparing their revenue distribution and internal dynamics. The goal is to confront their economic moats and reveal which model offers the most resilient, sustainable competitive advantage today.
Revenue Segmentation: The Strategic Mix
This visual comparison dissects how Fair Isaac Corporation and Tyler Technologies diversify their income streams and where their primary sector bets lie:
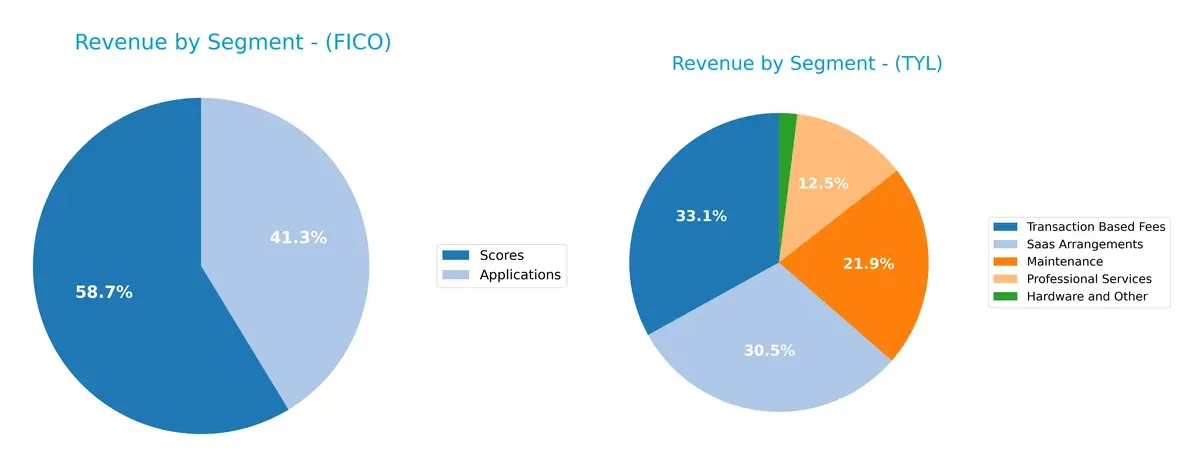
Fair Isaac Corporation anchors revenue in two segments: Scores at $1.17B and Applications at $822M in 2025. This concentration contrasts sharply with Tyler Technologies, which shows a highly diversified mix in 2024: Transaction Based Fees lead at $698M, followed by SaaS Arrangements ($645M), Maintenance ($463M), and Professional Services ($264M). Tyler’s breadth reduces concentration risk, while Fair Isaac’s focus on Scores signals reliance on proprietary data-driven solutions and ecosystem lock-in.
Strengths and Weaknesses Comparison
This table compares the Strengths and Weaknesses of Fair Isaac Corporation and Tyler Technologies, Inc.:
FICO Strengths
- Strong profitability with net margin of 32.75%
- High ROIC at 52.96% indicating efficient capital use
- Favorable asset turnover metrics
- Diverse product revenue in Applications and Scores segments
- Broad geographic presence with significant Americas revenue
TYL Strengths
- Favorable net margin at 12.3%
- Lower debt to assets ratio at 12.32% indicating financial stability
- Strong interest coverage ratio of 52.96
- Revenue diversification across multiple software and service segments
- Favorable current and quick ratios
FICO Weaknesses
- Negative ROE at -37.34%, reflecting shareholder returns challenges
- High debt to assets at 164.6% poses leverage risk
- Current ratio below 1 indicates liquidity concerns
- Unfavorable P/E of 55.64 suggests high valuation
- No dividend yield
TYL Weaknesses
- ROE at 7.76% still below ideal benchmark
- Unfavorable P/E of 93.42 reflects stretched valuation
- Lower asset turnover at 0.41 suggests less efficient asset use
- No dividend yield
- Unfavorable PB ratio of 7.25
FICO’s strengths lie in superior profitability and capital efficiency but face leverage and liquidity risks. Tyler shows financial stability and revenue diversification but struggles with valuation and asset efficiency. Each company’s profile suggests distinct strategic priorities.
The Moat Duel: Analyzing Competitive Defensibility
A structural moat is the only durable defense preserving long-term profits from relentless competitive pressure. Let’s dissect the true sources of advantage for these firms:
Fair Isaac Corporation (FICO): Data-Driven Decision-Making Moat
FICO’s moat stems from its proprietary analytics and scoring algorithms, creating high switching costs. This manifests in robust 47% EBIT margins and a soaring ROIC that outpaces WACC by 44%. In 2026, expanding SaaS offerings and global data integration could deepen this advantage.
Tyler Technologies, Inc. (TYL): Public Sector Integration Moat
TYL’s moat builds on deep integration with public sector workflows, contrasting FICO’s data focus. Yet its ROIC lags below WACC, signaling value erosion. Opportunities lie in cloud migration and judicial software expansion, but profitability deterioration poses risks.
Verdict: Proprietary Analytics vs. Workflow Integration
FICO’s wider, growing moat driven by superior capital efficiency and margin stability clearly outmatches TYL’s shrinking competitive edge. FICO stands better poised to defend and extend its market share in 2026 and beyond.
Which stock offers better returns?
The past year reveals contrasting trajectories for Fair Isaac Corporation and Tyler Technologies, Inc., with FICO showing overall gains despite recent setbacks, while TYL experiences a persistent decline.
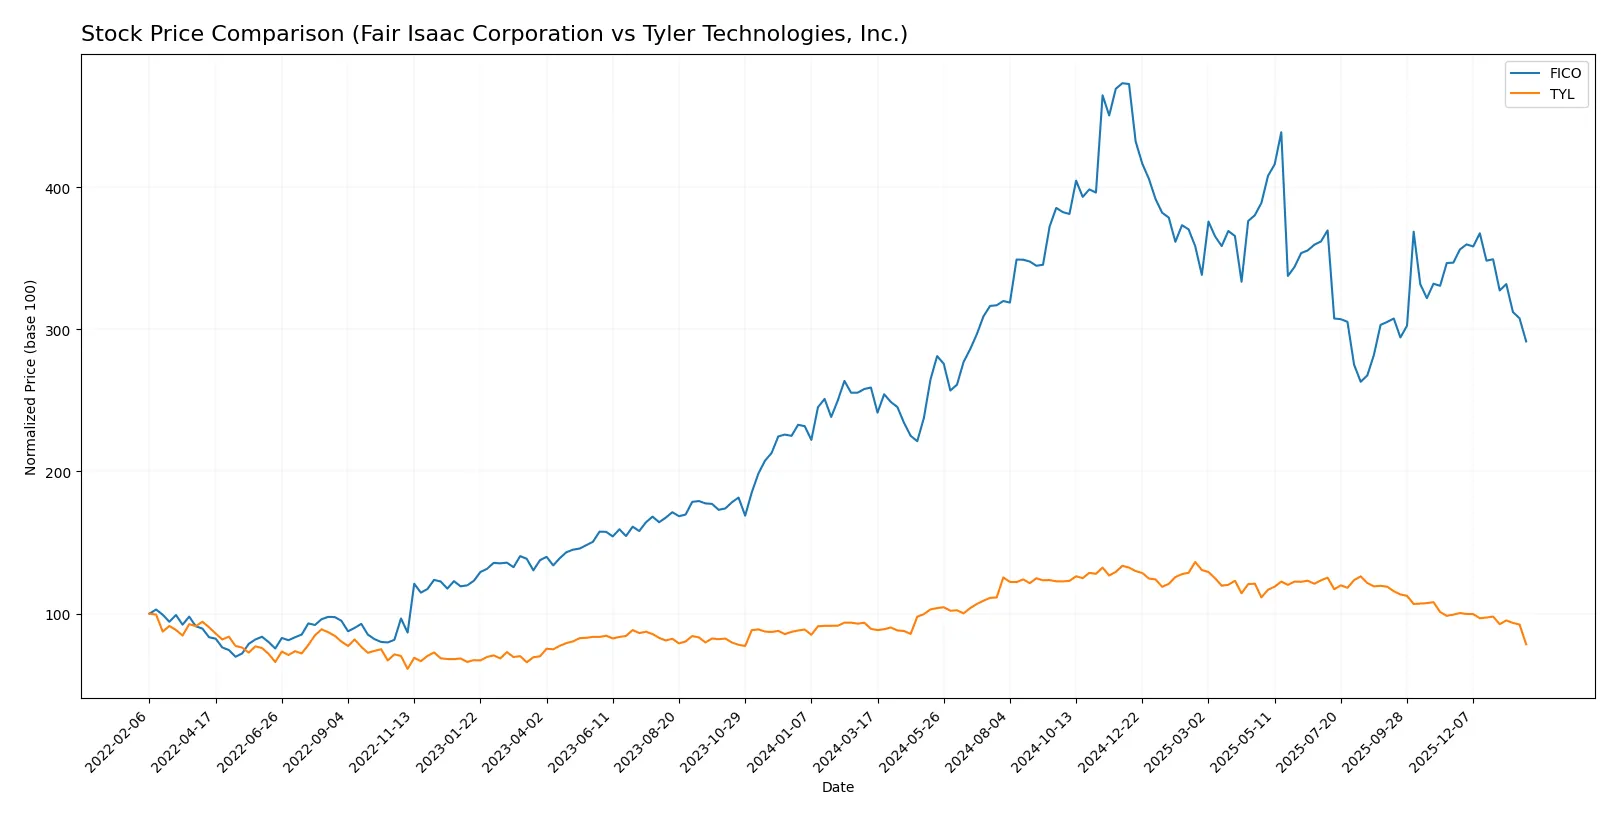
Trend Comparison
Fair Isaac Corporation’s stock rose 12.51% over the past 12 months, marking a bullish trend with decelerating momentum. It hit a high of 2375.03 and a low of 1110.85, but recent months show a sharp -15.98% drop.
Tyler Technologies, Inc. declined 12.15% in the same period, confirming a bearish trend with deceleration. The stock’s range was 369.4 to 641.7, and recent losses accelerated, with a -21.01% decrease over the last few months.
FICO outperformed TYL over the past year, delivering positive returns despite recent weakness. TYL’s consistent decline resulted in lower market performance compared to FICO.
Target Prices
Analysts present a bullish consensus for both Fair Isaac Corporation and Tyler Technologies, signaling upside potential from current levels.
| Company | Target Low | Target High | Consensus |
|---|---|---|---|
| Fair Isaac Corporation | 1,640 | 2,400 | 2,115 |
| Tyler Technologies, Inc. | 470 | 675 | 574 |
The consensus targets sit well above Fair Isaac’s 1,463 current price and Tyler Technologies’ 369 price, reflecting strong expected appreciation. This gap suggests analysts anticipate continued growth and value creation for shareholders.

Don’t Let Luck Decide Your Entry Point
Optimize your entry points with our advanced ProRealTime indicators. You’ll get efficient buy signals with precise price targets for maximum performance. Start outperforming now!
How do institutions grade them?
Fair Isaac Corporation Grades
The following table summarizes recent grades from established grading firms for Fair Isaac Corporation.
| Grading Company | Action | New Grade | Date |
|---|---|---|---|
| Needham | Maintain | Buy | 2026-01-29 |
| Jefferies | Maintain | Buy | 2026-01-16 |
| Wells Fargo | Maintain | Overweight | 2026-01-14 |
| JP Morgan | Maintain | Neutral | 2025-11-06 |
| Baird | Maintain | Outperform | 2025-11-06 |
| Jefferies | Maintain | Buy | 2025-11-06 |
| BMO Capital | Maintain | Outperform | 2025-11-06 |
| Wells Fargo | Maintain | Overweight | 2025-10-14 |
| Barclays | Maintain | Overweight | 2025-10-02 |
| Needham | Maintain | Buy | 2025-10-02 |
Tyler Technologies, Inc. Grades
Below are the most recent grades assigned by credible grading companies for Tyler Technologies, Inc.
| Grading Company | Action | New Grade | Date |
|---|---|---|---|
| Oppenheimer | Maintain | Outperform | 2026-01-23 |
| Piper Sandler | Maintain | Overweight | 2026-01-13 |
| Wells Fargo | Maintain | Equal Weight | 2026-01-08 |
| DA Davidson | Maintain | Neutral | 2025-12-09 |
| DA Davidson | Maintain | Neutral | 2025-10-31 |
| Evercore ISI Group | Maintain | In Line | 2025-10-31 |
| DA Davidson | Maintain | Neutral | 2025-10-10 |
| DA Davidson | Maintain | Neutral | 2025-08-05 |
| Barclays | Maintain | Overweight | 2025-07-31 |
| Needham | Maintain | Buy | 2025-05-13 |
Which company has the best grades?
Fair Isaac Corporation consistently receives Buy and Outperform grades, indicating stronger analyst confidence. Tyler Technologies shows more Neutral and Equal Weight ratings, suggesting cautious sentiment. This difference may influence investor perception and portfolio positioning.
Risks specific to each company
The following categories identify critical pressure points and systemic threats facing Fair Isaac Corporation and Tyler Technologies in the 2026 market environment:
1. Market & Competition
Fair Isaac Corporation
- Faces intense competition in analytics software; innovation pace demands constant upgrades.
Tyler Technologies, Inc.
- Operates in public sector software niche; competition from larger ERP vendors and cloud disruptors.
2. Capital Structure & Debt
Fair Isaac Corporation
- Debt-to-assets ratio is precariously high at 165%, signaling heavy leverage risk.
Tyler Technologies, Inc.
- Maintains conservative debt levels with 12% debt-to-assets, reflecting financial prudence.
3. Stock Volatility
Fair Isaac Corporation
- Beta at 1.29 indicates higher volatility than market average, increasing investment risk.
Tyler Technologies, Inc.
- Beta of 0.92 shows below-market volatility, suggesting steadier price movements.
4. Regulatory & Legal
Fair Isaac Corporation
- Exposure to global data privacy laws could impact operations across multiple jurisdictions.
Tyler Technologies, Inc.
- Subject to public sector compliance and procurement regulations, with moderate legal risk.
5. Supply Chain & Operations
Fair Isaac Corporation
- Relies on cloud infrastructure and data partners; any disruptions could degrade service quality.
Tyler Technologies, Inc.
- Strategic AWS partnership reduces cloud risk but depends on third-party vendors for system integration.
6. ESG & Climate Transition
Fair Isaac Corporation
- ESG initiatives not prominently disclosed, potentially a reputational and compliance risk.
Tyler Technologies, Inc.
- Increasing focus on sustainability in public sector software may boost future resilience.
7. Geopolitical Exposure
Fair Isaac Corporation
- Operates globally, exposing it to geopolitical tensions and trade restrictions.
Tyler Technologies, Inc.
- Primarily US-focused, limiting exposure but sensitive to domestic political shifts.
Which company shows a better risk-adjusted profile?
Fair Isaac’s most impactful risk is its extreme leverage, threatening solvency under downturns. Tyler faces moderate competitive pressure but benefits from a solid balance sheet and lower volatility. Tyler’s safer capital structure and stable stock performance give it a superior risk-adjusted profile. Notably, Fair Isaac’s debt-to-assets ratio at 165% demands caution despite its strong operating metrics.
Final Verdict: Which stock to choose?
Fair Isaac Corporation (FICO) stands out with its powerful value creation engine. Its superpower lies in generating returns on invested capital far above its cost of capital, signaling a durable competitive advantage. However, its low current ratio is a point of vigilance, reflecting potential short-term liquidity strains. FICO fits well in aggressive growth portfolios seeking high profitability with some risk tolerance.
Tyler Technologies, Inc. (TYL) leverages a strategic moat rooted in steady government software contracts, offering recurring revenue safety. It exhibits a stronger balance sheet and better liquidity than FICO, presenting a safer profile. TYL suits investors aiming for growth at a reasonable price, favoring stability over explosive returns.
If you prioritize durable value creation and high return on capital, FICO is the compelling choice due to its superior profitability and moat strength. However, if you seek stability and recurring revenue with a more conservative risk profile, TYL offers better safety and steady growth potential. Both appeal to distinct investor avatars, demanding careful alignment with individual risk tolerance and strategy.
Disclaimer: Investment carries a risk of loss of initial capital. The past performance is not a reliable indicator of future results. Be sure to understand risks before making an investment decision.
Go Further
I encourage you to read the complete analyses of Fair Isaac Corporation and Tyler Technologies, Inc. to enhance your investment decisions: