Home > Comparison > Technology > MSTR vs FICO
The strategic rivalry between Strategy Inc and Fair Isaac Corporation defines the current trajectory of the technology sector. Strategy Inc operates as a bitcoin treasury and AI-powered analytics provider, while Fair Isaac Corporation excels in analytic software and decision management solutions. This head-to-head pits innovative digital asset exposure against established software leadership. This analysis will determine which company offers a superior risk-adjusted outlook for a diversified portfolio in today’s evolving tech landscape.
Table of contents
Companies Overview
Strategy Inc and Fair Isaac Corporation stand as pivotal players shaping the software application market.
Strategy Inc: Bitcoin Treasury & AI Analytics Leader
Strategy Inc defines itself as a bitcoin treasury company while also delivering AI-powered enterprise analytics software. Its core revenue stems from offering investors economic exposure to Bitcoin via equity and fixed income securities. In 2025, it sharpened its strategic focus on blending cryptocurrency asset management with advanced AI analytics platforms like Strategy One and Mosaic.
Fair Isaac Corporation: Decision Analytics Innovator
Fair Isaac Corporation operates primarily in analytic software and data management, enabling automated decision-making across industries. It drives revenue through two segments: Scores and Software, offering business and consumer scoring solutions plus a modular decision platform. The company emphasizes expanding its software ecosystem and decision automation capabilities to deepen client integration in 2026.
Strategic Collision: Similarities & Divergences
Both companies compete within the software application industry but adopt divergent business philosophies. Strategy Inc embraces a hybrid model of cryptocurrency exposure combined with AI analytics, while Fair Isaac Corporation pursues an open software infrastructure focused on decision automation. Their primary battleground lies in delivering actionable insights to enterprises. These contrasting models create distinct investment profiles balancing innovation risk with steady software demand.
Income Statement Comparison
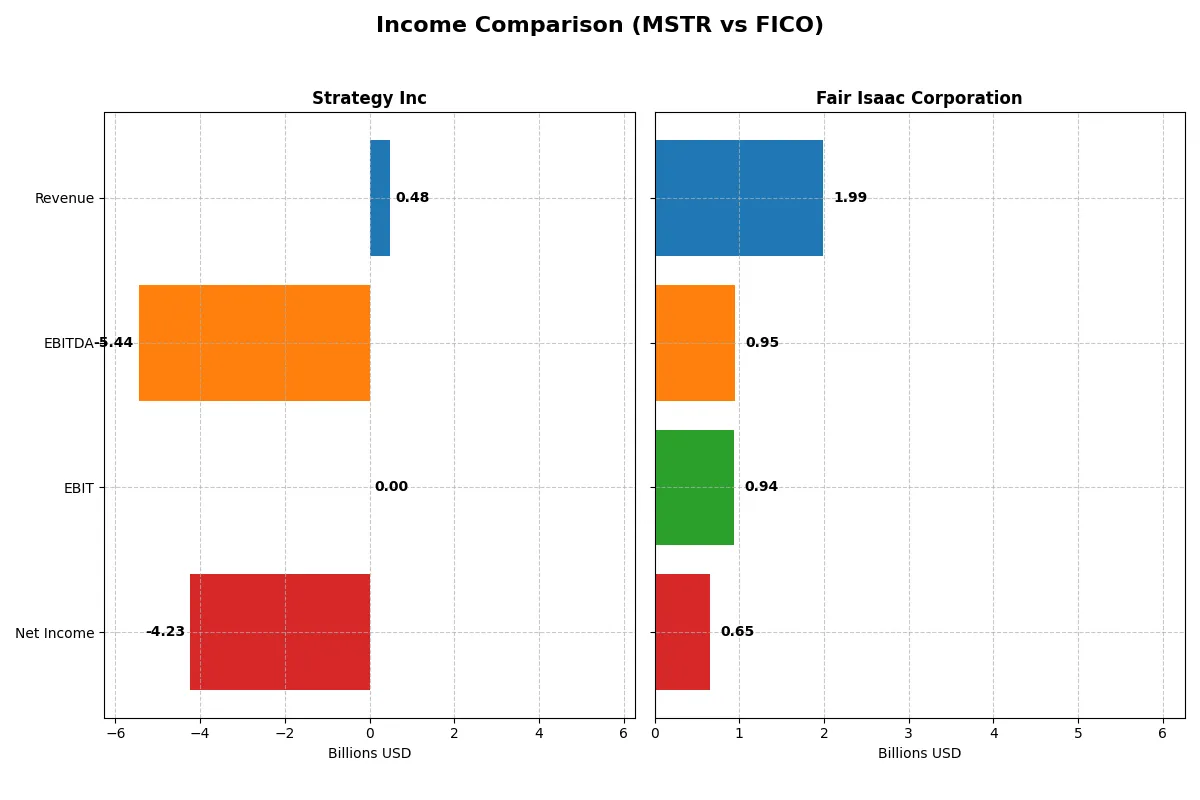
The following data dissects the core profitability and scalability of both corporate engines to reveal who dominates the bottom line:
| Metric | Strategy Inc (MSTR) | Fair Isaac Corporation (FICO) |
|---|---|---|
| Revenue | 477M | 1.99B |
| Cost of Revenue | 149M | 354M |
| Operating Expenses | 5.62B | 712M |
| Gross Profit | 328M | 1.64B |
| EBITDA | -5.44B | 951M |
| EBIT | 0 | 936M |
| Interest Expense | 65M | 134M |
| Net Income | -4.23B | 652M |
| EPS | -15.23 | 26.9 |
| Fiscal Year | 2025 | 2025 |
Income Statement Analysis: The Bottom-Line Duel
This income statement comparison reveals which company operates with superior efficiency and bottom-line strength amid their distinct business cycles.
Strategy Inc Analysis
Strategy Inc’s revenue held steady around $477M in 2025 but plunged into a $4.2B net loss, reflecting severe operational challenges. Its gross margin remains favorable at 68.7%, yet net margins collapse to -886%, signaling deep inefficiencies and heavy other expenses eroding profits. Recent years show declining revenue and expanding losses, undermining momentum.
Fair Isaac Corporation Analysis
Fair Isaac Corporation’s revenue grew robustly to $2B in 2025, paired with a strong $652M net income and a stellar 32.8% net margin. Gross margins exceed 82%, while EBIT margin impresses at 47%. The company demonstrates consistent top-line growth and margin expansion, indicating effective capital allocation and operational scalability.
Margin Strength vs. Revenue Resilience
Fair Isaac Corporation clearly outperforms Strategy Inc in profitability and growth metrics. Strategy Inc struggles with sustained losses despite stable revenue, whereas Fair Isaac delivers expanding revenues and healthy profits. For investors, Fair Isaac’s profile of scalable margins and growth offers a fundamentally more attractive risk-return balance.
Financial Ratios Comparison
These vital ratios act as a diagnostic tool to expose the underlying fiscal health, valuation premiums, and capital efficiency of the companies analyzed:
| Ratios | Strategy Inc (MSTR) | Fair Isaac Corporation (FICO) |
|---|---|---|
| ROE | -6.40% | -37.34% |
| ROIC | -4.38% | 52.96% |
| P/E | -47.80 | 55.64 |
| P/B | 3.06 | -20.78 |
| Current Ratio | 0.71 | 0.83 |
| Quick Ratio | 0.71 | 0.83 |
| D/E (Debt-to-Equity) | 0.40 | -1.76 |
| Debt-to-Assets | 28.09% | 164.60% |
| Interest Coverage | -29.92 | 6.92 |
| Asset Turnover | 0.02 | 1.07 |
| Fixed Asset Turnover | 5.73 | 21.20 |
| Payout ratio | 0 | 0 |
| Dividend yield | 0 | 0 |
| Fiscal Year | 2024 | 2025 |
Efficiency & Valuation Duel: The Vital Signs
Financial ratios act as a company’s DNA, unveiling hidden risks and highlighting operational excellence beyond surface-level numbers.
Strategy Inc
Strategy Inc shows weak profitability with a negative ROE of -6.4% and deeply unfavorable margins at -251.7%. The stock’s P/E ratio is negative, indicating losses, but the valuation appears favorable given market expectations. The company lacks dividends, instead investing heavily in R&D (25.6% of revenue), signaling a growth-focused reinvestment approach despite operational challenges.
Fair Isaac Corporation
Fair Isaac posts strong profitability with a 32.8% net margin and an impressive 53.0% ROIC, though its ROE is negative at -37.3%. The stock trades at a steep P/E of 55.6, reflecting premium pricing. It generates solid cash flows but pays no dividends, favoring reinvestment in R&D (9.5% of revenue) for long-term innovation and growth.
Premium Valuation vs. Operational Safety
Fair Isaac offers a better balance of profitability and operational efficiency despite its stretched valuation. Strategy Inc’s weak returns and unfavorable liquidity ratios present elevated risks. Investors seeking growth with operational soundness may lean toward Fair Isaac’s profile, while risk-tolerant investors might consider Strategy’s developmental gamble.
Which one offers the Superior Shareholder Reward?
I observe that neither Strategy Inc (MSTR) nor Fair Isaac Corporation (FICO) pays dividends, focusing instead on reinvestment and buybacks. MSTR shows negative free cash flow and no buyback activity, raising sustainability concerns. FICO generates strong free cash flow (~$31.8/share in 2025) and invests heavily in buybacks, enhancing shareholder value. Given FICO’s positive operating cash flow ratio (0.92) and robust margins, its capital allocation drives superior long-term returns. I conclude FICO offers the more attractive total return profile for 2026 investors.
Comparative Score Analysis: The Strategic Profile
The radar chart reveals the fundamental DNA and trade-offs of Strategy Inc and Fair Isaac Corporation, highlighting their core financial strengths and vulnerabilities:
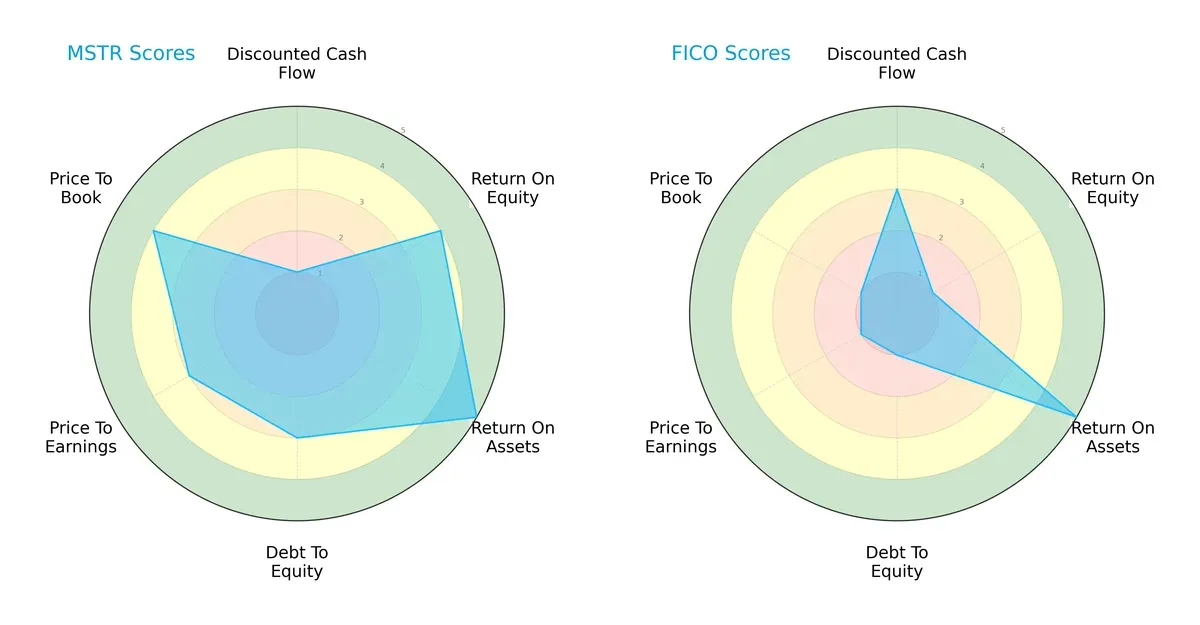
Strategy Inc shows a balanced profile with strong ROE (4) and ROA (5) scores, moderate debt (3), and favorable valuation metrics (PE 3, PB 4). In contrast, Fair Isaac Corporation leans on asset efficiency (ROA 5) but suffers from weak equity returns (ROE 1), high leverage risk (debt 1), and poor valuation scores (PE 1, PB 1). Strategy Inc’s diversified strengths suggest a sturdier foundation, while Fair Isaac depends heavily on asset utilization.
Bankruptcy Risk: Solvency Showdown
The Altman Z-Score gap signals markedly different solvency prospects:
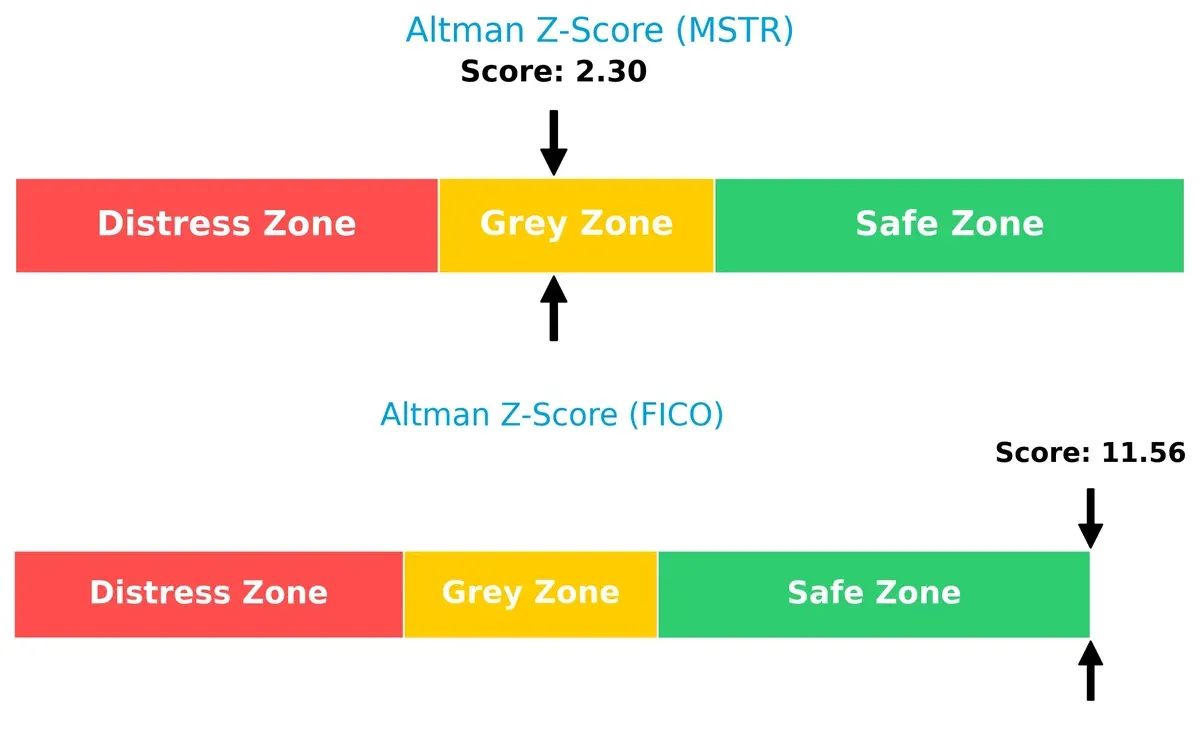
Strategy Inc’s score of 2.3 places it in the grey zone, indicating moderate bankruptcy risk amid economic uncertainty. Fair Isaac’s 11.6 score situates it firmly in the safe zone, reflecting robust financial stability and resilience through the cycle.
Financial Health: Quality of Operations
Piotroski F-Scores highlight operational quality and internal financial health:
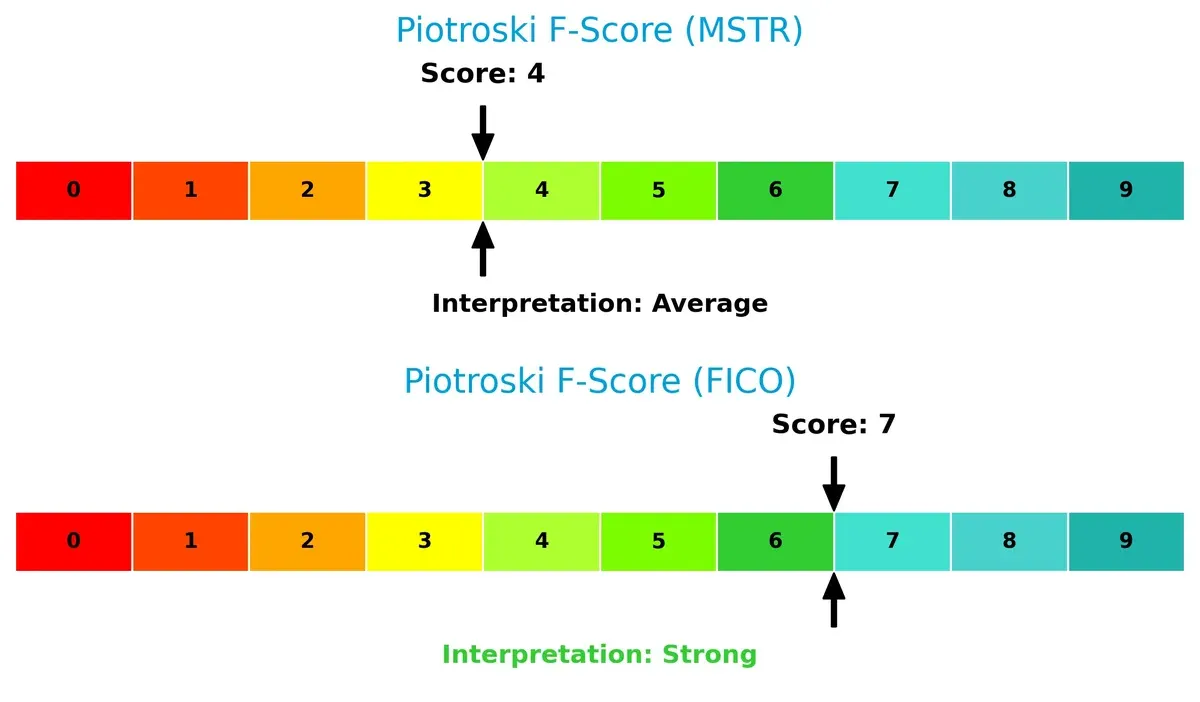
Fair Isaac leads with a strong 7, signaling solid profitability, liquidity, and efficiency. Strategy Inc’s average score of 4 raises caution, showing weaker internal metrics that warrant close monitoring. This gap suggests Fair Isaac maintains superior financial fundamentals despite its valuation and leverage concerns.
How are the two companies positioned?
This section dissects the operational DNA of Strategy Inc and Fair Isaac Corporation by comparing revenue distribution and internal dynamics. The goal is to confront their economic moats and reveal which model offers a more resilient, sustainable competitive advantage today.
Revenue Segmentation: The Strategic Mix
This visual comparison dissects how Strategy Inc and Fair Isaac Corporation diversify their income streams and where their primary sector bets lie:
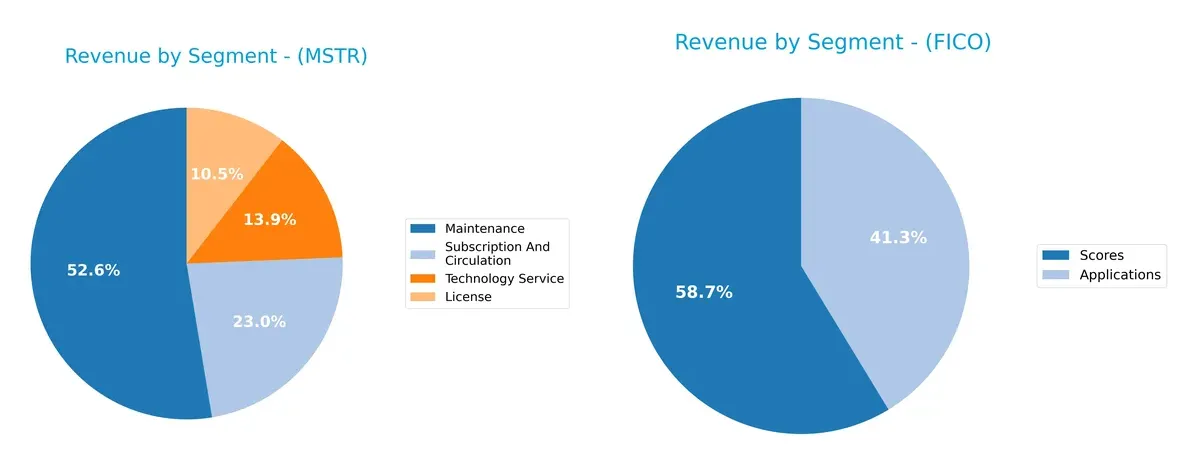
Strategy Inc anchors 2024 revenue in Maintenance at $244M, with Subscription ($107M) and Technology Service ($64M) providing balance. License lags at $49M, signaling moderate diversification but heavy reliance on recurring services. Fair Isaac Corporation pivots on two large segments: Scores at $1.17B dwarfs Applications at $822M, showing a strong focus on credit scoring. Strategy Inc’s mix suggests steady ecosystem lock-in, while Fair Isaac faces concentration risk but benefits from a dominant scoring franchise.
Strengths and Weaknesses Comparison
This table compares the Strengths and Weaknesses of Strategy Inc and Fair Isaac Corporation:
Strategy Inc Strengths
- Diversified revenue streams across License, Maintenance, Subscription, Technology Service
- Moderate debt-to-equity ratio at 0.4 supports financial stability
- Favorable fixed asset turnover at 5.73 indicates efficient asset use
Fair Isaac Corporation Strengths
- High net margin at 32.75% reflects strong profitability
- Exceptional ROIC at 52.96% outperforms WACC, signaling value creation
- Strong interest coverage at 7.01 supports debt servicing
- High asset turnover at 1.07 and fixed assets at 21.2 show operational efficiency
Strategy Inc Weaknesses
- Negative net margin (-251.73%) and ROE (-6.4%) reveal profitability issues
- Low liquidity ratios (current and quick at 0.71) raise short-term risk concerns
- Negative interest coverage implies weak earnings to cover interest expenses
- PB ratio above 3 signals potential overvaluation
Fair Isaac Corporation Weaknesses
- Negative ROE at -37.34% signals shareholder returns under pressure
- Debt-to-assets extremely high at 164.6% indicates leverage risk
- PE ratio at 55.64 suggests expensive valuation
- Current ratio below 1 (0.83) implies liquidity constraints
- Dividend yield at zero limits income appeal
Both companies show clear strengths in operational efficiency and some financial metrics. Strategy Inc faces serious profitability and liquidity challenges, while Fair Isaac Corporation balances strong profitability with elevated leverage and valuation risks. These contrasts highlight differing strategic priorities and financial health profiles.
The Moat Duel: Analyzing Competitive Defensibility
A structural moat stands as the only true shield protecting long-term profits from relentless competitive erosion:
Strategy Inc: Intangible Assets Powerhouse
Strategy Inc leverages unique AI-driven analytics and Bitcoin treasury exposure as its moat. This results in margin instability and negative net income, signaling vulnerability. Expansion into new AI markets in 2026 could deepen its moat, but risks remain high.
Fair Isaac Corporation: Data-Driven Network Effects
Fair Isaac harnesses powerful network effects through proprietary scoring and decision software. Its high ROIC and 47% EBIT margin reflect robust competitive positioning. Expanding global data services in 2026 should reinforce its moat and market leadership.
Intangible Assets vs. Network Effects: Moat Depth Showdown
Fair Isaac’s growing ROIC and stable profits reveal a wider, more sustainable moat than Strategy Inc’s volatile margins and declining returns. I see Fair Isaac better equipped to defend and expand its market share in 2026.
Which stock offers better returns?
The past year saw Strategy Inc’s shares decline sharply, while Fair Isaac Corporation posted gains but faced recent weakness. Both stocks experienced seller dominance late in the period.
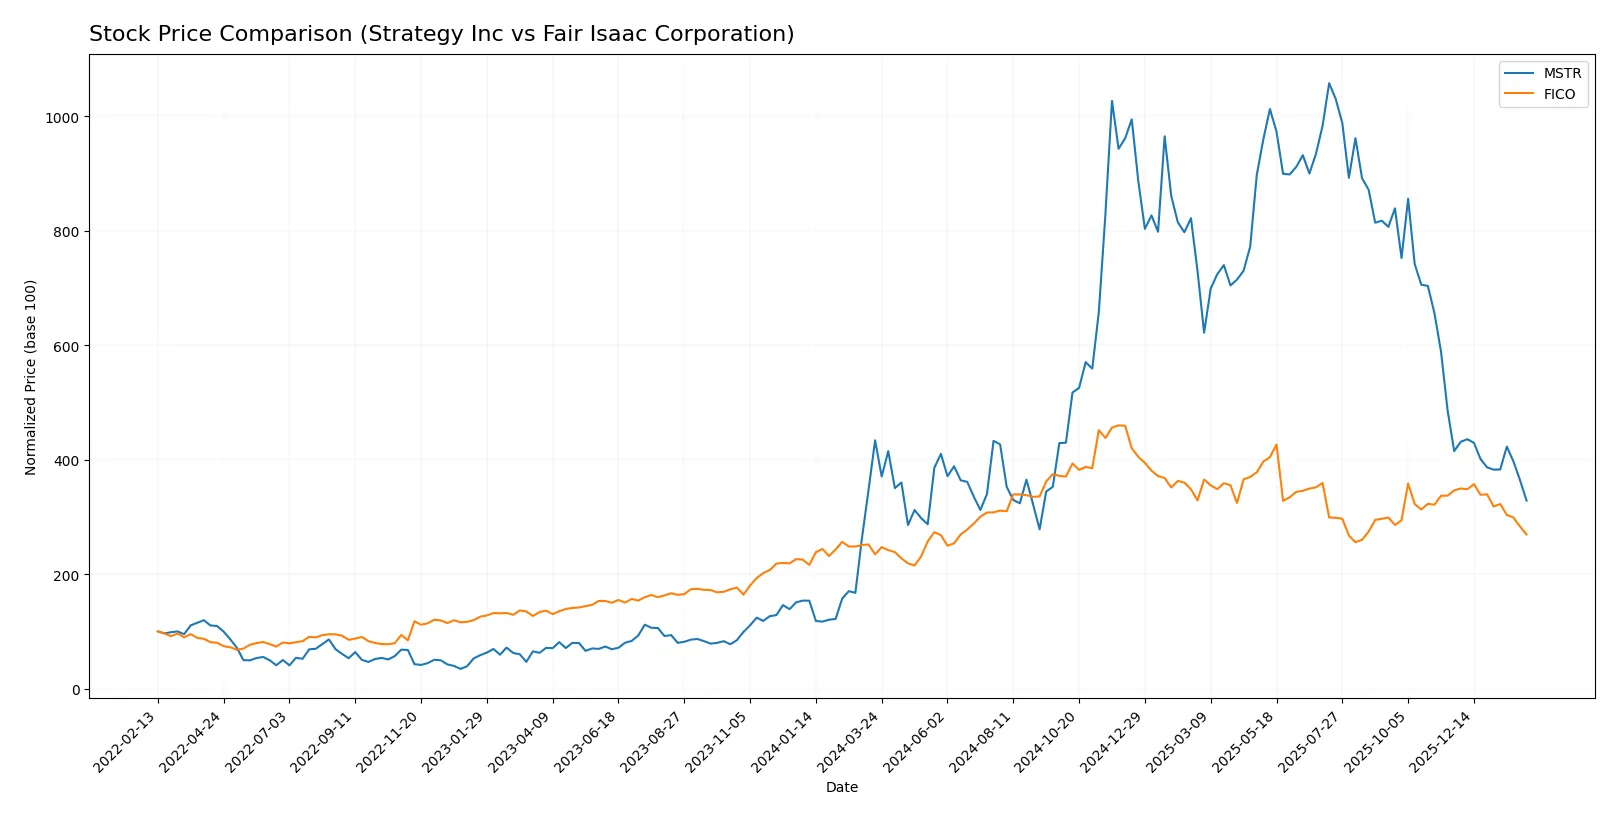
Trend Comparison
Strategy Inc’s stock dropped 24.3% over the past 12 months, marking a bearish trend with decelerating decline and a high volatility of 101.34. The price ranged between 114.3 and 434.58.
Fair Isaac Corporation gained 14.79% over the last year, reflecting a bullish trend with deceleration despite high volatility at 284.5. The stock traded between 1110.85 and 2375.03.
Fair Isaac Corporation outperformed Strategy Inc with a positive return versus a significant loss, despite both stocks showing seller dominance recently.
Target Prices
Analysts show a wide range of optimistic targets for Strategy Inc and Fair Isaac Corporation, signaling diverse growth expectations.
| Company | Target Low | Target High | Consensus |
|---|---|---|---|
| Strategy Inc | 175 | 705 | 374.5 |
| Fair Isaac Corporation | 1640 | 2400 | 2066.71 |
Strategy Inc’s consensus target of 374.5 is nearly three times its current price of 134.93, implying substantial upside potential. Fair Isaac’s consensus target of 2066.71 also exceeds its current price of 1391, reflecting solid analyst confidence.

Don’t Let Luck Decide Your Entry Point
Optimize your entry points with our advanced ProRealTime indicators. You’ll get efficient buy signals with precise price targets for maximum performance. Start outperforming now!
How do institutions grade them?
Strategy Inc Grades
The following table summarizes recent institutional grades for Strategy Inc:
| Grading Company | Action | New Grade | Date |
|---|---|---|---|
| BTIG | Maintain | Buy | 2026-02-06 |
| Canaccord Genuity | Maintain | Buy | 2026-02-04 |
| Mizuho | Maintain | Outperform | 2026-01-16 |
| TD Cowen | Maintain | Buy | 2026-01-15 |
| Citigroup | Maintain | Buy | 2025-12-22 |
| Bernstein | Maintain | Outperform | 2025-12-08 |
| Monness, Crespi, Hardt | Upgrade | Neutral | 2025-11-10 |
| Canaccord Genuity | Maintain | Buy | 2025-11-03 |
| HC Wainwright & Co. | Maintain | Buy | 2025-11-03 |
| TD Cowen | Maintain | Buy | 2025-10-31 |
Fair Isaac Corporation Grades
The following table summarizes recent institutional grades for Fair Isaac Corporation:
| Grading Company | Action | New Grade | Date |
|---|---|---|---|
| Goldman Sachs | Maintain | Buy | 2026-02-03 |
| Needham | Maintain | Buy | 2026-01-29 |
| Jefferies | Maintain | Buy | 2026-01-16 |
| Wells Fargo | Maintain | Overweight | 2026-01-14 |
| JP Morgan | Maintain | Neutral | 2025-11-06 |
| Baird | Maintain | Outperform | 2025-11-06 |
| Jefferies | Maintain | Buy | 2025-11-06 |
| BMO Capital | Maintain | Outperform | 2025-11-06 |
| Wells Fargo | Maintain | Overweight | 2025-10-14 |
| Barclays | Maintain | Overweight | 2025-10-02 |
Which company has the best grades?
Both companies maintain predominantly positive grades. Strategy Inc consistently receives Buy and Outperform ratings, while Fair Isaac Corporation also holds Buy and Outperform ratings, with additional Overweight designations. Investors may interpret these strong grades as indicative of institutional confidence in both stocks.
Risks specific to each company
The following categories identify the critical pressure points and systemic threats facing both firms in the 2026 market environment:
1. Market & Competition
Strategy Inc
- Faces volatility from bitcoin treasury exposure and software competition.
Fair Isaac Corporation
- Competes in analytics and credit scoring, with steady but intense software market rivalry.
2. Capital Structure & Debt
Strategy Inc
- Moderate debt-to-assets ratio (28%) with weak interest coverage raises red flags.
Fair Isaac Corporation
- High debt-to-assets (165%) but strong interest coverage signals financial leverage risk.
3. Stock Volatility
Strategy Inc
- Beta at 3.54 reflects extreme stock price volatility and market sensitivity.
Fair Isaac Corporation
- Beta of 1.27 indicates moderate volatility, more stable relative to market benchmarks.
4. Regulatory & Legal
Strategy Inc
- Exposure to evolving cryptocurrency regulations poses systemic regulatory risk.
Fair Isaac Corporation
- Faces compliance demands in financial services but benefits from mature regulatory frameworks.
5. Supply Chain & Operations
Strategy Inc
- Operational risks linked to AI software deployment and bitcoin asset management.
Fair Isaac Corporation
- Operational stability supported by diversified software and scoring services globally.
6. ESG & Climate Transition
Strategy Inc
- Limited disclosure on ESG; bitcoin treasury business faces environmental scrutiny.
Fair Isaac Corporation
- Increasing focus on ESG integration in analytics, but carbon footprint concerns remain.
7. Geopolitical Exposure
Strategy Inc
- Global bitcoin operations expose firm to geopolitical instability and regulatory fragmentation.
Fair Isaac Corporation
- Global presence in financial services entails moderate exposure to geopolitical risks.
Which company shows a better risk-adjusted profile?
Strategy Inc’s biggest risk is its extreme stock volatility and poor profitability metrics reflecting bitcoin reliance. Fair Isaac’s critical risk lies in unsustainable debt levels despite operational strength. Fair Isaac’s stronger Altman Z-Score and Piotroski Score signal a more resilient financial health. Given Strategy Inc’s beta above 3.5 and negative margins, I see Fair Isaac as offering a better risk-adjusted profile in 2026, aided by balanced capital allocation and steady operational cash flow despite its leverage concerns.
Final Verdict: Which stock to choose?
Strategy Inc’s superpower lies in its asset efficiency, demonstrated by a strong fixed asset turnover ratio. However, its declining profitability and tight liquidity serve as key points of vigilance. It fits a portfolio aimed at aggressive growth, willing to tolerate volatility for potential turnaround gains.
Fair Isaac Corporation stands out with a durable moat rooted in its ability to generate high returns on invested capital well above its cost of capital. It offers superior income stability compared to Strategy Inc, making it more suitable for growth-at-a-reasonable-price (GARP) investors seeking consistent cash flow and competitive advantages.
If you prioritize aggressive growth and can endure financial instability, Strategy Inc might appeal due to its operational efficiency. However, if you seek a company with a proven economic moat and better earnings resilience, Fair Isaac Corporation clearly outshines as a more stable, value-creating option. Both present distinct risk profiles aligned with different investor appetites.
Disclaimer: Investment carries a risk of loss of initial capital. The past performance is not a reliable indicator of future results. Be sure to understand risks before making an investment decision.
Go Further
I encourage you to read the complete analyses of Strategy Inc and Fair Isaac Corporation to enhance your investment decisions: