Home > Comparison > Technology > CRM vs FICO
The strategic rivalry between Salesforce, Inc. and Fair Isaac Corporation shapes the evolving landscape of enterprise software solutions. Salesforce operates as a market-leading application software provider, delivering comprehensive customer relationship management platforms. Fair Isaac, by contrast, specializes in analytic and decision management software with a niche focus on scoring and risk assessment. This analysis investigates which company’s distinct operational model offers superior risk-adjusted returns for a diversified portfolio in today’s dynamic technology sector.
Table of contents
Companies Overview
Salesforce and Fair Isaac Corporation both play pivotal roles in the software application space, shaping how businesses leverage data and analytics.
Salesforce, Inc.: Customer Relationship Management Powerhouse
Salesforce dominates the CRM software market with its Customer 360 platform, generating revenue through subscription services that unify sales, service, marketing, and commerce. Its 2026 strategic focus centers on expanding integrated solutions like Slack and Tableau, enhancing customer experience and data analytics capabilities across industries.
Fair Isaac Corporation: Analytics and Decision Management Leader
Fair Isaac Corporation excels in analytic software and scoring solutions, powering decision automation for marketing, fraud detection, and compliance. Its 2026 strategy emphasizes scaling its modular FICO Platform and enhancing business-to-business and consumer credit scoring, targeting diverse global markets with software and subscription services.
Strategic Collision: Similarities & Divergences
Both companies leverage data-driven platforms, but Salesforce pursues a broad ecosystem integrating customer engagement tools, while Fair Isaac focuses on specialized decision management and credit scoring. They primarily compete in enterprise software but serve distinct niches. Salesforce offers expansive platform diversification; Fair Isaac’s strength lies in analytics precision—defining unique investment appeals.
Income Statement Comparison
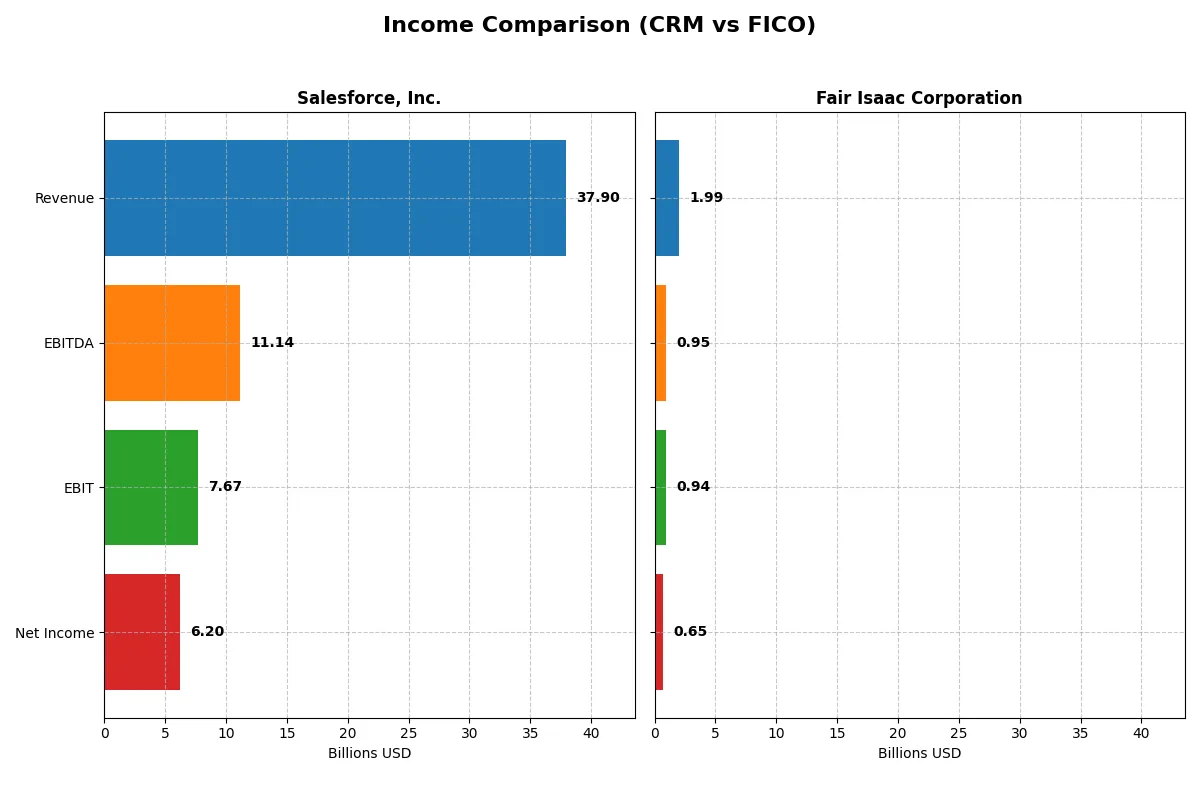
This data dissects the core profitability and scalability of both corporate engines to reveal who dominates the bottom line:
| Metric | Salesforce, Inc. (CRM) | Fair Isaac Corporation (FICO) |
|---|---|---|
| Revenue | 37.9B | 1.99B |
| Cost of Revenue | 8.64B | 354M |
| Operating Expenses | 22.0B | 712M |
| Gross Profit | 29.3B | 1.64B |
| EBITDA | 11.1B | 951M |
| EBIT | 7.67B | 936M |
| Interest Expense | 272M | 134M |
| Net Income | 6.20B | 652M |
| EPS | 6.44 | 26.9 |
| Fiscal Year | 2025 | 2025 |
Income Statement Analysis: The Bottom-Line Duel
This income statement comparison reveals the true efficiency of each corporate engine through their revenue growth and profitability margins.
Salesforce, Inc. Analysis
Salesforce’s revenue rose consistently from 21.3B in 2021 to 37.9B in 2025, with net income expanding from 4.07B to 6.20B. Its gross margin holds strong at 77.2%, while the net margin improved to 16.4%. In 2025, Salesforce delivered robust earnings momentum, with a 27.8% EBIT growth and a 37.8% net margin increase year-over-year.
Fair Isaac Corporation Analysis
Fair Isaac grew revenue from 1.32B in 2021 to 1.99B in 2025, while net income surged from 392M to 652M. The company commands an impressive 82.2% gross margin and a superior net margin at 32.8%. Its 2025 performance features a solid 25.2% EBIT growth and a 9.7% rise in net margin, highlighting strong profitability and operational efficiency.
Margin Efficiency vs. Revenue Scale
Fair Isaac leads in margin efficiency with a 32.8% net margin, nearly double Salesforce’s 16.4%. However, Salesforce’s revenue base is vastly larger, nearly 19 times Fair Isaac’s, fueling greater absolute net income. Investors seeking scale-driven growth may favor Salesforce, while those prioritizing margin strength and earnings quality might lean toward Fair Isaac.
Financial Ratios Comparison
These vital ratios act as a diagnostic tool to expose the underlying fiscal health, valuation premiums, and capital efficiency for each company:
| Ratios | Salesforce, Inc. (CRM) | Fair Isaac Corporation (FICO) |
|---|---|---|
| ROE | 10.1% | -37.3% |
| ROIC | 7.9% | 52.96% |
| P/E | 53.0 | 55.6 |
| P/B | 5.37 | -20.78 |
| Current Ratio | 1.06 | 0.83 |
| Quick Ratio | 1.06 | 0.83 |
| D/E | 0.19 | -1.76 |
| Debt-to-Assets | 11.1% | 164.6% |
| Interest Coverage | 26.5 | 6.92 |
| Asset Turnover | 0.37 | 1.07 |
| Fixed Asset Turnover | 7.03 | 21.20 |
| Payout ratio | 24.8% | 0% |
| Dividend yield | 0.47% | 0% |
| Fiscal Year | 2025 | 2025 |
Efficiency & Valuation Duel: The Vital Signs
Financial ratios act as a company’s DNA, exposing hidden risks and operational strengths critical for investment decisions.
Salesforce, Inc.
Salesforce posts a moderate 10.13% ROE and a healthy 16.35% net margin, signaling steady profitability. The stock trades at a high P/E of 53.04 and P/B of 5.37, indicating stretched valuation. Dividend yield is low at 0.47%, reflecting a focus on reinvestment in R&D and growth initiatives.
Fair Isaac Corporation
Fair Isaac delivers an impressive 32.75% net margin and a robust 52.96% ROIC, showcasing operational efficiency. However, it reports a negative ROE of -37.34% and a sky-high P/E of 55.64, suggesting valuation risks. The company pays no dividends, likely prioritizing internal growth and debt management despite elevated leverage.
Premium Valuation vs. Operational Safety
Fair Isaac’s efficiency beats Salesforce’s, but its negative ROE and high debt raise red flags. Salesforce offers steadier returns with moderate leverage and reinvestment discipline. Investors seeking operational safety might prefer Salesforce, while those chasing high efficiency must weigh Fair Isaac’s elevated risks.
Which one offers the Superior Shareholder Reward?
Salesforce (CRM) pays a modest 0.47% dividend yield with a sustainable payout ratio of 24.8%, supported by strong free cash flow (FCF) coverage near 95%. Its share buyback program accelerates total shareholder return, reflecting disciplined capital allocation. Fair Isaac (FICO) pays no dividends but aggressively reinvests FCF into growth and acquisitions. FICO’s lack of dividends is offset by consistent, sizable buybacks and a robust 98.8% FCF conversion ratio. However, FICO’s balance sheet shows negative equity and high leverage, raising sustainability concerns versus CRM’s healthier financial structure. I conclude Salesforce offers a more attractive and sustainable total return profile in 2026 for risk-aware investors.
Comparative Score Analysis: The Strategic Profile
The radar chart reveals the fundamental DNA and trade-offs of Salesforce, Inc. and Fair Isaac Corporation, highlighting their distinct financial strengths and vulnerabilities:
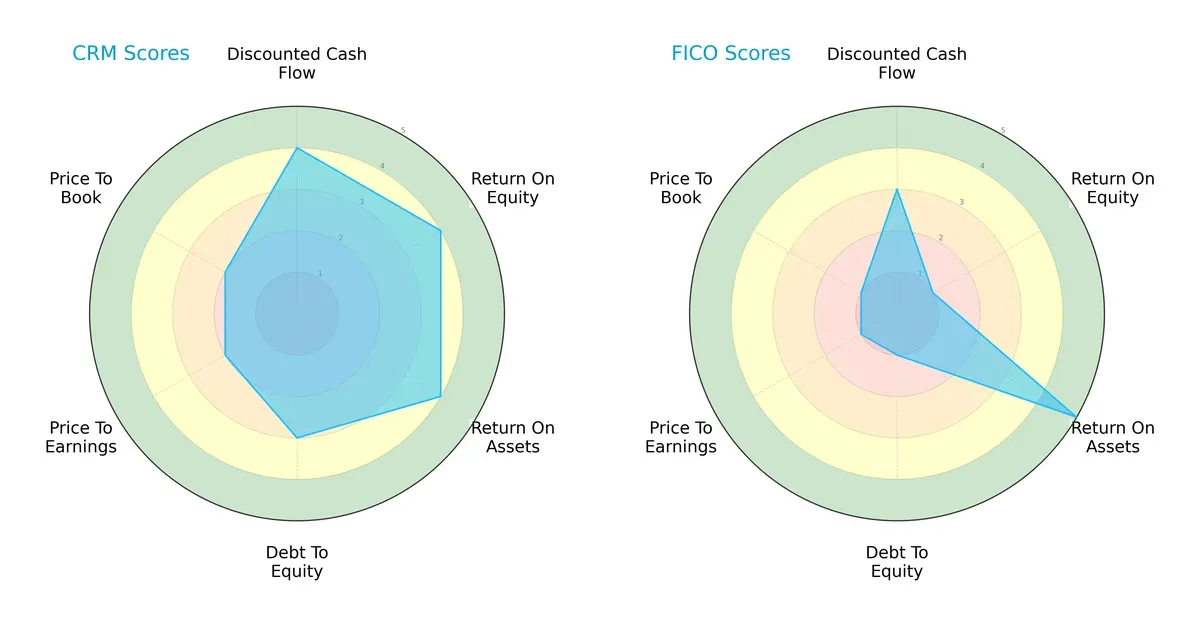
Salesforce shows a balanced profile with strong DCF, ROE, and ROA scores, reflecting efficient capital allocation and profitability. Fair Isaac excels in asset utilization (ROA) but lags in equity returns and debt management, relying heavily on operational efficiency. Salesforce’s moderate leverage and valuation scores contrast with Fair Isaac’s weaker debt and valuation metrics, indicating Salesforce offers a more stable investment foundation.
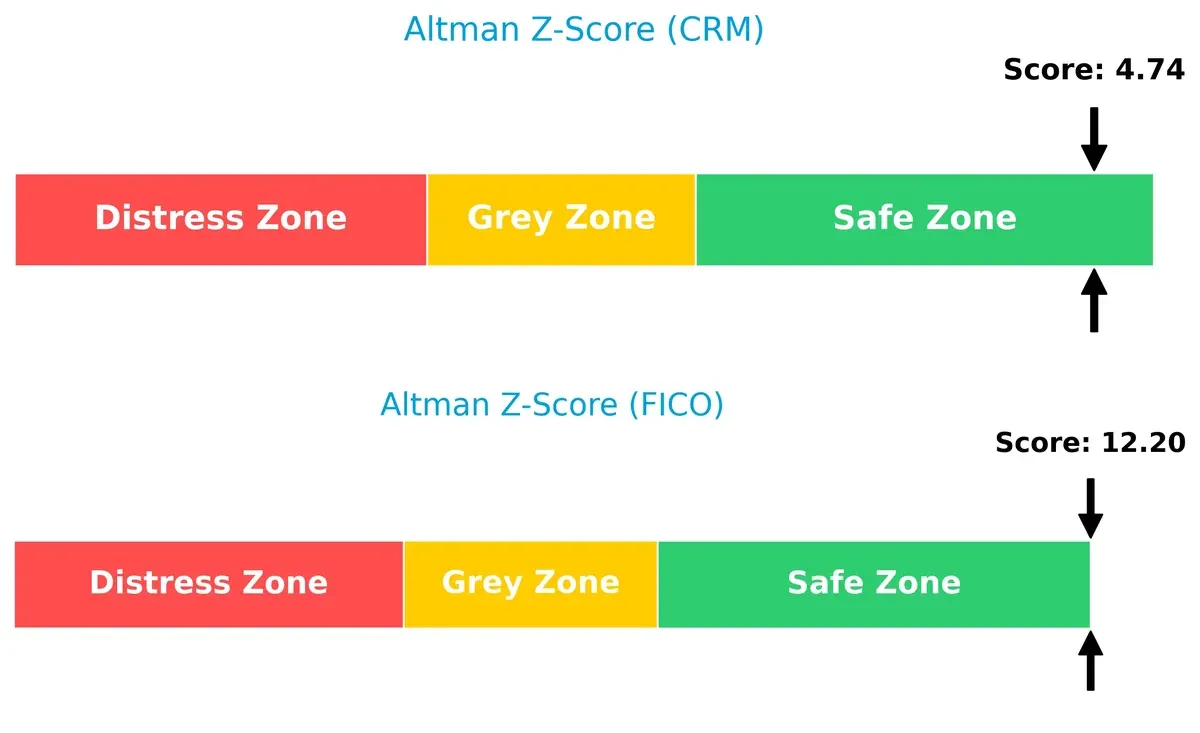
Bankruptcy Risk: Solvency Showdown
The Altman Z-Score difference reveals Fair Isaac’s superior solvency edge in this cycle, suggesting a stronger buffer against financial distress:
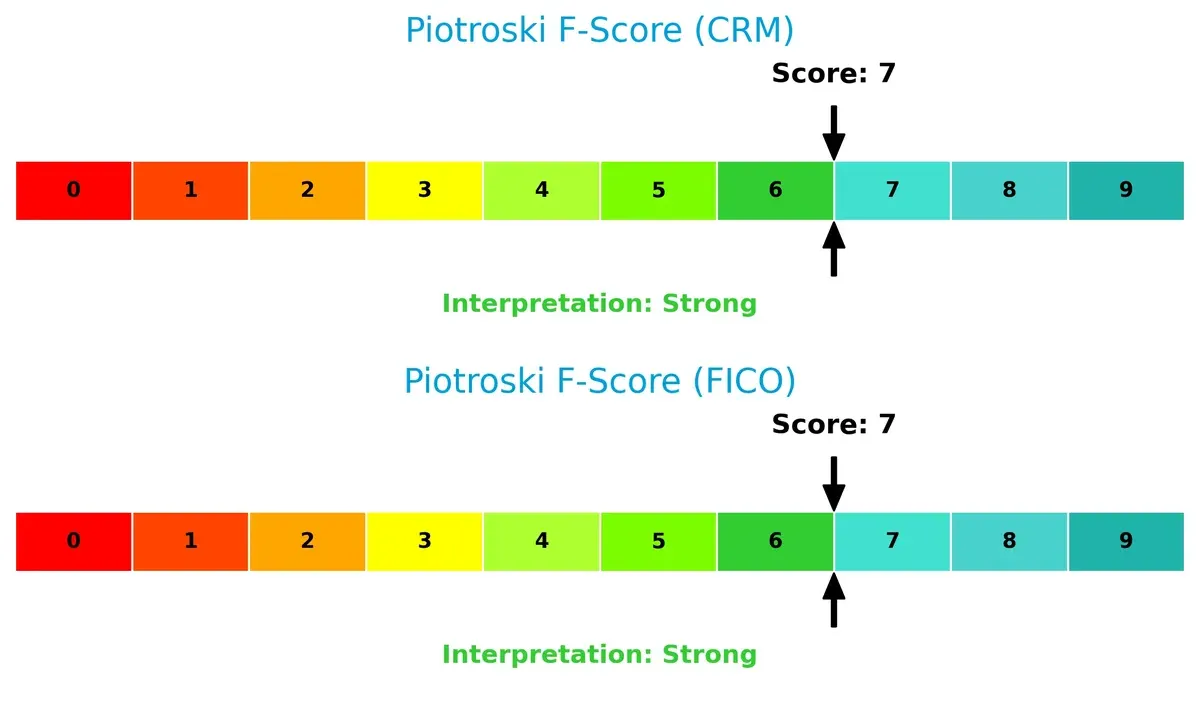
Financial Health: Quality of Operations
Both firms score 7 on the Piotroski scale, indicating strong financial health with no immediate red flags in profitability, liquidity, or efficiency:
How are the two companies positioned?
This section dissects the operational DNA of Salesforce and Fair Isaac by comparing their revenue distribution and internal dynamics. The goal is to confront their economic moats to identify the most resilient, sustainable competitive advantage in today’s market.
Revenue Segmentation: The Strategic Mix
This visual comparison dissects how Salesforce, Inc. and Fair Isaac Corporation diversify income streams and where their primary sector bets lie:
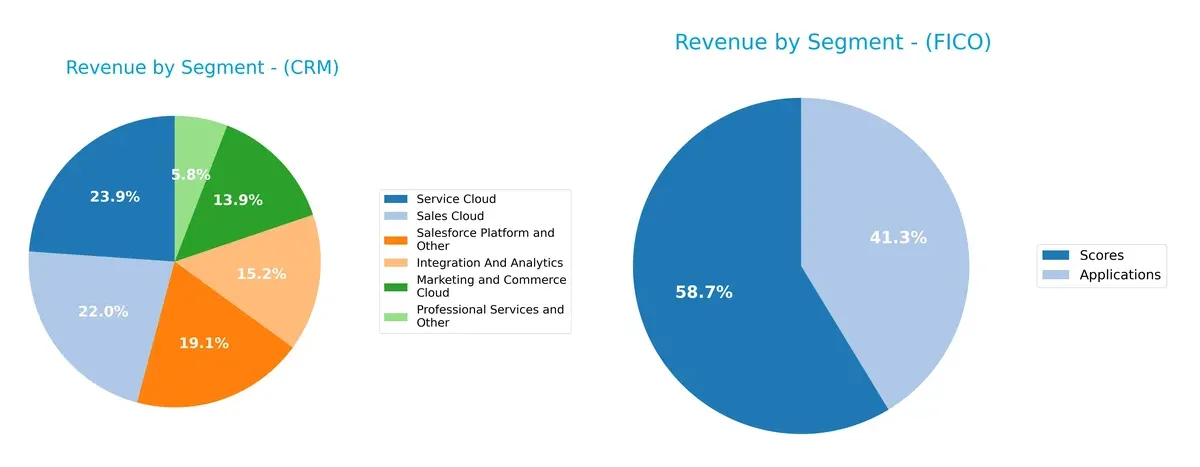
Salesforce anchors revenue across six sizable segments, with Service Cloud leading at $9.1B, followed closely by Sales Cloud at $8.3B. This broad mix signals ecosystem lock-in and resilience through diversification. Fair Isaac, in contrast, pivots heavily on Scores ($1.17B) and Applications ($822M), showing concentration risk but leveraging a niche moat in credit analytics. Salesforce’s scale dwarfs Fair Isaac’s, highlighting infrastructure dominance versus specialized focus.
Strengths and Weaknesses Comparison
This table compares the Strengths and Weaknesses of Salesforce, Inc. and Fair Isaac Corporation:
Salesforce Strengths
- Broad product diversification across six segments
- Favorable net margin of 16.35%
- Strong global presence with $25.1B Americas revenue
- Favorable debt metrics and interest coverage
- Consistent growth in cloud and analytics revenues
Fair Isaac Strengths
- High net margin of 32.75%
- Excellent ROIC of 52.96%, well above WACC
- Favorable price-to-book ratio despite negative debt/equity
- Strong asset turnover and fixed asset efficiency
- Focused product segments with growing Software and Scores revenues
Salesforce Weaknesses
- High P/E and P/B ratios indicate expensive valuation
- Asset turnover relatively weak at 0.37
- Dividend yield low at 0.47%
- ROE and ROIC slightly below WACC
- Current ratio barely above 1 signals limited liquidity
Fair Isaac Weaknesses
- Negative ROE at -37.34% signals profitability issues
- High debt to assets at 164.6% is a significant red flag
- Current ratio below 1 suggests liquidity stress
- Zero dividend yield limits income appeal
- P/E ratio elevated at 55.64
Both companies show slightly favorable overall financial ratios but differ in capital structure and profitability metrics. Salesforce’s diversification and strong cash flow contrast with Fair Isaac’s higher profitability but concerning leverage and liquidity. These factors will shape strategic priorities going forward.
The Moat Duel: Analyzing Competitive Defensibility
A structural moat is the only reliable shield protecting long-term profits from relentless competitive pressures and market entry risks:
Salesforce, Inc.: Ecosystem Integration as Switching Costs
Salesforce’s moat stems from powerful switching costs embedded in its integrated Customer 360 platform. This manifests as stable margins (20% EBIT) but a slightly unfavorable ROIC vs. WACC, signaling value erosion despite growing profitability. Expansion into analytics and Slack deepens this moat but competitive SaaS pressure looms in 2026.
Fair Isaac Corporation: Data-Driven Intangible Assets
FICO’s moat relies on proprietary analytics and scoring algorithms, generating a very favorable ROIC exceeding WACC by 44%. Its higher margins (47% EBIT) outpace Salesforce’s, reflecting efficient capital use. Growing ROIC and global expansion into fraud detection offer solid moat durability and upside in 2026.
Moat Strength: Switching Costs vs. Proprietary Analytics
FICO holds the deeper moat with superior value creation and margin strength, better equipped to defend its niche. Salesforce’s ecosystem lock-in is sizable but less efficient and vulnerable to SaaS competition. FICO’s analytic edge sustains a more durable competitive advantage.
Which stock offers better returns?
Over the past year, Salesforce, Inc. and Fair Isaac Corporation exhibited contrasting price trajectories, with significant shifts in trading volumes and price momentum shaping their market dynamics.
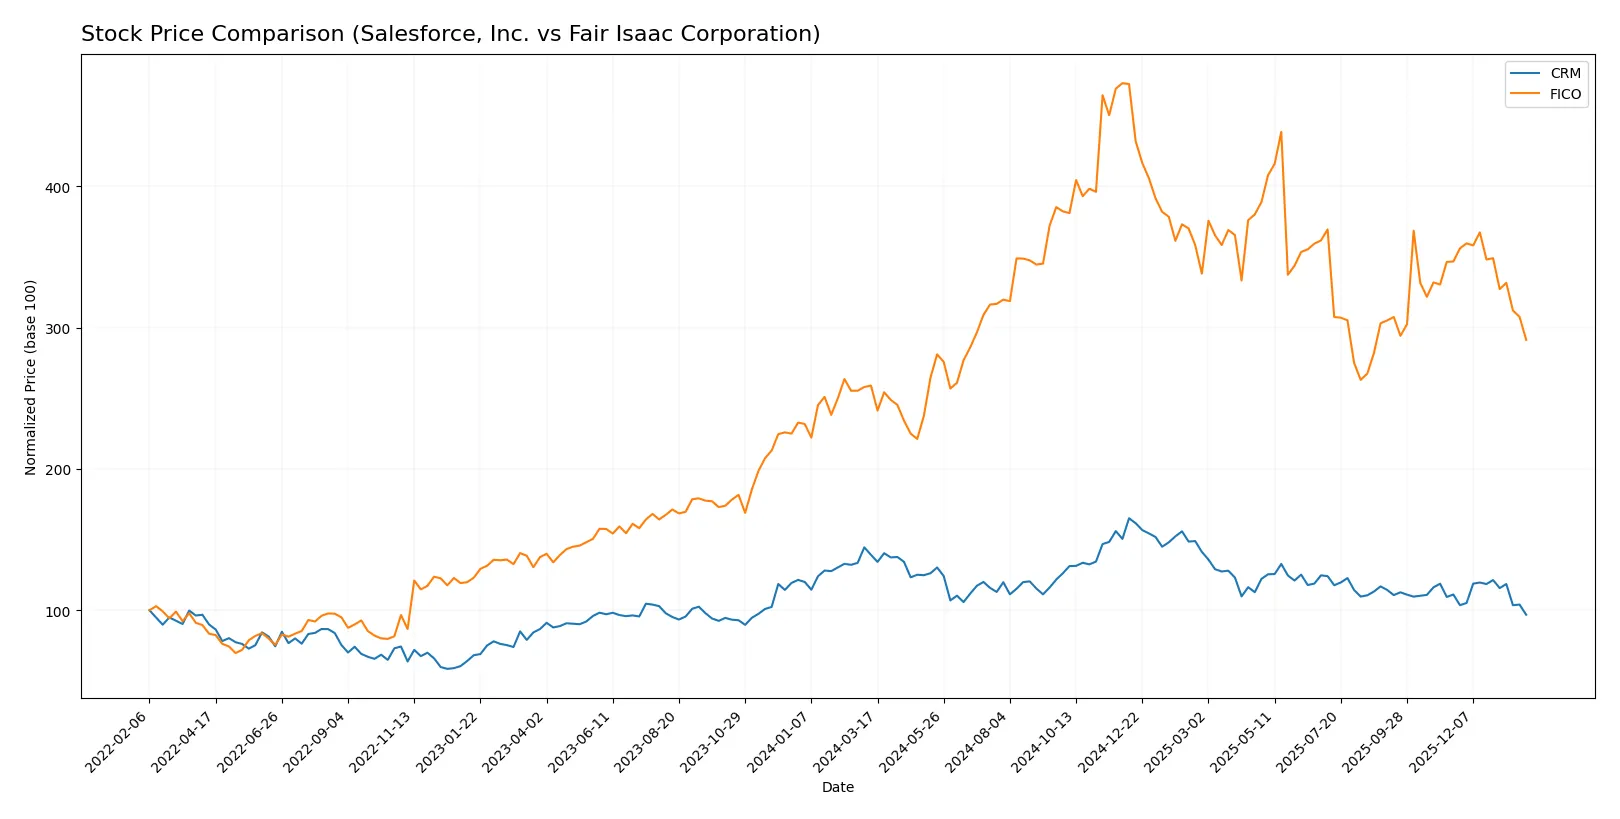
Trend Comparison
Salesforce, Inc. shows a bearish trend with a 30.46% price decline over 12 months, decelerating losses, a high volatility of 32.42, and a price range from 361.99 to 212.29.
Fair Isaac Corporation posts a bullish trend with a 12.51% gain over 12 months, despite decelerating growth, high volatility at 285.65, and a price range from 1110.85 to 2375.03.
Comparatively, Fair Isaac Corporation delivered superior market performance over the last year, outperforming Salesforce, Inc. in total price appreciation.
Target Prices
Analysts project solid upside potential for both Salesforce, Inc. and Fair Isaac Corporation based on consensus targets.
| Company | Target Low | Target High | Consensus |
|---|---|---|---|
| Salesforce, Inc. | 250 | 400 | 324.17 |
| Fair Isaac Corporation | 1640 | 2400 | 2115 |
Salesforce’s target consensus sits about 53% above its current 212 price, signaling strong growth expectations. Fair Isaac’s consensus is 44% higher than the current 1463 price, reflecting bullish sentiment in the software analytics space.

Don’t Let Luck Decide Your Entry Point
Optimize your entry points with our advanced ProRealTime indicators. You’ll get efficient buy signals with precise price targets for maximum performance. Start outperforming now!
How do institutions grade them?
The following tables summarize recent institutional grades for Salesforce, Inc. and Fair Isaac Corporation:
Salesforce, Inc. Grades
This table shows the most recent grades provided by prominent financial institutions for Salesforce, Inc.
| Grading Company | Action | New Grade | Date |
|---|---|---|---|
| Barclays | Maintain | Overweight | 2026-01-12 |
| RBC Capital | Maintain | Sector Perform | 2026-01-05 |
| Morgan Stanley | Maintain | Overweight | 2025-12-09 |
| Citigroup | Maintain | Neutral | 2025-12-08 |
| DA Davidson | Maintain | Neutral | 2025-12-05 |
| Canaccord Genuity | Maintain | Buy | 2025-12-04 |
| Truist Securities | Maintain | Buy | 2025-12-04 |
| Deutsche Bank | Maintain | Buy | 2025-12-04 |
| Baird | Maintain | Outperform | 2025-12-04 |
| Wedbush | Maintain | Outperform | 2025-12-04 |
Fair Isaac Corporation Grades
This table displays the latest grades issued by leading research firms for Fair Isaac Corporation.
| Grading Company | Action | New Grade | Date |
|---|---|---|---|
| Needham | Maintain | Buy | 2026-01-29 |
| Jefferies | Maintain | Buy | 2026-01-16 |
| Wells Fargo | Maintain | Overweight | 2026-01-14 |
| JP Morgan | Maintain | Neutral | 2025-11-06 |
| Baird | Maintain | Outperform | 2025-11-06 |
| Jefferies | Maintain | Buy | 2025-11-06 |
| BMO Capital | Maintain | Outperform | 2025-11-06 |
| Wells Fargo | Maintain | Overweight | 2025-10-14 |
| Barclays | Maintain | Overweight | 2025-10-02 |
| Needham | Maintain | Buy | 2025-10-02 |
Which company has the best grades?
Both companies maintain mostly positive grades, with consistent “Buy,” “Overweight,” and “Outperform” ratings. Fair Isaac Corporation shows a slight edge with more recent “Buy” and “Overweight” ratings from several firms, potentially indicating stronger near-term confidence among analysts. Investors might interpret this as a signal of relatively higher institutional conviction for Fair Isaac at present.
Risks specific to each company
The following categories identify the critical pressure points and systemic threats facing both firms in the 2026 market environment:
1. Market & Competition
Salesforce, Inc.
- Faces intense competition in CRM and cloud software, pressured by innovation cycles and pricing wars.
Fair Isaac Corporation
- Operates in niche analytics and decision software, with competitive pressure from emerging AI-driven fintech firms.
2. Capital Structure & Debt
Salesforce, Inc.
- Maintains low debt-to-equity (0.19) and strong interest coverage (28.18×), indicating prudent leverage.
Fair Isaac Corporation
- Displays very high debt-to-assets ratio (165%), signaling elevated financial risk despite favorable interest coverage (7×).
3. Stock Volatility
Salesforce, Inc.
- Beta near 1.27 implies moderate market sensitivity, typical for tech sector leaders.
Fair Isaac Corporation
- Slightly higher beta at 1.29 suggests marginally elevated share price volatility.
4. Regulatory & Legal
Salesforce, Inc.
- Exposed to data privacy and antitrust scrutiny given large market share and cloud data handling.
Fair Isaac Corporation
- Faces compliance risks in financial services regulation and data security across multiple jurisdictions.
5. Supply Chain & Operations
Salesforce, Inc.
- Relies heavily on cloud infrastructure and partner ecosystem; disruptions could impact service delivery.
Fair Isaac Corporation
- Software-centric with fewer physical dependencies but risks from technology integration challenges.
6. ESG & Climate Transition
Salesforce, Inc.
- Strong ESG commitments and investments in sustainability, aligning with stakeholder expectations.
Fair Isaac Corporation
- ESG profile less prominent, potential risk if investor focus intensifies on environmental factors.
7. Geopolitical Exposure
Salesforce, Inc.
- Global operations expose it to trade tensions, data localization laws, and geopolitical instability.
Fair Isaac Corporation
- Moderate exposure due to smaller scale but vulnerable to regulatory shifts in key markets.
Which company shows a better risk-adjusted profile?
Salesforce’s low leverage and strong liquidity mitigate financial risk despite competitive pressures. Fair Isaac’s excessive debt and weak equity returns flag significant financial vulnerability. Salesforce’s balanced risk profile and strong Altman Z-Score affirm its relative stability. Fair Isaac, while profitable operationally, carries higher capital structure risk. Recent ratio trends confirm Salesforce’s more resilient footing in 2026.
Final Verdict: Which stock to choose?
Salesforce, Inc. wields unmatched scale and operational muscle in cloud CRM, driving strong cash flow and steady innovation. Its point of vigilance lies in a stretched valuation and modest returns above capital cost. It suits portfolios seeking aggressive growth with a tolerance for valuation risk.
Fair Isaac Corporation commands a durable moat through its data-driven analytics and credit scoring dominance. Despite higher leverage and volatile earnings quality, it offers better capital efficiency and safety relative to Salesforce. It fits well within GARP strategies focusing on value with growth.
If you prioritize platform scale and sustained innovation, Salesforce is the compelling choice due to its market leadership and growth momentum. However, if you seek durable competitive advantage and capital efficiency with somewhat better stability, Fair Isaac offers a superior risk-return profile. Both demand careful risk assessment given their premium valuations and sector cyclicality.
Disclaimer: Investment carries a risk of loss of initial capital. The past performance is not a reliable indicator of future results. Be sure to understand risks before making an investment decision.
Go Further
I encourage you to read the complete analyses of Salesforce, Inc. and Fair Isaac Corporation to enhance your investment decisions: