Home > Comparison > Technology > FICO vs PTC
The strategic rivalry between Fair Isaac Corporation and PTC Inc. shapes the trajectory of the technology sector’s software application landscape. Fair Isaac operates as a data-driven analytics and decision management leader, while PTC focuses on industrial digital transformation with CAD and lifecycle management software. This head-to-head contrasts data-centric innovation against integrated product development. This analysis aims to identify which company offers the superior risk-adjusted return for a diversified portfolio in 2026.
Table of contents
Companies Overview
Fair Isaac Corporation and PTC Inc. shape key niches within the global software application market.
Fair Isaac Corporation: Leader in Decision Analytics
Fair Isaac Corporation dominates the decision analytics space by selling software and scoring solutions that automate business choices worldwide. Its revenues flow from two segments: Scores, featuring consumer and business scoring products, and Software, which offers modular decision management platforms. In 2026, the company prioritizes expanding its advanced analytics capabilities to deepen integration in financial services and fraud detection.
PTC Inc.: Pioneer in Digital Transformation Software
PTC Inc. drives the digital transformation of enterprises through a broad software portfolio including ThingWorx IoT, Vuforia AR, and CAD/PLM tools like Creo and Windchill. It earns revenue from software products and professional services aimed at accelerating innovation cycles. For 2026, PTC focuses on enhancing its SaaS platform and cloud offerings to scale customer adoption and streamline product lifecycle management.
Strategic Collision: Similarities & Divergences
Both companies leverage software innovation to optimize business operations but diverge in focus: Fair Isaac excels in data-driven decisioning while PTC leads in product design and digital transformation tools. Their battleground lies in delivering scalable, cloud-enabled solutions to industrial and financial sectors. Investors face distinct profiles—FICO bets on analytics precision; PTC on broad platform integration and growth.
Income Statement Comparison
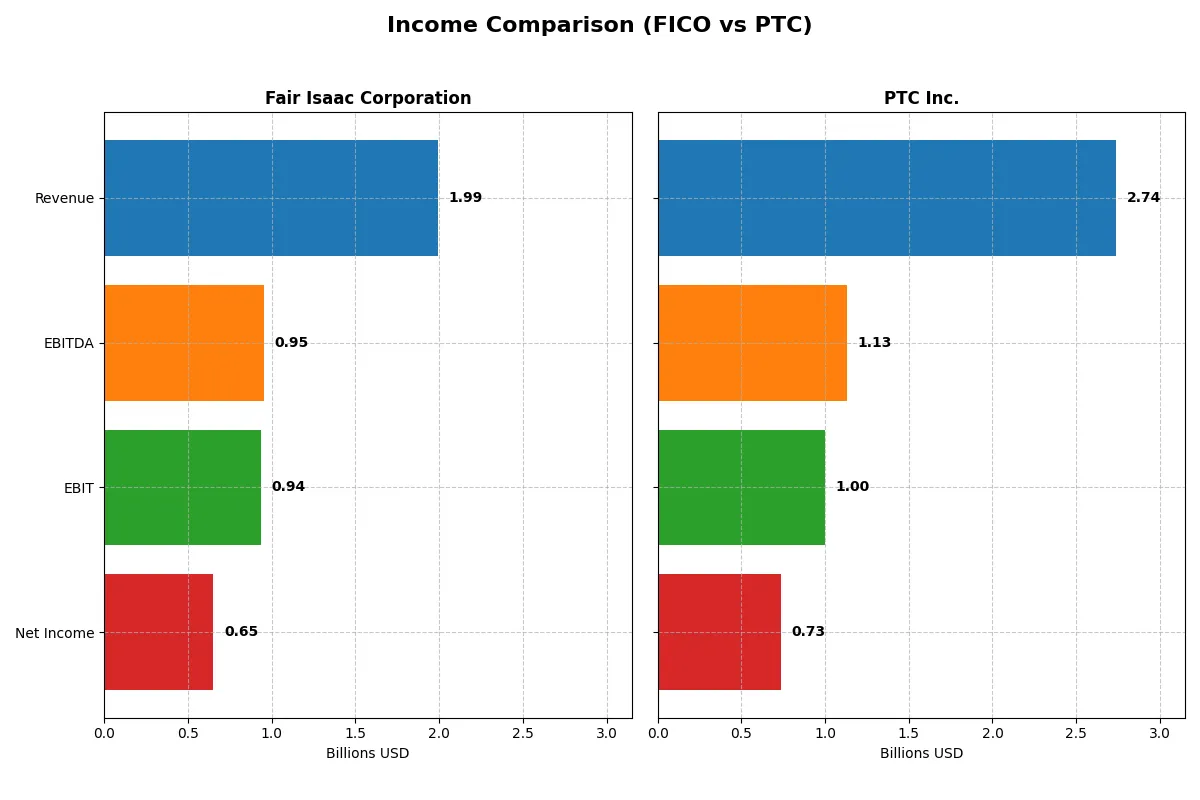
This data dissects the core profitability and scalability of both corporate engines to reveal who dominates the bottom line:
| Metric | Fair Isaac Corporation (FICO) | PTC Inc. (PTC) |
|---|---|---|
| Revenue | 1.99B | 2.74B |
| Cost of Revenue | 354M | 445M |
| Operating Expenses | 712M | 1.31B |
| Gross Profit | 1.64B | 2.29B |
| EBITDA | 951M | 1.13B |
| EBIT | 936M | 997M |
| Interest Expense | 134M | 77M |
| Net Income | 652M | 734M |
| EPS | 26.9 | 6.18 |
| Fiscal Year | 2025 | 2025 |
Income Statement Analysis: The Bottom-Line Duel
This income statement comparison reveals the true efficiency and profitability of two corporate engines powering their growth trajectories.
Fair Isaac Corporation (FICO) Analysis
FICO’s revenue climbed steadily from 1.32B in 2021 to 1.99B in 2025, with net income surging from 392M to 652M. The company sustains strong gross (82.2%) and net margins (32.8%), reflecting operational discipline. In 2025, EBIT margin expanded to 47%, signaling robust efficiency and accelerating profitability momentum.
PTC Inc. (PTC) Analysis
PTC’s revenue rose from 1.81B in 2021 to 2.74B in 2025, with net income increasing from 477M to 734M. Gross margin remains healthy at 83.8%, while net margin at 26.8% trails FICO’s. The 2025 EBIT margin of 36.4% improved sharply, driven by a 69% EBIT growth year-over-year, highlighting strong operational leverage.
Margin Power vs. Revenue Scale
FICO delivers superior margin quality and net income growth, driven by effective cost control and high operating leverage. PTC boasts higher revenue scale and rapid EBIT growth, but with slimmer net margins. For investors prioritizing margin strength and profitability, FICO’s profile offers a more compelling bottom-line efficiency.
Financial Ratios Comparison
These vital ratios act as a diagnostic tool to expose the underlying fiscal health, valuation premiums, and capital efficiency of the companies compared:
| Ratios | Fair Isaac Corporation (FICO) | PTC Inc. (PTC) |
|---|---|---|
| ROE | -37.3% | 19.2% |
| ROIC | 52.96% | 14.43% |
| P/E | 55.6 | 33.2 |
| P/B | -20.8 | 6.37 |
| Current Ratio | 0.83 | 1.12 |
| Quick Ratio | 0.83 | 1.12 |
| D/E | -1.76 | 0.36 |
| Debt-to-Assets | 164.6% | 20.7% |
| Interest Coverage | 6.92 | 12.76 |
| Asset Turnover | 1.07 | 0.41 |
| Fixed Asset Turnover | 21.2 | 15.6 |
| Payout ratio | 0 | 0 |
| Dividend yield | 0 | 0 |
| Fiscal Year | 2025 | 2025 |
Efficiency & Valuation Duel: The Vital Signs
Financial ratios act as a company’s DNA, unveiling hidden risks and operational strengths that shape investor confidence and valuation.
Fair Isaac Corporation
FICO shows robust net margin at 32.75% but suffers a negative ROE of -37.34%, signaling shareholder returns are under pressure. The stock trades at a stretched P/E of 55.64, indicating expensive valuation. Despite no dividends, it reinvests heavily in R&D (9.46% of revenue), aiming for long-term growth.
PTC Inc.
PTC posts a solid ROE of 19.18% and a healthy net margin of 26.8%, reflecting operational efficiency. Its P/E of 33.19 remains high but less stretched than FICO’s. PTC offers no dividend either, focusing on R&D investment at 16.7% of revenue to fuel innovation and future expansion.
Premium Valuation vs. Operational Safety
FICO’s valuation is significantly more stretched, despite strong cash flow returns, but negative ROE raises concerns. PTC balances moderate profitability with a more reasonable valuation and stronger equity returns. Investors prioritizing steady operational safety may prefer PTC’s profile over FICO’s growth-at-any-cost approach.
Which one offers the Superior Shareholder Reward?
I see Fair Isaac Corporation (FICO) and PTC Inc. both skip dividends, focusing on reinvestment and buybacks. FICO’s free cash flow per share hit 31.8 in 2025, nearly 4.5x PTC’s 7.14, fueling aggressive buybacks with zero payout ratio. PTC’s modest buyback effort contrasts with its lower free cash flow. Historically, FICO’s superior cash generation supports a more sustainable buyback-driven return, enhancing long-term value. I conclude FICO offers a stronger total shareholder reward for 2026 investors, balancing growth reinvestment and capital return more effectively than PTC.
Comparative Score Analysis: The Strategic Profile
The radar chart reveals the fundamental DNA and trade-offs of Fair Isaac Corporation and PTC Inc., highlighting their financial strengths and vulnerabilities:
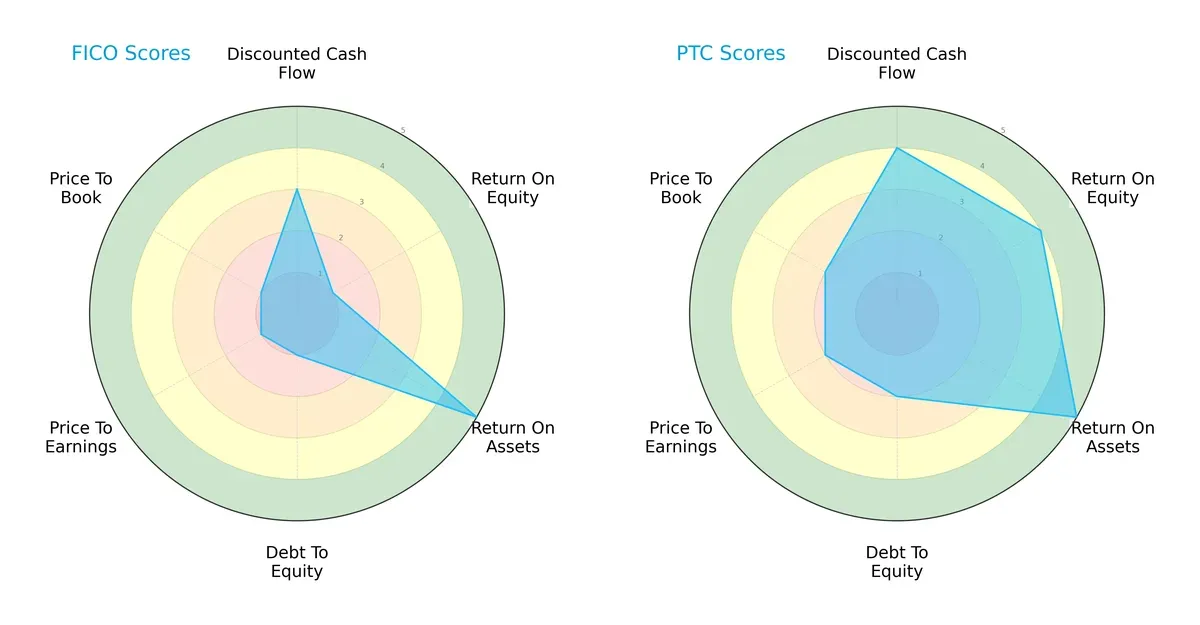
PTC shows a more balanced financial profile with favorable scores in DCF (4), ROE (4), and Debt/Equity (2). It leverages profitability and moderate leverage effectively. In contrast, Fair Isaac relies heavily on asset efficiency (ROA score 5) but suffers from weak equity returns (ROE 1) and heavy debt risk (Debt/Equity 1). PTC’s valuation metrics (PE/PB scores of 2) suggest moderately fair pricing versus FICO’s expensive valuation (scores 1). Overall, PTC offers a robust, diversified edge, while FICO’s strengths hinge narrowly on asset utilization.
Bankruptcy Risk: Solvency Showdown
PTC and Fair Isaac both reside in the safe zone by Altman Z-Score standards, but with meaningful differences:
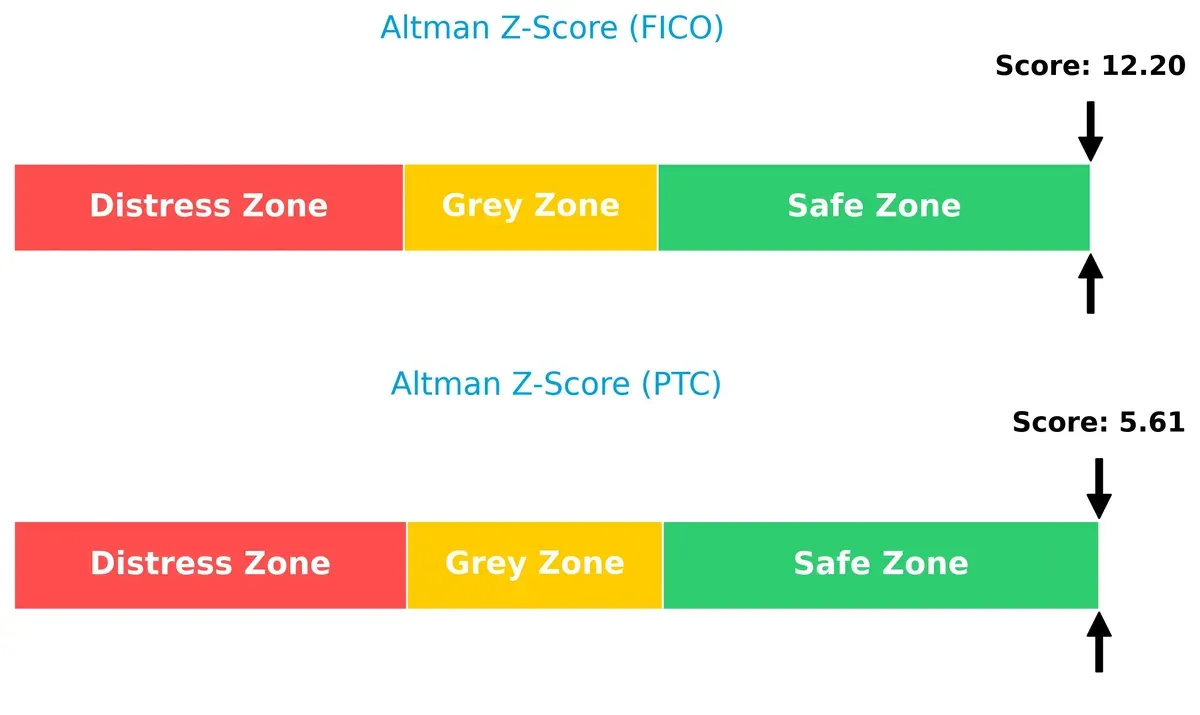
Fair Isaac’s Z-Score of 12.2 far outpaces PTC’s 5.6, implying a stronger buffer against bankruptcy risk in this cycle. This large delta suggests FICO’s balance sheet is significantly more resilient, offering investors greater confidence in long-term survival despite its operational weaknesses.
Financial Health: Quality of Operations
Both companies demonstrate strong operational health via Piotroski F-Scores, though one stands out:
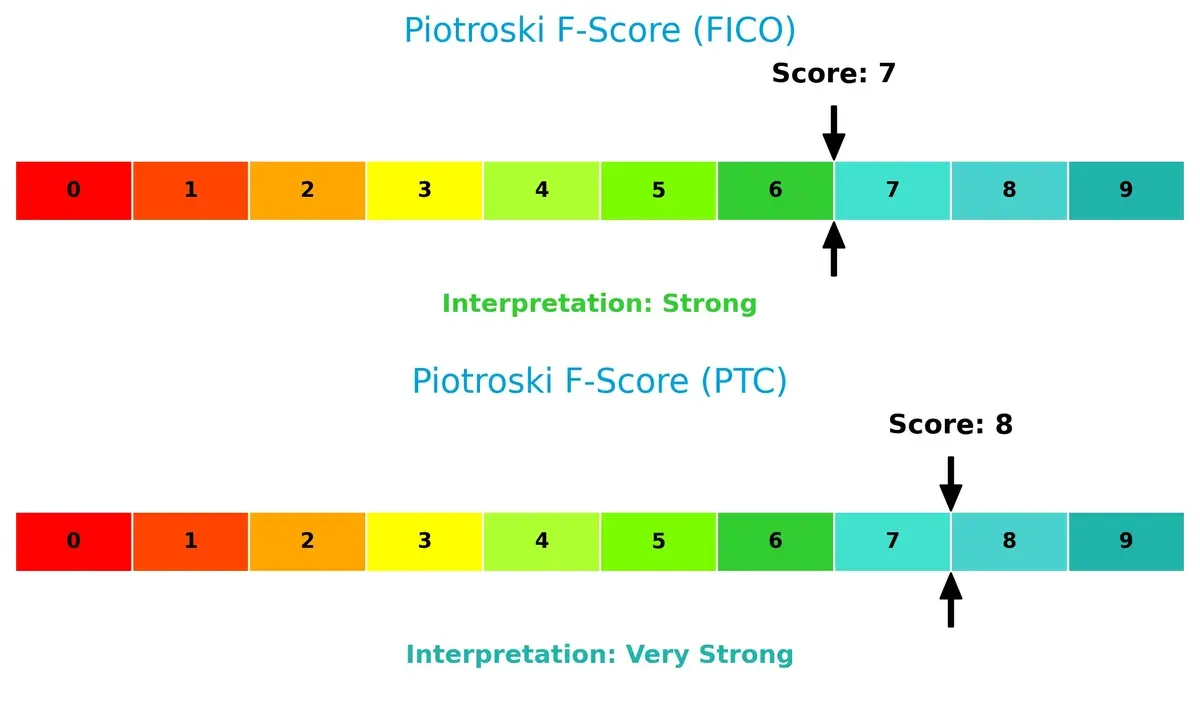
PTC’s score of 8 signals very strong internal financial metrics, reflecting superior profitability, liquidity, and efficiency. Fair Isaac’s 7 is strong but indicates slightly more vulnerability. Investors should note FICO’s relatively lower score as a caution flag for internal financial consistency compared to PTC’s near-peak health.
How are the two companies positioned?
This section dissects the operational DNA of FICO and PTC by comparing their revenue distribution and internal dynamics. The goal: confront their economic moats to reveal the most resilient and sustainable competitive advantage today.
Revenue Segmentation: The Strategic Mix
This visual comparison dissects how Fair Isaac Corporation and PTC Inc. diversify their income streams and reveals their primary sector bets for 2025:
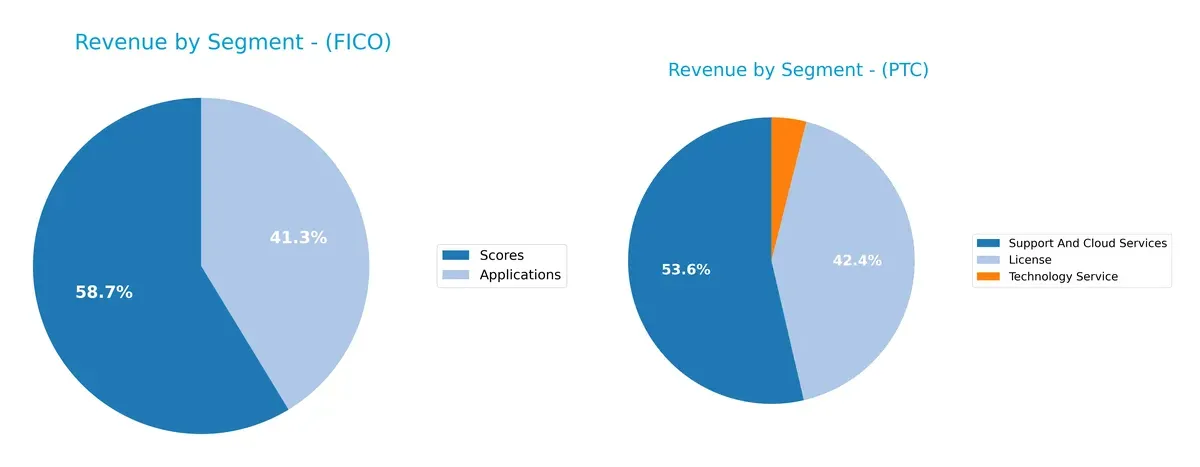
Fair Isaac Corporation anchors revenue in two main segments: Scores at $1.17B and Applications at $822M, showing moderate diversification. PTC Inc. boasts a broader mix with $1.47B in Support and Cloud Services, $1.16B in License, and $107M in Technology Service. PTC’s diversified streams reduce concentration risk and indicate strong infrastructure dominance. FICO’s reliance on Scores suggests potential vulnerability to segment-specific downturns but benefits from focused expertise.
Strengths and Weaknesses Comparison
This table compares the Strengths and Weaknesses of Fair Isaac Corporation (FICO) and PTC Inc. (PTC):
FICO Strengths
- Strong net margin at 32.75%
- High ROIC of 52.96% indicates efficient capital use
- Favorable asset turnover ratios
- Diverse revenue from Applications and Scores segments
- Solid Americas market presence with 1.73B revenue
PTC Strengths
- Favorable ROE at 19.18%
- Balanced ROIC of 14.43% above WACC
- Strong interest coverage at 12.95
- Broad geographic revenue including Americas, Europe, Asia Pacific
- Diversified revenue streams across License, Services, Cloud
FICO Weaknesses
- Negative ROE at -37.34% highlights profitability issues
- Unfavorable debt-to-assets at 164.6% signals financial risk
- Low current ratio at 0.83 implies liquidity constraints
- High P/E at 55.64 may reflect overvaluation
- Zero dividend yield limits income appeal
PTC Weaknesses
- Unfavorable P/E at 33.19 suggests valuation risk
- Unfavorable PB ratio at 6.37 indicates high market price vs. book
- Low asset turnover at 0.41 shows less efficient asset use
- Zero dividend yield reduces income potential
Both companies show solid profitability and diversification strengths but face valuation and liquidity challenges. FICO’s high leverage and negative ROE are notable risks. PTC’s weaker asset efficiency and valuation metrics warrant attention in capital allocation strategy.
The Moat Duel: Analyzing Competitive Defensibility
A structural moat is the only reliable barrier protecting long-term profits from relentless competition erosion. Let’s break down the battle:
Fair Isaac Corporation: Data-Driven Switching Costs
Fair Isaac’s moat stems from high switching costs embedded in its credit scoring and decision analytics platform. Its 43.6% ROIC premium over WACC confirms efficient capital use and margin stability. Expansion into fraud detection and compliance software in 2026 promises deeper entrenchment.
PTC Inc.: Innovation-Backed Product Ecosystem
PTC leverages a broad product ecosystem combining CAD, PLM, and AR platforms. Unlike Fair Isaac’s switching cost moat, PTC drives value through innovative integration, showing a rising ROIC and robust 6.1% spread over WACC. Growth in digital transformation services fuels future expansion potential.
Switching Costs vs. Integrated Innovation: Who Holds the Moat Crown?
Fair Isaac wields a wider moat, evidenced by its substantial ROIC advantage and durable switching cost advantage. PTC’s innovation ecosystem is solid but less defensible long-term. Fair Isaac stands better positioned to protect and grow market share in 2026.
Which stock offers better returns?
Over the past year, Fair Isaac Corporation’s stock gained 12.51%, showing a bullish but decelerating trend. PTC Inc. declined 15.8%, marking a bearish and slowing downward movement.
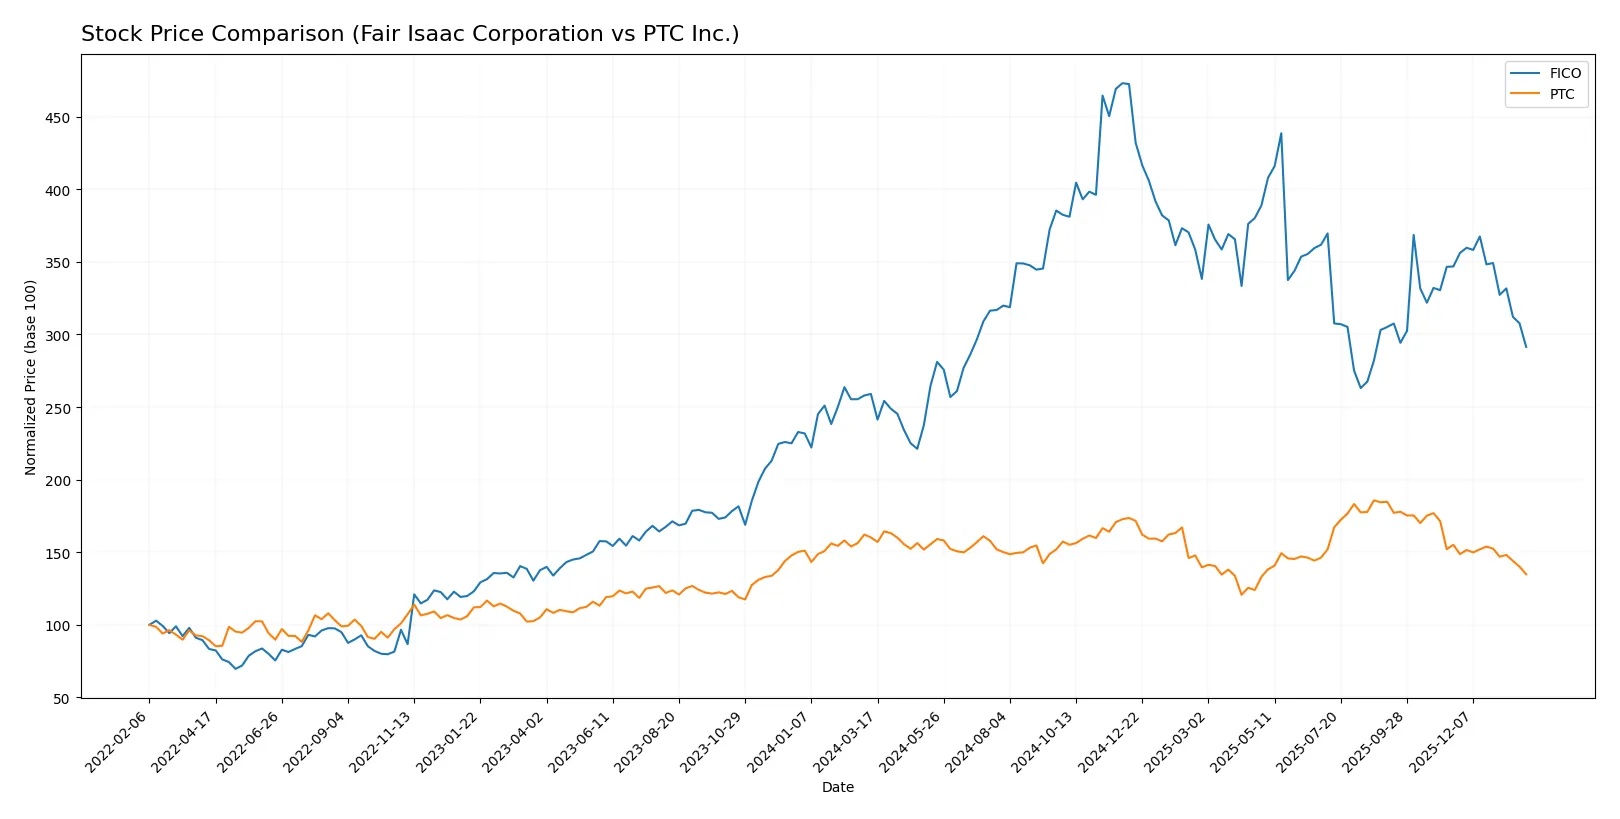
Trend Comparison
Fair Isaac Corporation’s stock rose 12.51% over the past 12 months, indicating a bullish trend with decelerating momentum. It recorded a high of 2375.03 and a low of 1110.85 during this period.
PTC Inc.’s stock fell 15.8% over the last year, reflecting a bearish trend with deceleration. The highest price was 215.05 and the lowest 139.77, showing a consistent downward slope.
Fair Isaac Corporation outperformed PTC Inc. in market returns, delivering positive growth versus PTC’s significant decline over the same 12-month period.
Target Prices
Analysts present a bullish consensus for both Fair Isaac Corporation and PTC Inc., signaling upside potential.
| Company | Target Low | Target High | Consensus |
|---|---|---|---|
| Fair Isaac Corporation | 1,640 | 2,400 | 2,115 |
| PTC Inc. | 200 | 255 | 227.5 |
Fair Isaac’s target consensus at 2,115 implies a roughly 44.6% upside from the current 1,463 price. PTC’s consensus of 227.5 suggests a 45.7% gain from 156.13. Both stocks show strong analyst conviction relative to their current prices.

Don’t Let Luck Decide Your Entry Point
Optimize your entry points with our advanced ProRealTime indicators. You’ll get efficient buy signals with precise price targets for maximum performance. Start outperforming now!
How do institutions grade them?
The institutional grades for Fair Isaac Corporation and PTC Inc. are as follows:
Fair Isaac Corporation Grades
The table below summarizes recent institutional grades for Fair Isaac Corporation.
| Grading Company | Action | New Grade | Date |
|---|---|---|---|
| Needham | Maintain | Buy | 2026-01-29 |
| Jefferies | Maintain | Buy | 2026-01-16 |
| Wells Fargo | Maintain | Overweight | 2026-01-14 |
| JP Morgan | Maintain | Neutral | 2025-11-06 |
| Baird | Maintain | Outperform | 2025-11-06 |
| Jefferies | Maintain | Buy | 2025-11-06 |
| BMO Capital | Maintain | Outperform | 2025-11-06 |
| Wells Fargo | Maintain | Overweight | 2025-10-14 |
| Barclays | Maintain | Overweight | 2025-10-02 |
| Needham | Maintain | Buy | 2025-10-02 |
PTC Inc. Grades
The table below summarizes recent institutional grades for PTC Inc.
| Grading Company | Action | New Grade | Date |
|---|---|---|---|
| Citigroup | Maintain | Neutral | 2026-01-28 |
| Oppenheimer | Maintain | Outperform | 2026-01-28 |
| Rosenblatt | Maintain | Buy | 2026-01-27 |
| Piper Sandler | Maintain | Neutral | 2025-11-07 |
| Rosenblatt | Maintain | Buy | 2025-11-06 |
| Rosenblatt | Maintain | Buy | 2025-10-30 |
| Oppenheimer | Maintain | Outperform | 2025-07-31 |
| Keybanc | Maintain | Overweight | 2025-07-31 |
| Piper Sandler | Maintain | Neutral | 2025-07-31 |
| Rosenblatt | Maintain | Buy | 2025-07-31 |
Which company has the best grades?
Fair Isaac Corporation consistently earns Buy and Outperform ratings, signaling strong institutional confidence. PTC Inc. shows a mix of Buy, Outperform, and Neutral ratings. Investors may interpret Fair Isaac’s steadier, higher grades as a sign of stronger analyst conviction.
Risks specific to each company
The following categories identify critical pressure points and systemic threats facing both firms in the 2026 market environment:
1. Market & Competition
Fair Isaac Corporation
- Faces intense competition in analytics and decision software with rising innovation demands.
PTC Inc.
- Competes in diversified software platforms with strong emphasis on digital transformation and AR.
2. Capital Structure & Debt
Fair Isaac Corporation
- High debt-to-assets at 164.6% is a significant red flag despite favorable interest coverage.
PTC Inc.
- Maintains conservative debt levels with 20.7% debt-to-assets and strong interest coverage of 12.95x.
3. Stock Volatility
Fair Isaac Corporation
- Beta of 1.293 indicates higher volatility than the market, increasing risk in turbulent conditions.
PTC Inc.
- Beta near 1.014 suggests stock volatility close to market average, reflecting moderate risk.
4. Regulatory & Legal
Fair Isaac Corporation
- Subject to data privacy regulations and compliance risks in multiple jurisdictions.
PTC Inc.
- Faces regulatory scrutiny linked to software services and international operations but with robust compliance.
5. Supply Chain & Operations
Fair Isaac Corporation
- Relies on digital platforms and cloud infrastructure, vulnerable to service disruptions.
PTC Inc.
- Operates a complex software ecosystem requiring seamless integration; operational risks in scaling cloud services.
6. ESG & Climate Transition
Fair Isaac Corporation
- Limited direct climate impact but increasing pressure to improve ESG reporting and sustainable data centers.
PTC Inc.
- Active in sustainability software solutions, faces pressure to enhance ESG disclosures and reduce carbon footprint.
7. Geopolitical Exposure
Fair Isaac Corporation
- Exposure across Americas, EMEA, and APAC creates risks from geopolitical tensions and trade restrictions.
PTC Inc.
- Global operations also subject to geopolitical risks but diversified client base mitigates localized impacts.
Which company shows a better risk-adjusted profile?
Fair Isaac’s largest risk is its strained capital structure with excessive leverage undermining financial flexibility. PTC’s main concern lies in comparatively lower asset turnover, signaling operational efficiency challenges. Overall, PTC presents a better risk-adjusted profile, supported by a safer debt level and stronger Piotroski score. Recent data show Fair Isaac’s debt-to-assets at a troubling 164.6%, justifying caution.
Final Verdict: Which stock to choose?
Fair Isaac Corporation (FICO) showcases a superpower in its outstanding capital efficiency and value creation, delivering a ROIC far above its cost of capital. Its point of vigilance lies in a stretched balance sheet and weak current ratio, signaling liquidity risk. FICO suits aggressive growth portfolios willing to embrace volatility for premium returns.
PTC Inc. defends a strategic moat with steady recurring revenues and disciplined debt management, offering more balance sheet stability than FICO. Its moderate valuation and solid profitability growth appeal to investors seeking growth at a reasonable price, fitting well in GARP-focused portfolios that prioritize sustainability alongside expansion.
If you prioritize aggressive growth and capital efficiency, FICO is the compelling choice due to its superior ROIC and value creation despite liquidity concerns. However, if you seek a more stable balance sheet and consistent earnings growth, PTC offers better stability and a reliable moat, commanding a reasonable premium for risk-conscious investors.
Disclaimer: Investment carries a risk of loss of initial capital. The past performance is not a reliable indicator of future results. Be sure to understand risks before making an investment decision.
Go Further
I encourage you to read the complete analyses of Fair Isaac Corporation and PTC Inc. to enhance your investment decisions: