Home > Comparison > Technology > FICO vs PERF
The strategic rivalry between Fair Isaac Corporation and Perfect Corp. shapes innovation in the technology sector. Fair Isaac, a mature software application leader, focuses on advanced analytics and decision management. Perfect Corp. innovates with AI-driven augmented reality in beauty tech, representing a nimble SaaS pioneer. This analysis pits established operational scale against agile growth potential to identify which trajectory delivers superior risk-adjusted returns for a diversified portfolio.
Table of contents
Companies Overview
Fair Isaac Corporation and Perfect Corp. lead distinct niches within the software application sector, shaping innovation in analytics and AI-driven beauty tech.
Fair Isaac Corporation: Pioneer in Decision Analytics
Fair Isaac Corporation dominates decision analytics with its dual focus on Scores and Software segments. It generates revenue by delivering advanced scoring solutions and modular decision management software. In 2026, the company strategically emphasizes expanding its software platform to embed analytics deeper into client transaction and risk management processes worldwide.
Perfect Corp.: Innovator in AI Beauty Tech
Perfect Corp. specializes in SaaS AI and augmented reality applications tailored for beauty and fashion industries. Its revenue stems from virtual try-on and AI-based personalization services, enhancing customer engagement. The company’s 2026 strategy centers on scaling its AI-powered solutions to capture growing demand for immersive digital experiences in global retail markets.
Strategic Collision: Similarities & Divergences
Both companies rely on software innovation but diverge sharply in focus—Fair Isaac drives enterprise decision automation, while Perfect Corp. targets consumer-facing AI beauty tech. Their primary battleground is technological leadership in specialized software solutions. This contrast creates distinct investment profiles: one anchored in B2B analytics, the other in fast-evolving consumer AI applications.
Income Statement Comparison
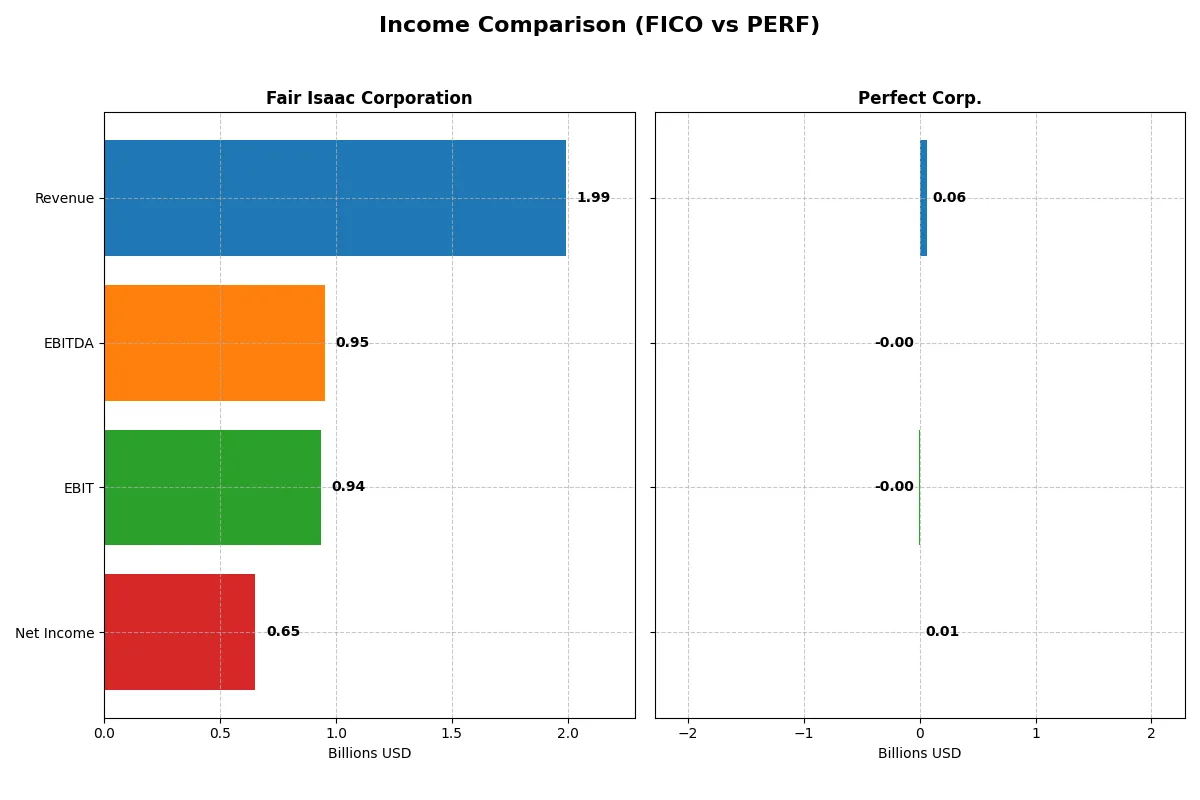
This data dissects the core profitability and scalability of both corporate engines to reveal who dominates the bottom line:
| Metric | Fair Isaac Corporation (FICO) | Perfect Corp. (PERF) |
|---|---|---|
| Revenue | 1.99B | 60.2M |
| Cost of Revenue | 354M | 13.3M |
| Operating Expenses | 712M | 50.1M |
| Gross Profit | 1.64B | 46.9M |
| EBITDA | 951M | -2.0M |
| EBIT | 936M | -2.8M |
| Interest Expense | 134M | 7K |
| Net Income | 652M | 5.0M |
| EPS | 26.9 | 0.05 |
| Fiscal Year | 2025 | 2024 |
Income Statement Analysis: The Bottom-Line Duel
This income statement comparison exposes the true operating efficiency and profitability trends driving each company’s financial engine.
Fair Isaac Corporation (FICO) Analysis
FICO’s revenue climbs steadily from $1.32B in 2021 to $1.99B in 2025, with net income surging from $392M to $652M. Its gross margin remains robust above 82%, while net margin improves to 32.75%. The 2025 fiscal year highlights strong momentum, with a 15.9% revenue growth and 9.7% net margin expansion, underscoring operational efficiency.
Perfect Corp. (PERF) Analysis
PERF’s revenue doubles from $30M in 2020 to $60M in 2024, but net income swings widely, recovering from a -$161M loss in 2022 to a modest $5M profit in 2024. Its gross margin holds favorably at 78%, yet EBIT margin stays negative at -4.7%. The latest year shows revenue growth of 12.5%, but net margin shrinks by 17.6%, revealing ongoing profitability challenges.
Margin Mastery vs. Growth Gambit
FICO’s income statement exhibits superior margin strength and steady profit growth, making it the clear fundamental leader. PERF’s impressive top-line expansion masks persistent operating losses and volatile margins. For investors prioritizing consistent earnings and efficiency, FICO’s profile offers greater reliability and financial discipline.
Financial Ratios Comparison
These vital ratios act as a diagnostic tool to expose the underlying fiscal health, valuation premiums, and capital efficiency of each company:
| Ratios | Fair Isaac Corporation (FICO) | Perfect Corp. (PERF) |
|---|---|---|
| ROE | -37.3% | 3.42% |
| ROIC | 52.96% | -2.10% |
| P/E | 55.6 | 56.6 |
| P/B | -20.8 | 1.93 |
| Current Ratio | 0.83 | 5.52 |
| Quick Ratio | 0.83 | 5.52 |
| D/E | -1.76 | 0.0035 |
| Debt-to-Assets | 1.65 | 0.0028 |
| Interest Coverage | 6.92 | -449 |
| Asset Turnover | 1.07 | 0.33 |
| Fixed Asset Turnover | 21.2 | 57.9 |
| Payout ratio | 0 | 0 |
| Dividend yield | 0 | 0 |
| Fiscal Year | 2025 | 2024 |
Efficiency & Valuation Duel: The Vital Signs
Financial ratios act as a company’s DNA, unveiling hidden risks and operational excellence critical for investment decisions.
Fair Isaac Corporation
Fair Isaac shows strong profitability with a 32.75% net margin and a robust 52.96% ROIC, highlighting operational efficiency. However, its negative ROE at -37.34% and a high P/E of 55.64 signal valuation stretch. The company pays no dividends, focusing instead on R&D reinvestment, which supports growth but raises shareholder return concerns.
Perfect Corp.
Perfect Corp. posts a modest 8.34% net margin and a slight positive ROE of 3.42%, reflecting limited profitability. Its P/E ratio stands similarly high at 56.6, suggesting expensive valuation relative to earnings. The firm offers no dividend and shows a negative ROIC, indicating reinvestment challenges. Current ratio is strong, but interest coverage is deeply negative, signaling financial stress.
Valuation Stretch vs. Operational Efficiency
Fair Isaac’s elevated valuation comes with solid operational returns, while Perfect Corp. struggles with profitability and financial stability despite similar price multiples. Investors seeking operational robustness may lean toward Fair Isaac, whereas risk-tolerant investors might consider Perfect Corp.’s turnaround potential.
Which one offers the Superior Shareholder Reward?
Fair Isaac Corporation (FICO) and Perfect Corp. (PERF) both eschew dividends, preferring reinvestment and buybacks. FICO generates robust free cash flow (31.8/share in 2025) with no dividend payout, fueling consistent buybacks and high margins (EBIT ~47%). PERF posts modest net margins (~8%) and free cash flow (~0.13/share), with minimal buyback evidence but strong liquidity (cash ratio ~3.95). FICO’s aggressive buybacks and superior cash flow underpin a more sustainable shareholder return. I find FICO offers the superior total return profile for 2026 investors, balancing growth and capital return prudently.
Comparative Score Analysis: The Strategic Profile
The radar chart reveals the fundamental DNA and trade-offs of Fair Isaac Corporation and Perfect Corp., highlighting their distinct strategic strengths and vulnerabilities:
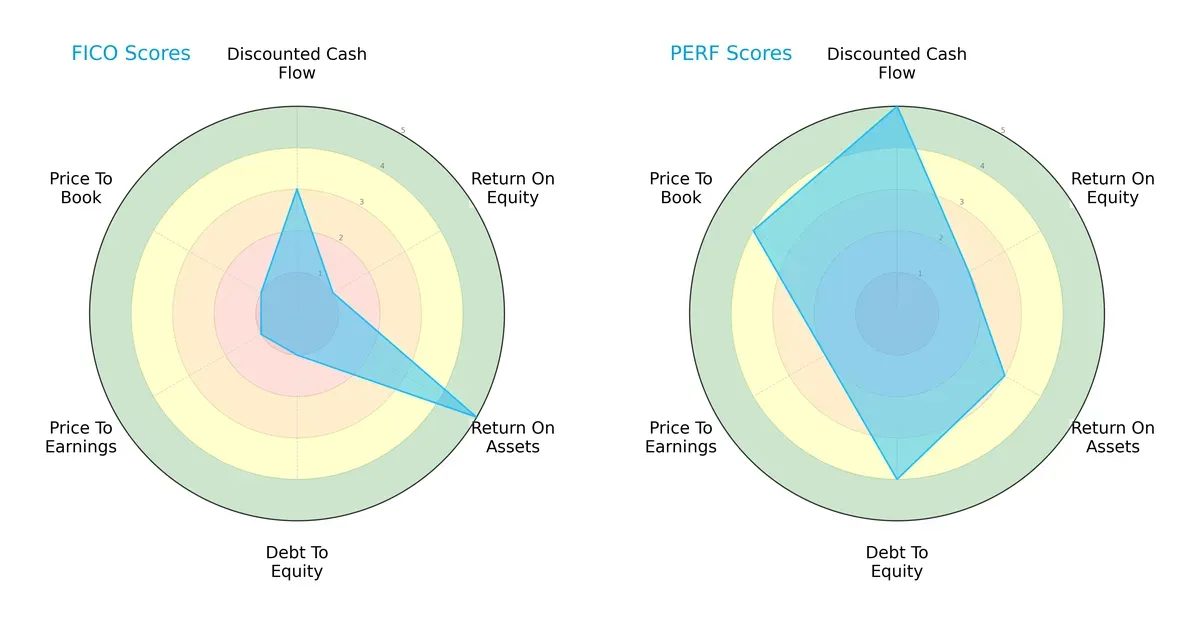
Perfect Corp. leads with higher scores in Discounted Cash Flow (5 vs. 3), Debt/Equity (4 vs. 1), and Valuation metrics (P/E 2 vs. 1, P/B 4 vs. 1), reflecting a stronger balance sheet and more favorable market valuation. Fair Isaac Corporation shows a robust Return on Assets (5 vs. 3) but struggles on Return on Equity (1 vs. 2) and debt management. Perfect Corp. exhibits a more balanced profile, while Fair Isaac relies heavily on asset efficiency but carries financial risk and valuation concerns.
Bankruptcy Risk: Solvency Showdown
The Altman Z-Score starkly contrasts the firms’ solvency: Fair Isaac scores 12.2, signaling a very safe zone, while Perfect Corp. scores 1.1, placing it in distress territory:
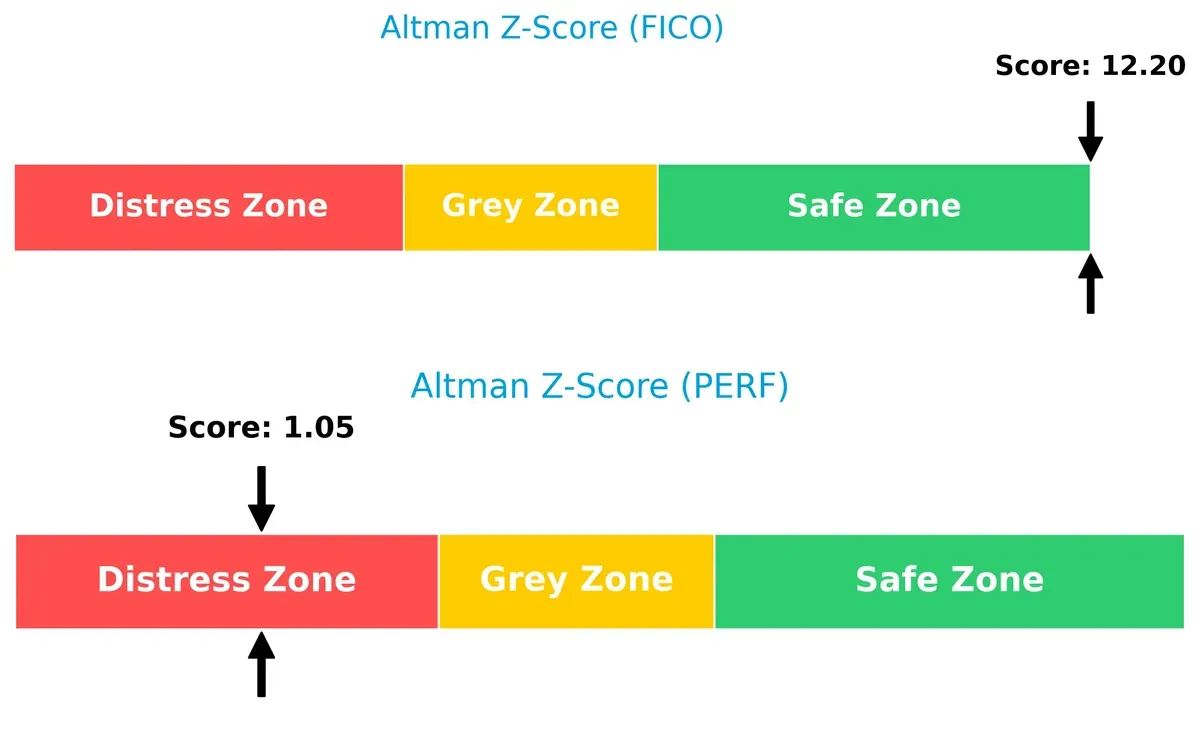
Fair Isaac’s high Z-Score indicates strong financial resilience and low bankruptcy risk amid market cycles. Conversely, Perfect Corp.’s low score warns of potential distress, urging caution despite its market strengths.
Financial Health: Quality of Operations
Fair Isaac attains a Piotroski F-Score of 7, denoting strong financial operations, whereas Perfect Corp. scores 6, which is average but less reassuring:
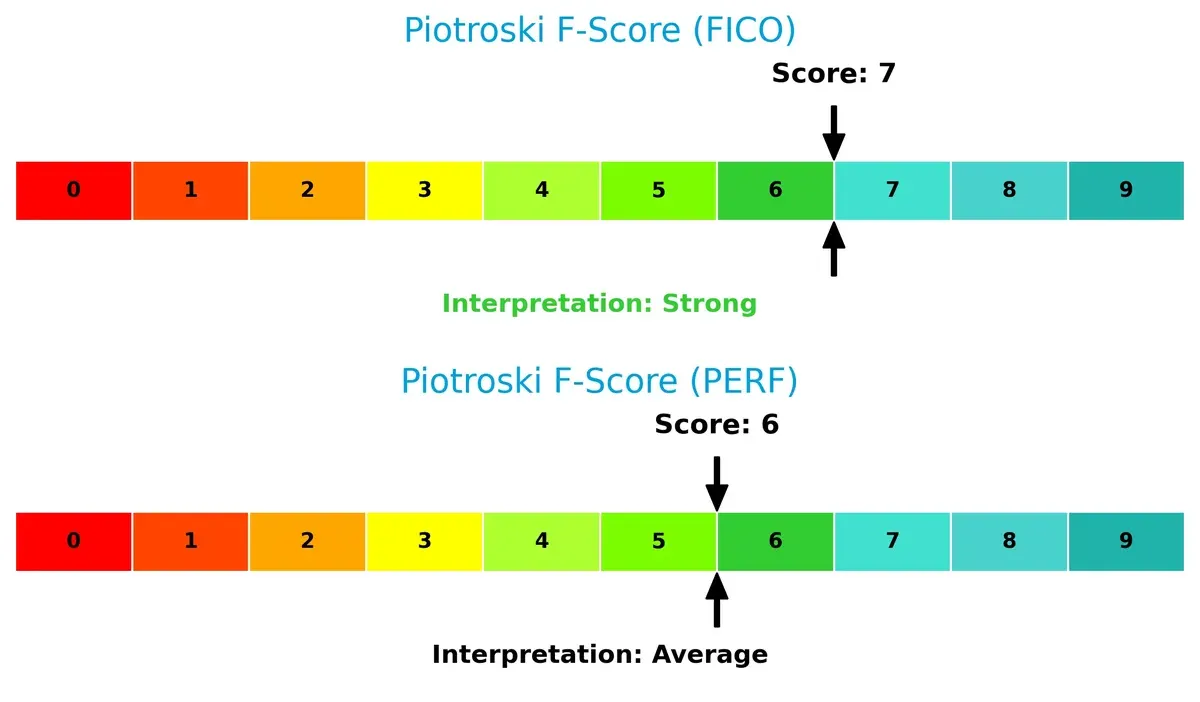
Fair Isaac’s higher score suggests healthier internal metrics and operational quality, while Perfect Corp.’s average score raises red flags about its financial robustness. Investors should weigh Perfect’s market appeal against its operational vulnerabilities.
How are the two companies positioned?
This section dissects the operational DNA of FICO and PERF by comparing their revenue distribution by segment and internal dynamics. The goal is to confront their economic moats and identify which model offers the most resilient competitive advantage today.
Revenue Segmentation: The Strategic Mix
The following visual comparison dissects how both firms diversify their income streams and where their primary sector bets lie:
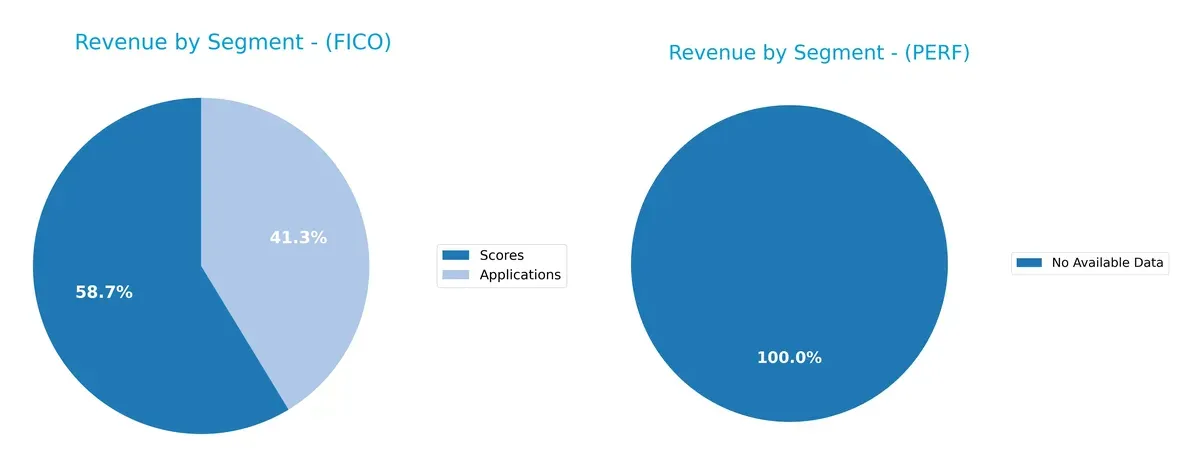
Fair Isaac Corporation (FICO) displays a balanced revenue split between Scores at $1.17B and Applications at $822M for 2025. This diversified mix contrasts with Perfect Corp., for which I found no available data to evaluate segmentation. FICO’s dual focus anchors its ecosystem lock-in, reducing concentration risk while leveraging infrastructure dominance in credit scoring and application solutions. This blend supports resilient growth amid market volatility.
Strengths and Weaknesses Comparison
This table compares the strengths and weaknesses of Fair Isaac Corporation and Perfect Corp.:
FICO Strengths
- Strong profitability with 32.75% net margin
- High ROIC at 52.96% exceeding WACC
- Favorable debt-to-equity and interest coverage ratios
- Diverse product revenue from Applications and Scores
- Significant global presence, especially in Americas
PERF Strengths
- Favorable WACC at 5.93% indicating efficient capital cost
- Strong fixed asset turnover at 57.94
- Favorable quick ratio and zero debt-to-equity
- Geographic diversification including Americas, Asia Pacific, Europe
- Positive but modest profitability
FICO Weaknesses
- Negative ROE at -37.34% signals poor shareholder returns
- High debt-to-assets at 165% implies leverage risk
- Unfavorable current ratio below 1 indicates liquidity concerns
- High P/E at 55.64 suggests expensive valuation
- No dividend yield may deter income investors
PERF Weaknesses
- Negative ROIC at -2.1% reflects inefficient capital use
- Unfavorable interest coverage at -406 warns of earnings risk
- Low asset turnover at 0.33 shows weak operational efficiency
- Unfavorable high current ratio may indicate asset inefficiency
- High P/E at 56.6 signals expensive valuation
FICO excels in profitability and capital efficiency but faces leverage and liquidity risks. PERF shows strengths in asset management and capital costs but struggles with returns and earnings coverage. Both companies exhibit valuation concerns that investors should monitor closely.
The Moat Duel: Analyzing Competitive Defensibility
A structural moat is the only true shield protecting long-term profits from relentless competition erosion. Let’s examine these firms’ moats:
Fair Isaac Corporation (FICO): Data Analytics Moat Anchored by Intangible Assets
FICO’s moat stems from proprietary data models and decision management software, reflected in a robust 43.6% ROIC premium over WACC. Its 82% gross margin and widening profitability signal durable pricing power. Expansion into AI-driven credit risk and fraud solutions in 2026 could deepen this moat further.
Perfect Corp. (PERF): Innovation-Driven Moat with Emerging AI and AR Tech
Perfect Corp. leverages cutting-edge AI and AR in beauty tech, a distinct moat from FICO’s data analytics. However, negative ROIC vs. WACC shows value destruction despite revenue momentum. Sustained innovation and global market penetration will be critical for turning rising profitability into lasting competitive advantage.
Moat Resilience: Proprietary Data Models vs. Emerging AI Innovation
FICO’s wider and more durable moat outperforms Perfect Corp.’s promising but unproven AI/AR edge. FICO’s strong capital efficiency equips it better to defend market share, while Perfect must prove its innovation converts to sustainable returns.
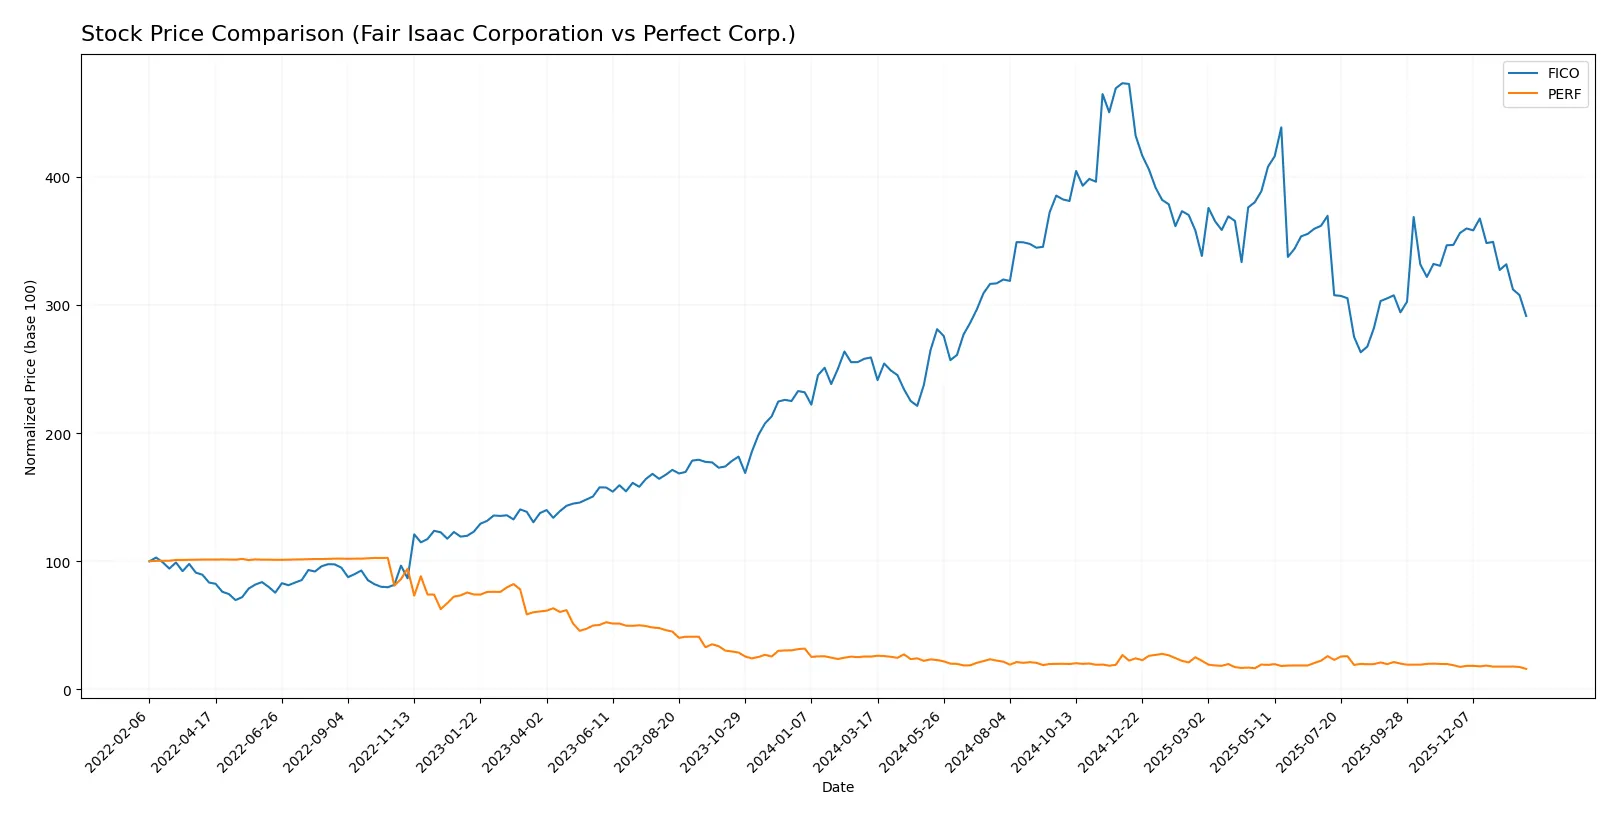
Which stock offers better returns?
Fair Isaac Corporation’s stock climbed 12.5% over the past year, showing a decelerating bullish trend with a wide price range. Perfect Corp. experienced a sharp 37.4% decline, confirming a decelerating bearish trend.
Trend Comparison
FICO’s stock rose 12.5% over 12 months, indicating a bullish trend with decelerating momentum and a high price volatility range between 1,111 and 2,375.
PERF’s stock dropped 37.4% over the same period, reflecting a strong bearish trend with deceleration and very low price volatility between 1.56 and 2.7.
FICO outperformed PERF, delivering the highest market returns despite recent short-term weakness.
Target Prices
The analyst consensus for Fair Isaac Corporation (FICO) and Perfect Corp. (PERF) reveals differing outlooks rooted in their market positions.
| Company | Target Low | Target High | Consensus |
|---|---|---|---|
| Fair Isaac Corporation | 1640 | 2400 | 2115 |
| Perfect Corp. | 7 | 7 | 7 |
Analysts expect FICO shares to appreciate significantly from the current 1463, signaling confidence in its moat and growth. PERF’s consensus target at 7 far exceeds its 1.56 price, reflecting high growth expectations but also increased risk.

Don’t Let Luck Decide Your Entry Point
Optimize your entry points with our advanced ProRealTime indicators. You’ll get efficient buy signals with precise price targets for maximum performance. Start outperforming now!
How do institutions grade them?
Here is a comparison of the latest institutional grades for Fair Isaac Corporation and Perfect Corp.:
Fair Isaac Corporation Grades
The following table summarizes recent grades assigned by major institutions to Fair Isaac Corporation:
| Grading Company | Action | New Grade | Date |
|---|---|---|---|
| Needham | Maintain | Buy | 2026-01-29 |
| Jefferies | Maintain | Buy | 2026-01-16 |
| Wells Fargo | Maintain | Overweight | 2026-01-14 |
| JP Morgan | Maintain | Neutral | 2025-11-06 |
| Baird | Maintain | Outperform | 2025-11-06 |
| Jefferies | Maintain | Buy | 2025-11-06 |
| BMO Capital | Maintain | Outperform | 2025-11-06 |
| Wells Fargo | Maintain | Overweight | 2025-10-14 |
| Barclays | Maintain | Overweight | 2025-10-02 |
| Needham | Maintain | Buy | 2025-10-02 |
Perfect Corp. Grades
The following table summarizes recent grades assigned by major institutions to Perfect Corp.:
| Grading Company | Action | New Grade | Date |
|---|---|---|---|
| Piper Sandler | Maintain | Neutral | 2024-02-29 |
| Goldman Sachs | Maintain | Neutral | 2023-10-26 |
| Piper Sandler | Maintain | Neutral | 2023-10-25 |
| Piper Sandler | Maintain | Neutral | 2023-07-26 |
| Piper Sandler | Maintain | Neutral | 2023-07-25 |
| Piper Sandler | Maintain | Neutral | 2023-04-27 |
| Oppenheimer | Downgrade | Perform | 2023-04-20 |
| Oppenheimer | Downgrade | Perform | 2023-04-19 |
| Oppenheimer | Downgrade | Perform | 2023-04-18 |
| Piper Sandler | Maintain | Neutral | 2023-03-08 |
Which company has the best grades?
Fair Isaac Corporation consistently earns Buy, Outperform, and Overweight ratings from multiple top-tier institutions. Perfect Corp.’s grades mostly remain Neutral, with some recent downgrades to Perform. Investors may view Fair Isaac’s stronger grades as reflecting greater confidence and potential upside.
Risks specific to each company
The following categories identify the critical pressure points and systemic threats facing both firms in the 2026 market environment:
1. Market & Competition
Fair Isaac Corporation
- Established player with strong analytics moat but high valuation pressure. Faces intense software application competition.
Perfect Corp.
- Emerging AI and AR niche with rapid innovation but limited scale and fierce tech competition.
2. Capital Structure & Debt
Fair Isaac Corporation
- High debt-to-assets ratio at 165% signals leverage risk despite good interest coverage.
Perfect Corp.
- Minimal debt, very low leverage, but negative interest coverage due to operational losses.
3. Stock Volatility
Fair Isaac Corporation
- Beta 1.29 indicates above-market volatility; wide trading range heightens price risk.
Perfect Corp.
- Low beta 0.45 suggests defensive profile; share price is low and illiquid, raising liquidity risk.
4. Regulatory & Legal
Fair Isaac Corporation
- Operates globally with compliance complexity in data privacy and financial regulations.
Perfect Corp.
- Faces emerging regulatory scrutiny on AI ethics and data usage in Asia-Pacific markets.
5. Supply Chain & Operations
Fair Isaac Corporation
- Software delivery reliant on cloud infrastructure stability; established operational processes.
Perfect Corp.
- Highly dependent on cutting-edge AI talent and technology partnerships; operational scaling risk.
6. ESG & Climate Transition
Fair Isaac Corporation
- Moderate ESG focus with growing demand for sustainable analytics solutions.
Perfect Corp.
- Early-stage ESG policies; climate impact limited but reputational risk in AI ethics rising.
7. Geopolitical Exposure
Fair Isaac Corporation
- Global footprint exposes it to US-China tensions and data sovereignty laws.
Perfect Corp.
- Taiwan base subjects it to cross-strait geopolitical risks and regional tech export controls.
Which company shows a better risk-adjusted profile?
The most impactful risk for Fair Isaac Corporation is its excessive leverage, which could strain financial flexibility amid market volatility. For Perfect Corp., the key concern is its financial distress indicated by a very low Altman Z-score and operational losses. Despite scale and valuation concerns, Fair Isaac displays a safer financial footing and stronger profitability metrics. Conversely, Perfect Corp.’s balance sheet fragility and lower profitability heighten risk. Recent data underscore Fair Isaac’s robust Altman Z-score of 12.2 placing it in the safe zone, while Perfect Corp.’s 1.05 signals distress. Overall, Fair Isaac offers a better risk-adjusted profile for prudent investors in 2026.
Final Verdict: Which stock to choose?
Fair Isaac Corporation (FICO) shines with a durable competitive advantage driven by an impressive ROIC that far exceeds its cost of capital. Its superpower lies in exceptional capital efficiency and consistent value creation, although its low current ratio signals a liquidity point of vigilance. FICO suits investors targeting aggressive growth with a focus on profitability and operational excellence.
Perfect Corp. (PERF) offers a strategic moat anchored in its solid balance sheet and robust liquidity, evidenced by a very high current ratio and negligible debt. This provides a safety cushion compared to FICO’s leverage concerns. However, value creation remains a challenge, with ROIC below WACC, making PERF more fitting for portfolios that emphasize growth at a reasonable price and capital preservation.
If you prioritize aggressive growth and durable value creation, FICO is the compelling choice due to its superior capital returns and market position. However, if you seek stability and a strong liquidity profile with moderate growth prospects, PERF offers better safety despite its weaker profitability metrics. Both present distinct analytical scenarios aligned with different investor appetites.
Disclaimer: Investment carries a risk of loss of initial capital. The past performance is not a reliable indicator of future results. Be sure to understand risks before making an investment decision.
Go Further
I encourage you to read the complete analyses of Fair Isaac Corporation and Perfect Corp. to enhance your investment decisions: